
Automated reporting means the week's numbers arrive in your inbox without you logging in or rebuilding a spreadsheet. For a Shopify brand, automated e-commerce reports have to pull store sales, ad spend and the books into one place first. Luca AI does that, then sends you a Monday health digest and a weekly review by email. Any other report you ask for can be sent by email or as a PDF.
At a glance
| Question | Answer |
|---|---|
| What arrives on a schedule? | A Monday health digest and a weekly review, by email |
| What can I get on request? | Any report by email, or any conversation exported as a PDF |
| Where do the numbers come from? | Your connected Shopify store, ad accounts, Amazon and Xero or QuickBooks |
| Do I need to log in to read them? | No. The digests arrive by email |
| How fresh are the figures? | Luca keeps your KPIs up to date daily |
| Can Luca change anything in my store or ads? | No. Luca only reads your data |
| Who sets up my data? | You connect Shopify yourself, and the Luca team maps your data with you during onboarding |
What automated e-commerce reports in Luca are
Luca's automated e-commerce reports come in two kinds. The first kind arrives on a schedule: a Monday health digest and a weekly review, both sent by email. The second kind arrives when you ask: you can have any report sent by email, or export any conversation as a PDF.
Both kinds draw on the same numbers. Luca brings your sources into one private data warehouse for your brand. It calculates your KPIs on top of that warehouse and keeps them up to date daily. So the figure in Monday's digest matches the figure you'd get by asking in chat or opening a dashboard. The KPI reporting page explains how those shared definitions work.
What you see
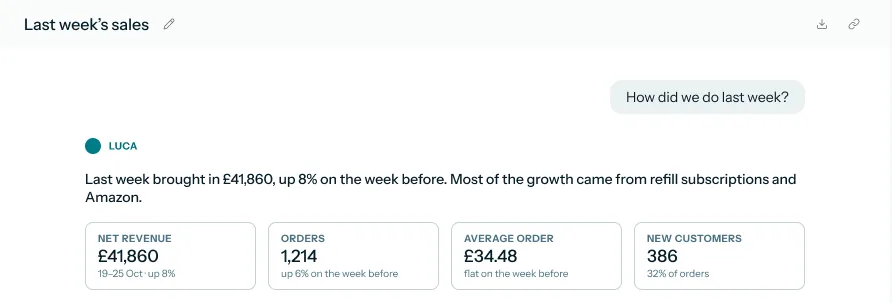
The weekly review answers the question most founders ask first: how did we do last week? You can also ask that question yourself at any time. Luca answers in plain English with figures, a chart where useful and next steps. Each figure links to the table it came from, so you can check it.
 Illustrative example · demo brand
A weekly answer like this is what the review puts in front of you, with each tile compared with the week before. The figures are sample data for a demo brand.
What it is not
It isn't a report builder where you design layouts or set send times and recipient rules. Luca sends the digests it offers, and sends other reports when you ask. It also isn't an attribution tool. Ad figures in a report are what each platform reports, set beside your store revenue, and Luca doesn't tie any order to a particular ad or campaign.
Why automated e-commerce reports matter
What it's for
Automated reports put the week's numbers in front of you without anyone building them. You read the result, decide what to do and get on with the week. That matters most when you're away from your desk.
How it helps
- No Monday rebuild. The digest arrives already built, so the morning goes on decisions instead of copying exports.
- No login needed. The weekly numbers come to your inbox, which works from a phone between meetings.
- One version of each number. Digests, chat and dashboards use the same KPI definitions, so figures don't drift between reports.
- Store, ads and books together. Shopify sales sit beside ad spend and your Xero or QuickBooks figures.
- Anything else on request. Ask for a report and have it sent by email or as a PDF.
What happens without it
Someone rebuilds the same report every week. When that person is busy, travelling or ill, the report is late or never arrives. Decisions then wait, or get made on last month's numbers.
Why buyers care
Founders care when they spend the week away from the business and still need to know how it is doing. Finance leads care when the same weekly figures go to several people and must match. Both feel it most in busy trading weeks.
The Luca AI approach to automated e-commerce reports
Think of the founder of a Shopify leather-goods brand who spends much of the month at trade fairs. Bags, belts and wallets sell online while they stand at a stand. They want the week's numbers in their inbox on Monday. They don't want to log in, and they don't want to rebuild a spreadsheet from a hotel room.
The usual workaround is a spreadsheet that someone refreshes by hand each week. It pulls a Shopify export, a Meta export, a Google Ads export and a figure from the books. It often takes most of a morning, and it tends to break when a column moves. When the founder is away, it is often the first job that slips.
The job itself hasn't changed: know how last week went, spot what moved and decide what to do about it. What has changed is where the numbers live. Sales, ad spend and costs now sit in different systems, and each sends its own email with its own idea of the truth.
Luca AI joins those sources first, then reports from the joined numbers. It sends a Monday health digest and a weekly review by email. It sends any other report by email or as a PDF when you ask. It only reads your data and never changes your store, ads, email or books.
Luca's row in the comparison grid shows a scheduled digest, accounting data and a written review side by side. That is covered in How Luca AI compares for automated e-commerce reports, below.
How automated e-commerce reports get built
There are four common ways to get a weekly report in front of a founder. Each catches some problems and misses others.
A spreadsheet rebuilt by hand
Someone exports each platform and pastes the figures into a sheet. It can hold anything you like. It misses whatever the person forgets, and it goes stale the moment it is finished. It also depends on one person being free each week.
Each platform's own emails
Shopify, the ad platforms and your accounting tool each have their own reports. Each one is accurate about itself. None of them shows the whole business, and each ad platform reports results on its own terms. You still do the joining in your head.
Scheduled dashboard emails
Analytics tools can email a dashboard on a timetable you set. This saves the copying. It misses the explanation: a chart arrives, but nobody says what changed or why it matters. Someone also has to build and maintain the dashboard first.
A written digest
A written digest says what moved, how much and what to look at next. It catches the story behind the numbers. It is only as good as the data under it and the definitions behind each figure.
Which of these Luca does
Luca sends written digests on a schedule: the Monday health digest and the weekly review. It builds them from your joined Shopify, ad and accounting data, using the same KPI definitions as chat. It also sends any report by email or as a PDF on request. Luca's analysts prepare a monthly written review of the business as well.
Read your Monday health digest
The Monday health digest is the first thing to read in the week. Use it to answer one question: is anything off that needs me today?
Work through it in this order:
- Check revenue against the week before. A big swing either way is worth a second look.
- Check ad spend beside revenue. Spend rising faster than revenue is the usual early warning.
- Check cash and anything in the books that looks out of line.
- Pick the one thing that needs a decision this week, and leave the rest for the weekly review.
If a figure looks wrong, ask Luca about it in chat. The answer links each figure to the table it came from, so you can trace it. For a wider view across store, ads and the ledger, the cross-source answers page shows what to ask.
Try asking Luca:
Why did revenue drop last week compared with the week before?
Run the weekly review in fifteen minutes
Luca's weekly review is built so you can run it in fifteen minutes. It suits a founder who reads it on a train or between meetings at a fair.
A useful routine looks like this:
- Read the review from top to bottom once without stopping.
- Note the two or three figures that moved most.
- For each one, ask Luca a follow-up question in chat if the reason isn't clear.
- Write down the decision, who owns it and when you'll check it.
If ads moved, compare platform-reported results with your store revenue on the ROAS analysis page. If stock looks tight, the demand forecasting page shows how to read each product's forecast before you reorder. You choose the quantity and place any order yourself.
Get any report sent by email or as a PDF
Some weeks you need more than the digest. A stockist wants sales by product, or your accountant wants the month in one file. Ask Luca for the report in chat, then have it sent by email or export the conversation as a PDF.
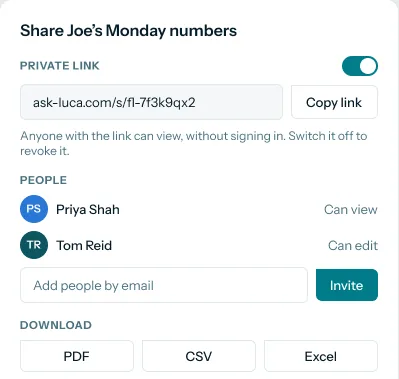
You can also share a dashboard or an answer. Luca makes frozen, private share links that you can revoke and that search engines don't index. Downloads come as CSV, Excel, Word, PDF or PowerPoint.
 Illustrative example · demo brand
The share panel is where a report leaves Luca: as a private link, an invitation by email or a PDF, CSV or Excel file. The names are sample data for a demo brand.
Before you send a PDF to someone outside the business, check the date range at the top. A report sent on Tuesday may still show last week, which is usually what you want.
How to check a weekly report is right
A weekly report is only useful if this week's figures can be compared with last week's. Two measures matter most for this job.
Week-on-week change
Week-on-week change compares this week's revenue with last week's. Shopify describes sales growth as a comparison of historical data with current sales performance. Its weak spots are easy to miss. Refunds can land after the week closes, so last week's revenue can shift. A week that starts on a different day or time zone isn't comparable either.
MER, revenue per pound of marketing
MER, the marketing efficiency ratio, is total revenue divided by total marketing spend. Shopify's guide gives the formula and advises using the same revenue and spend definitions each time. That consistency is the weak spot. If one week counts revenue before refunds and the next counts it after, the ratio moves for no real reason.
Where Luca shows them
Luca keeps your KPIs up to date daily and uses one definition for each, in digests, chat and dashboards. Each figure in an answer links to the table it came from. So when a weekly figure moves, you can trace it to the data rather than to a changed formula.
 Illustrative example · demo brand
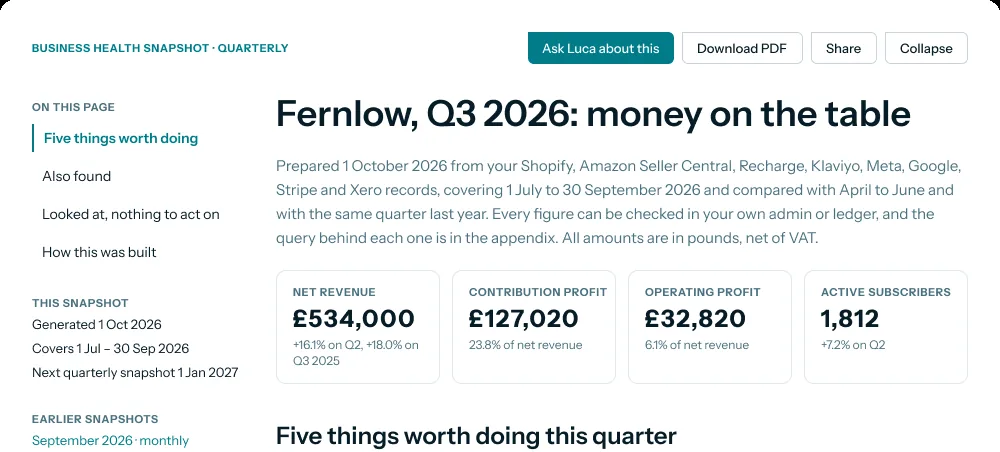
A written review names its sources and period at the top, so you can check every figure against the right data. The figures are sample data for a demo brand.
How to build a weekly e-commerce report
The manual method
- Export last week's orders from Shopify, net of refunds.
- Export spend from each ad platform for the same seven days.
- Pull cash and any large bills from Xero or QuickBooks.
- Paste everything into one sheet and line up the dates.
- Work out revenue, orders, average order value and MER for the week.
- Compare each figure with the week before and write two or three lines on what changed.
- Send the sheet or a PDF to whoever needs it.
Most of the risk sits in steps 1, 2 and 4. Date ranges that don't match and refunds that were counted twice are the common mistakes.
The same job in Luca
Luca does steps 1 to 6 from your connected sources and sends the result as the Monday health digest and the weekly review. For step 7, ask for any report by email or export the conversation as a PDF. Your part is reading the result and deciding what to do.
A worked example: one week of leather-goods sales
This is an illustrative calculation with sample figures, not a Luca output. It shows why a weekly report needs more than one number.
| Measure | Week before | Last week | How it's worked out |
|---|---|---|---|
| Net revenue | £16,000 | £18,000 | Shopify orders, net of refunds |
| Orders | 160 | 150 | Count of orders |
| Average order value | £100 | £120 | £16,000 ÷ 160; £18,000 ÷ 150 |
| Ad spend | £2,000 | £3,000 | Meta plus Google Ads |
| MER | 8.0 | 6.0 | £16,000 ÷ £2,000; £18,000 ÷ £3,000 |
| Revenue change | n/a | +12.5% | (£18,000 − £16,000) ÷ £16,000 |
Revenue rose by an eighth, which looks like a good week. But orders fell and marketing spend rose by half, so each pound of marketing brought back less. The rise came from bigger baskets, not more customers. A founder reading only the revenue line would miss that spend is climbing faster than sales.
Get your digests by email
- Connect Shopify. It connects with one-click OAuth and imports orders, products, customers, inventory, refunds, payouts and fees. The set-up guide walks through it.
- Connect your ad accounts and your accounting tool, such as Google Ads, Meta Ads, Xero or QuickBooks.
- Work through onboarding. The Luca team maps your data with you, and daily checks catch gaps and duplicates.
- Read the Monday health digest and the weekly review in your inbox.
Every connector is read-only. The read-only access page explains what Luca can and can't see.
How scheduled reports work with the rest of Luca
Shopify
Your store's orders, refunds and fees are the base of every digest. Luca imports your full Shopify history, so week-on-week and year-on-year comparisons have data behind them.
Ad platforms
Google Ads and Meta Ads data show spend beside store revenue. The figures are what each platform reports, and the ROAS analysis page shows how to read them against your margin.
Amazon
If you also sell on Amazon, Luca connects Amazon Seller Central and Amazon Ads. Orders, fees and ad performance then sit in the same weekly numbers.
Xero and QuickBooks
Xero brings your P&L, balance sheet, bank transactions, invoices and bills. QuickBooks Online brings full accounting detail. Your weekly numbers can then show cash and costs, not just sales.
Chat
Every digest is a starting point for questions. Ask in plain English about any figure, and the answer uses the same definitions. The whole-business page shows what that looks like each morning.
Written reviews
Luca's analysts prepare a monthly written review of the whole business, with the decisions that have money attached. Each review has Download PDF and Share controls, so it can go to your board or your accountant as a file.
Who uses scheduled reports, and how
Founders and CEOs
A founder who travels reads the Monday health digest first thing and the weekly review later in the week. Neither needs a login. The AI for e-commerce brands page covers the wider daily view.
CFOs and finance leads
A finance lead uses the weekly review to keep sales, ad spend and the ledger in step. When the board wants a figure in a file, they ask Luca for the report and export it as a PDF.
Growth and marketing leads
A growth lead reads spend beside revenue each week and asks follow-up questions in chat when MER moves. For retention questions, the customer retention page goes deeper.
How Luca AI compares for automated e-commerce reports
Luca sends a written Monday health digest and weekly review built from your store, ads and accounting data together. Other tools email a dashboard or export raw data on a timetable you set up yourself. Luca is the only platform in this table that does all three.
Automated e-commerce reporting features, from each platform's public documentation:
| Platform | Luca AI | Daasity | Lifetimely | Triple Whale | Northbeam | Shopify Analytics |
|---|---|---|---|---|---|---|
| Monday digest and weekly review by email | Yes | Partly (you schedule each dashboard email) | Partly (scheduled reports of key numbers) | Partly (scheduled SQL exports) | Partly (scheduled warehouse exports) | Not in docs |
| Xero or QuickBooks in the same report | Yes | Not in docs | Partly (QuickBooks cost categories only) | Not in docs | Not in docs | Not in docs |
| Monthly written review by analysts | Yes | Not in docs | Not in docs | Not in docs | Not in docs | Not in docs |
Yes: documented and built in. Partly: documented with a limit, shown in brackets. Not in docs: not found in the vendor's public documentation.
Why Luca AI is the stronger choice for automated e-commerce reports
- A digest, not a dashboard in an email. Luca sends a written Monday health digest and weekly review. Daasity documents scheduling a dashboard or saved Look to be sent by email, which you set up yourself. Read more in Daasity alternatives.
- Your books in the same report. Luca reads Xero or QuickBooks beside your store and ads. Lifetimely documents QuickBooks supplying selected cost categories. Read more in Lifetimely alternatives.
- Numbers you can read without SQL. Luca's weekly review arrives as a written report by email. Triple Whale documents one-time or scheduled exports using SQL. Read more in Triple Whale alternatives.
Competitor details checked against each vendor's public documentation on 8 November 2026. Features and plans change, so confirm with the vendor before you decide.
Limits of scheduled reports
- The digests are the ones Luca offers. Luca sends a Monday health digest and a weekly review. There's no screen for building your own schedule, send times, recipient rules or report layout.
- Delivery is by email. Scheduled digests arrive by email. Other reports go by email or as a PDF when you ask for them.
- Ad results are as each platform reports them. Reports set spend and platform-reported results beside store revenue. Luca doesn't tie a given order to a particular ad, campaign or creative.
- Reports read; they don't act. Luca is read-only, so a digest can point to a decision but never changes your store, ads, email or books.
Common questions
What is automated reporting for an e-commerce brand?
Automated reporting means your regular reports arrive without anyone building them by hand. In Luca, that means a Monday health digest and a weekly review by email, built from your Shopify, ad and accounting data.
Which scheduled reports does Luca send?
Luca sends two scheduled digests by email: a Monday health digest and a weekly review. You can also have any other report sent by email, or export any conversation as a PDF, whenever you ask.
Do I need to log in to Luca to read my weekly numbers?
No. The Monday health digest and the weekly review arrive by email, so you can read them on a phone. You only log in when you want to ask a follow-up question in chat.
Can I choose the send time and recipients myself?
Luca sends the digests it offers rather than giving you a schedule builder. There are no settings for send times, recipient rules or report layout. Speak to your Luca contact about who should receive the digests.
How long does the weekly review take to read?
Luca's weekly review is built so you can run it in fifteen minutes. Read it once, note the figures that moved most, then ask Luca follow-up questions on anything that isn't clear.
Where does the data in the digests come from?
The digests use your connected sources: Shopify, ad accounts such as Google Ads and Meta Ads, Amazon if you sell there, and Xero or QuickBooks. Luca joins them in one private data warehouse for your brand.
How up to date are the figures?
Luca calculates your KPIs and keeps them up to date daily. The figures in a digest match what you'd see in chat or on a dashboard, because all of them use the same warehouse and definitions.
Can I get a report as a PDF?
Yes. You can export any conversation with Luca as a PDF, or have any report sent by email. Shared items can also be downloaded as CSV, Excel, Word or PowerPoint.
Can I send a report to someone who doesn't use Luca?
Yes. Export the report as a PDF and send it, or share a private link. Luca's share links are frozen, private and revocable, and search engines don't index them.
Does the weekly review credit sales to individual ads?
No. Luca sets ad spend and each platform's reported results beside your store revenue. It doesn't tie any order or sale to a particular ad, campaign or creative.
Can a digest change anything in my store or ad accounts?
No. Luca only reads your data and never changes your store, ads, email or books. A digest can point to a decision, but you make it in your own systems.
What if my data is messy when I start?
Luca works even if your data is messy on day one. The Luca team maps it with you during onboarding, and daily checks catch gaps and duplicates before they reach a report.
How is the weekly review different from the monthly written review?
The weekly review covers the week just gone and arrives by email. Luca's analysts also prepare a monthly written review of the whole business, which you can download as a PDF or share.
Updated 8 November 2026: first published, with how automated reports get built, how to check a weekly report, the manual method with a worked example and thirteen common questions.