Shopify Reporting: Everything You Need to Read, Build, and Act on Store Data
8
mins read
In this article
TL;DR
Shopify reporting groups store data into six families: Sales, Finance, Customers, Behavior, Marketing, and Inventory, but it tells you what happened, not what made money.
No Shopify plan, including Plus, computes COGS-adjusted profit natively, so your top revenue SKU can hide a thin contribution margin.
Custom reports need the Advanced plan, using the ShopifyQL editor and Sidekick to build net-contribution, cohort, and blended-CAC reports.
Track stage-relevant KPIs only: conversion and AOV early, blended CAC and sell-through while scaling, cohort LTV and cash-conversion cycle at maturity.
Shopify, GA4, and Meta never match because each measures differently; trust Shopify as truth and treat gaps under roughly 8% as noise.
We built Luca AI as an AI layer that unifies sources, recommends the action, and can fund it inside one chat.
Q1. What exactly is Shopify reporting, and why does "having data" not equal "making money?" [toc=1. What Shopify Reporting Is]
Last Q4, I sat next to a founder doing $400K a month who opened her Shopify admin, stared at a green revenue line, and said, "So why is my bank account empty?" That gap, between a healthy dashboard and an empty account, is the whole problem with how most operators use Shopify reporting.
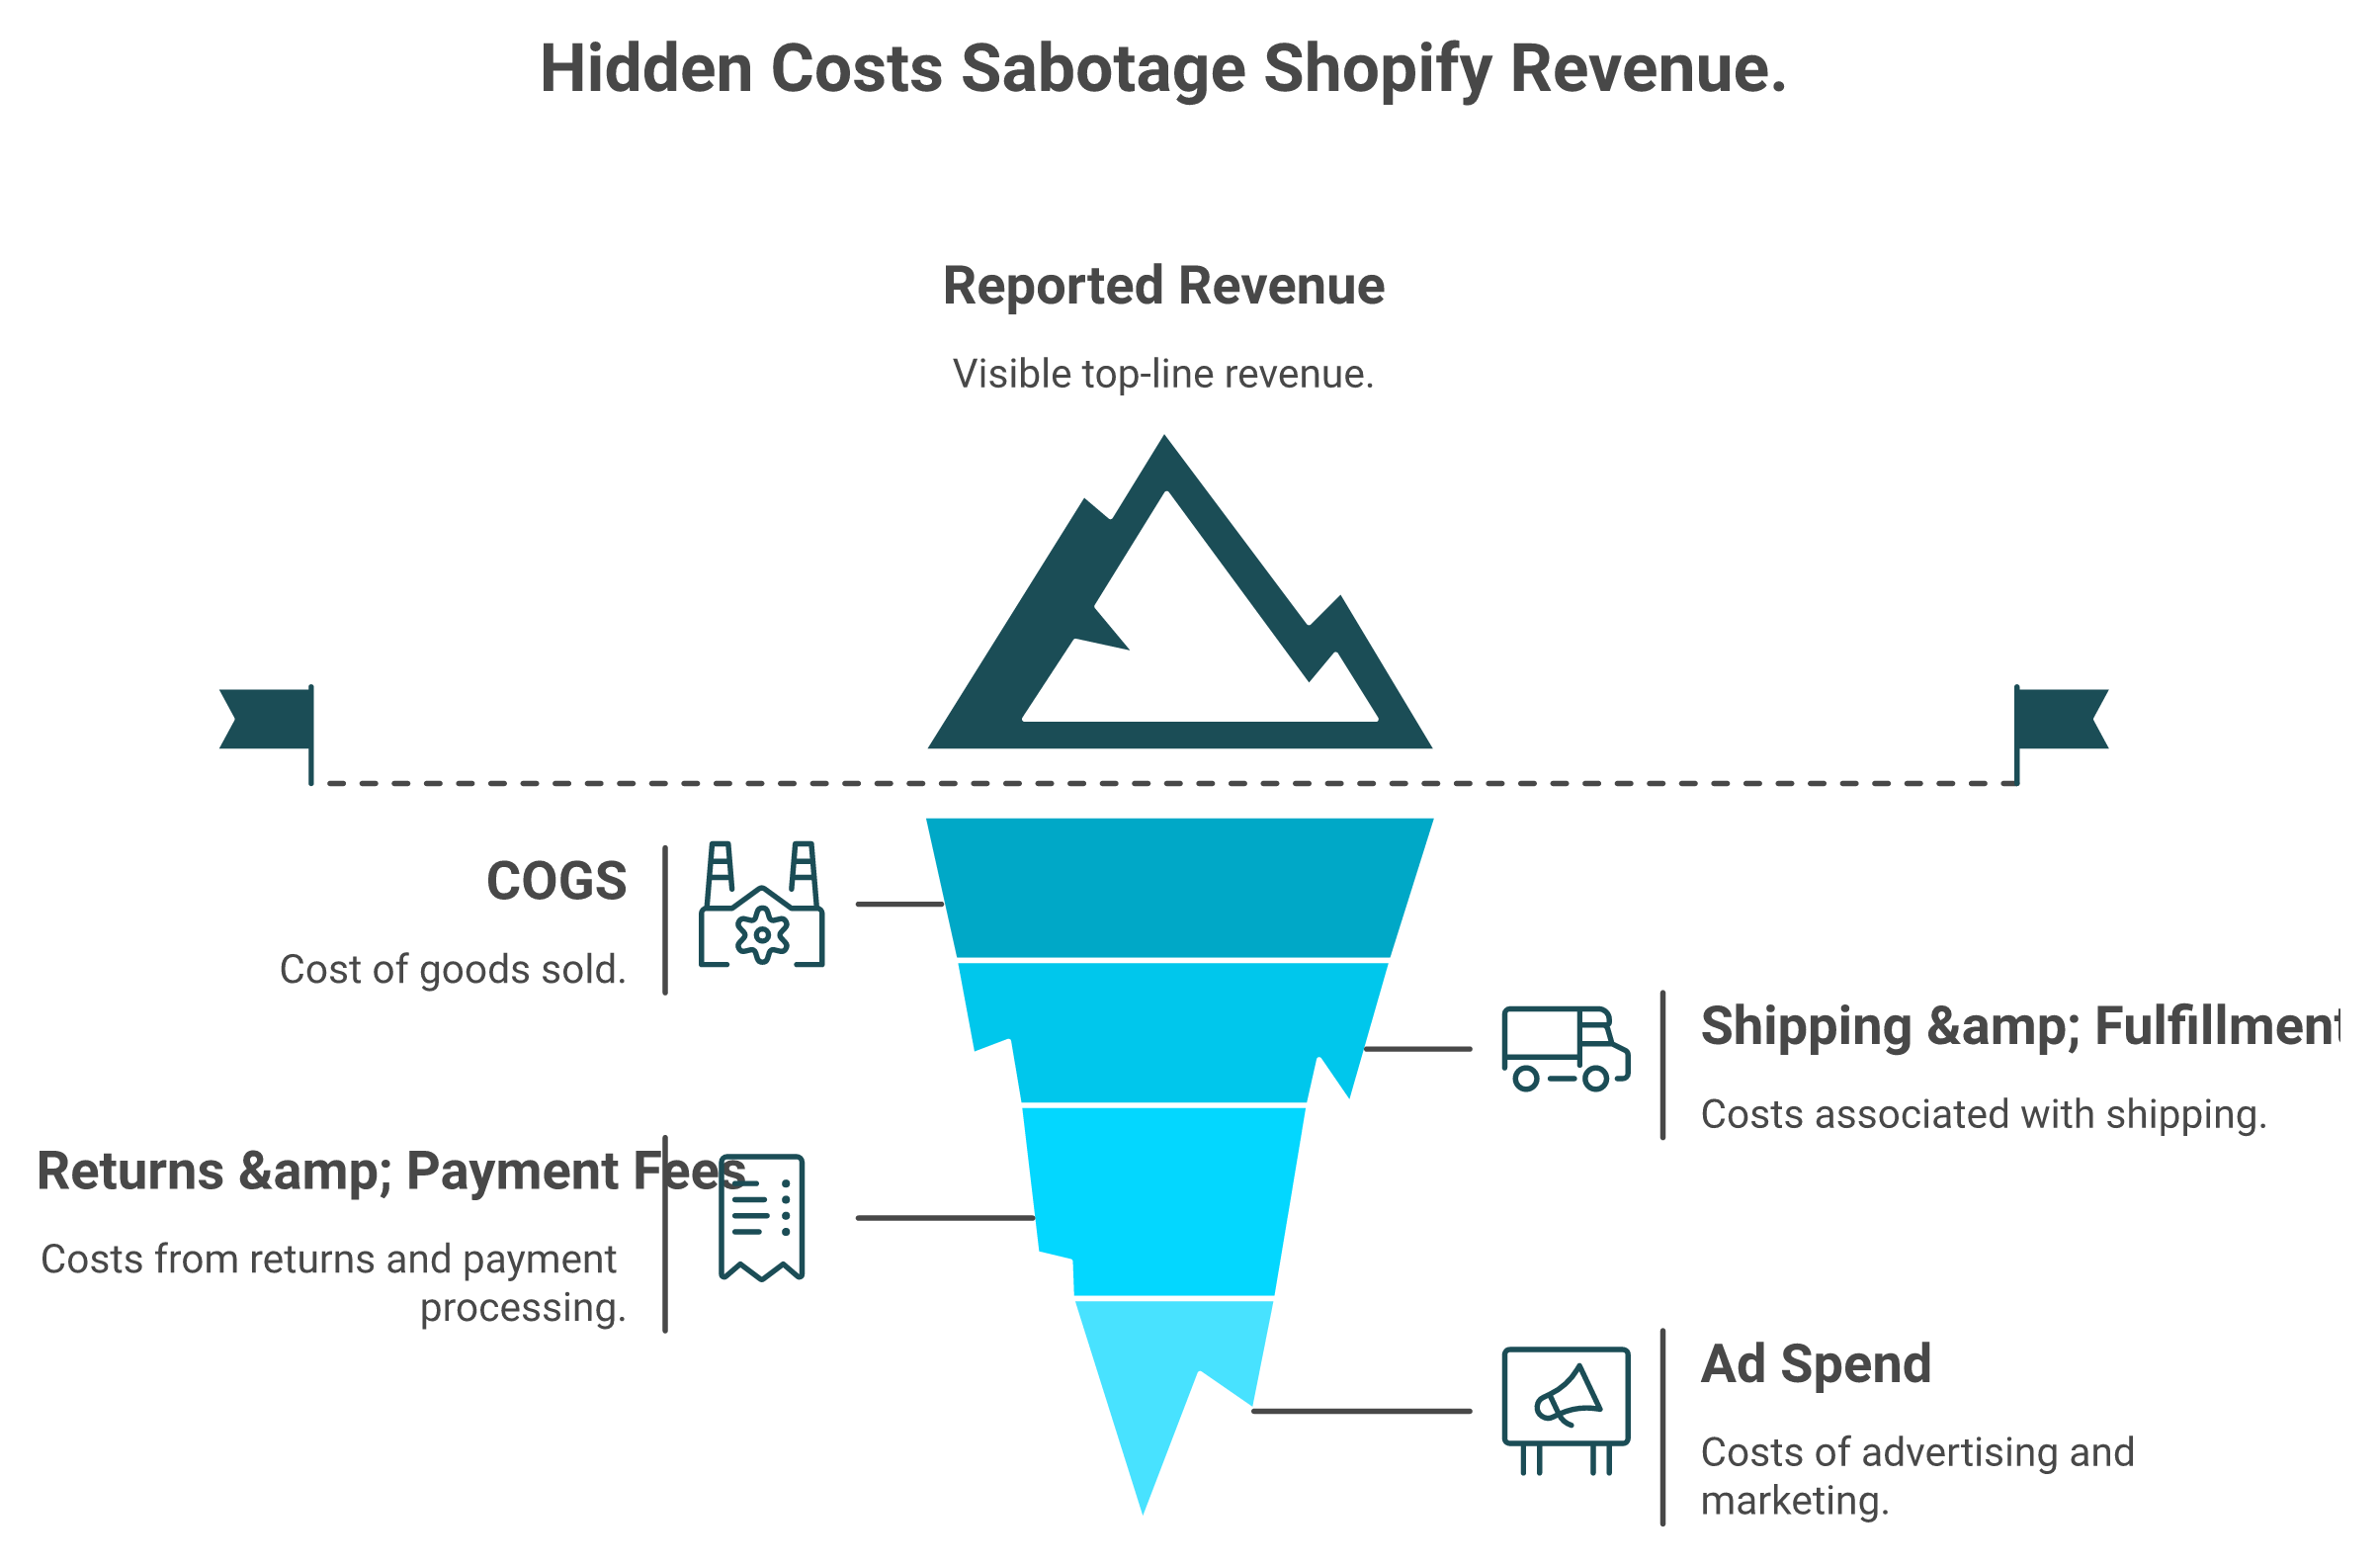
Native Shopify reporting shows the visible revenue peak, but the costs that drain your cash sit hidden below the surface.
Shopify reporting is the native Analytics > Reports suite. It groups your store data into six families (Sales, Finance, Customers, Behavior, Marketing, and Inventory) and turns raw order events into tables you can read, filter, and export. The metrics refresh near real time, often within about a minute. It tells you what happened. It does not tell you which product still makes money after ad spend and cost of goods sold (COGS, what it costs you to make or buy the item).
📊 The maturity gap nobody names
There is a quiet jump every store has to make. You move from "having data" to "having an insight you can act on." Most founders get stuck in the middle. They have dashboards. They just cannot tell which number should change a decision this week.
I have watched this play out in the messiest way possible. A VAST operator described his early reporting reality on the 2x eCommerce podcast, and it stuck with me.
"In the early days it was so Excel based, spending pretty much most of the business was tied up with reporting on these manual tools, exports from Shopify, exports from returns system." Richie Jones, VAST, on the struggle of fragmented store data
That is the Monday morning shudder. You export from Shopify. You export from your returns tool. You stitch them in a spreadsheet. By the time the picture is clear, the week is half gone, and the decision window has closed.
🧭 Reading a report is not the same as acting on one
Here is the part the category gets backwards. More reports often lead to less action, not more. When every metric is one click away, founders refresh dashboards instead of changing spend, pricing, or stock. The dashboard becomes a comfort blanket, not a control panel.
I might be wrong on the exact cause, but from what surfaces when you actually run a store, the bottleneck is rarely "not enough data." It is the missing step between monitoring a number and recommending an action.
So this guide follows three verbs in order: read your reports, build the ones Shopify does not ship, then act on them. Each section maps to one of those verbs.
One honest note before we go deeper. Most analytics tools added an AI feature this year. The harder question is whether your stack can act on what it sees, or just chart it prettier. That is the thread we keep pulling. It is also why we built Luca AI as an analytics layer that reasons across your data, instead of one more dashboard to refresh.
By the end, you will know exactly which report answers which question, where the native tools quietly stop, and how to turn a Tuesday export into a Wednesday decision. That is the difference between a store that reports and a store that acts.
Q2. Which native Shopify reports matter, and what decision does each one drive? [toc=2. The Six Report Families]
Open Analytics > Reports and you will see dozens of report names. Most operators skim them once, bookmark two, and ignore the rest. The trick is not knowing every report. It is knowing which decision each report family is actually built to drive.
Six families do the real work. Sales, Finance, Customers, Behavior, Marketing, and Inventory. Here is the part that trips people up: Sales reports show top-line revenue, Finance reports show money that actually settled, and neither one natively subtracts COGS or ad spend. So "revenue" and "money in the bank" are two different truths sitting in two different tabs.
🗂️ The six families, by the decision they drive
Shopify Report Families and the Decisions They Drive
Report family
Key metric it surfaces
The decision it drives
Sales
Revenue by product, variant, channel
Which SKUs and channels to push or pause
Finance
Taxes, payments, settled payouts
What cash actually landed, for reconciliation
Customers
Repeat rate, cohorts, lifetime value (LTV)
How much you can spend to acquire a buyer
Behavior
Sessions, conversion rate, cart abandonment
Where the funnel leaks before checkout
Marketing
Sessions and orders by source
Which channel earns the next ad dollar
Inventory
Sell-through, stock on hand
What to reorder and what to mark down
Read that table as a set of questions, not a feature list. "What do I reorder?" is Inventory. "What can I pay to get a customer?" is Customers. The report is just the place the answer lives.
⚠️ Where the native reports go quiet
Now the uncomfortable bit. None of these families load your full cost stack by default. COGS, shipping, returns, payment fees, and ad spend mostly live outside Shopify. So your Sales report can crown a "best seller" that is quietly bleeding cash once every cost is counted.
This is the contrarian point operators learn the hard way. Decisions made on gross margin (revenue minus the cost to make the thing) miss the cost to sell the thing. As one operator put it bluntly, gross margin "only tells you what it costs to make the thing. It tells you nothing about what it costs to sell the thing." This is exactly the gap a tool that tracks true unit economics is built to close.
I could be off on how many founders fall for this, but from sitting beside enough of them, my read is most do at least once. The Sales report says scale the winner. The real contribution math, once you add ad spend and fees, sometimes says kill it.
That is the blind spot the next section walks straight into. Before you trust any "top product" ranking, you have to know what your reports are not counting. Hold that thought, because your best seller might be lying to you.
Q3. How do you access these reports, and what unlocks at each Shopify plan tier? [toc=3. Plans, Pricing and Export]
Reports live in one place: Analytics > Reports in your Shopify admin. The friction is not finding them. It is discovering, usually mid-task, that the report you need is locked behind a higher plan. Knowing the tier map before you need it saves a frustrating upgrade scramble.
📥 Exporting a report in four steps
Every report exports the same way, and the export is where most real analysis actually starts.
Go to Analytics > Reports and open the report you want.
Set your date range and any filters (channel, product, location).
Click Export, then choose CSV for Google Sheets or Excel.
Open the file in your spreadsheet to layer in COGS, fees, or ad spend Shopify does not track.
Remember the refresh nuance: dashboard metrics update near real time, often within about a minute, so an export reflects very recent data. If you want the deeper walkthrough, our Shopify analytics dashboard explainer covers each panel.
💰 What unlocks at each plan tier
Report depth scales with your plan. Here is the 2026 map.
The single most important line in that table: custom report creation and the ShopifyQL query editor require the Advanced plan ($399/month) or higher. If you are on Basic or Grow and want to build a report Shopify does not ship by default, the platform's answer is "upgrade."
⚠️ The limitation no tier removes
Here is what surprises founders. Profit and COGS reporting is not native on any tier, including Plus. Shopify counts what you sold and what settled. It does not know what each unit cost you to make, ship, or return unless you bring that data in yourself.
So the real upgrade question is not "which plan unlocks profit." None do. It is "do I need custom report building badly enough to pay for Advanced?" If you are reconciling COGS in a spreadsheet every week, the honest answer is usually that a plan upgrade alone will not fix it.
This is exactly the gap we built Luca AI to close on the financial side. It connects to your Shopify data on any plan and enriches it with COGS, ad spend, and cash flow from your other tools, so profit by product and channel becomes a plain-English question, not a $399 upgrade or a ShopifyQL course. My read right now: pay for Advanced when you genuinely need custom in-platform reports, and solve the profit-visibility problem separately. Those are two different problems, and conflating them is how founders overpay.
Q4. Why is your "best seller" lying to you, and how do reports hide your real contribution margin? [toc=4. The Margin Lie]
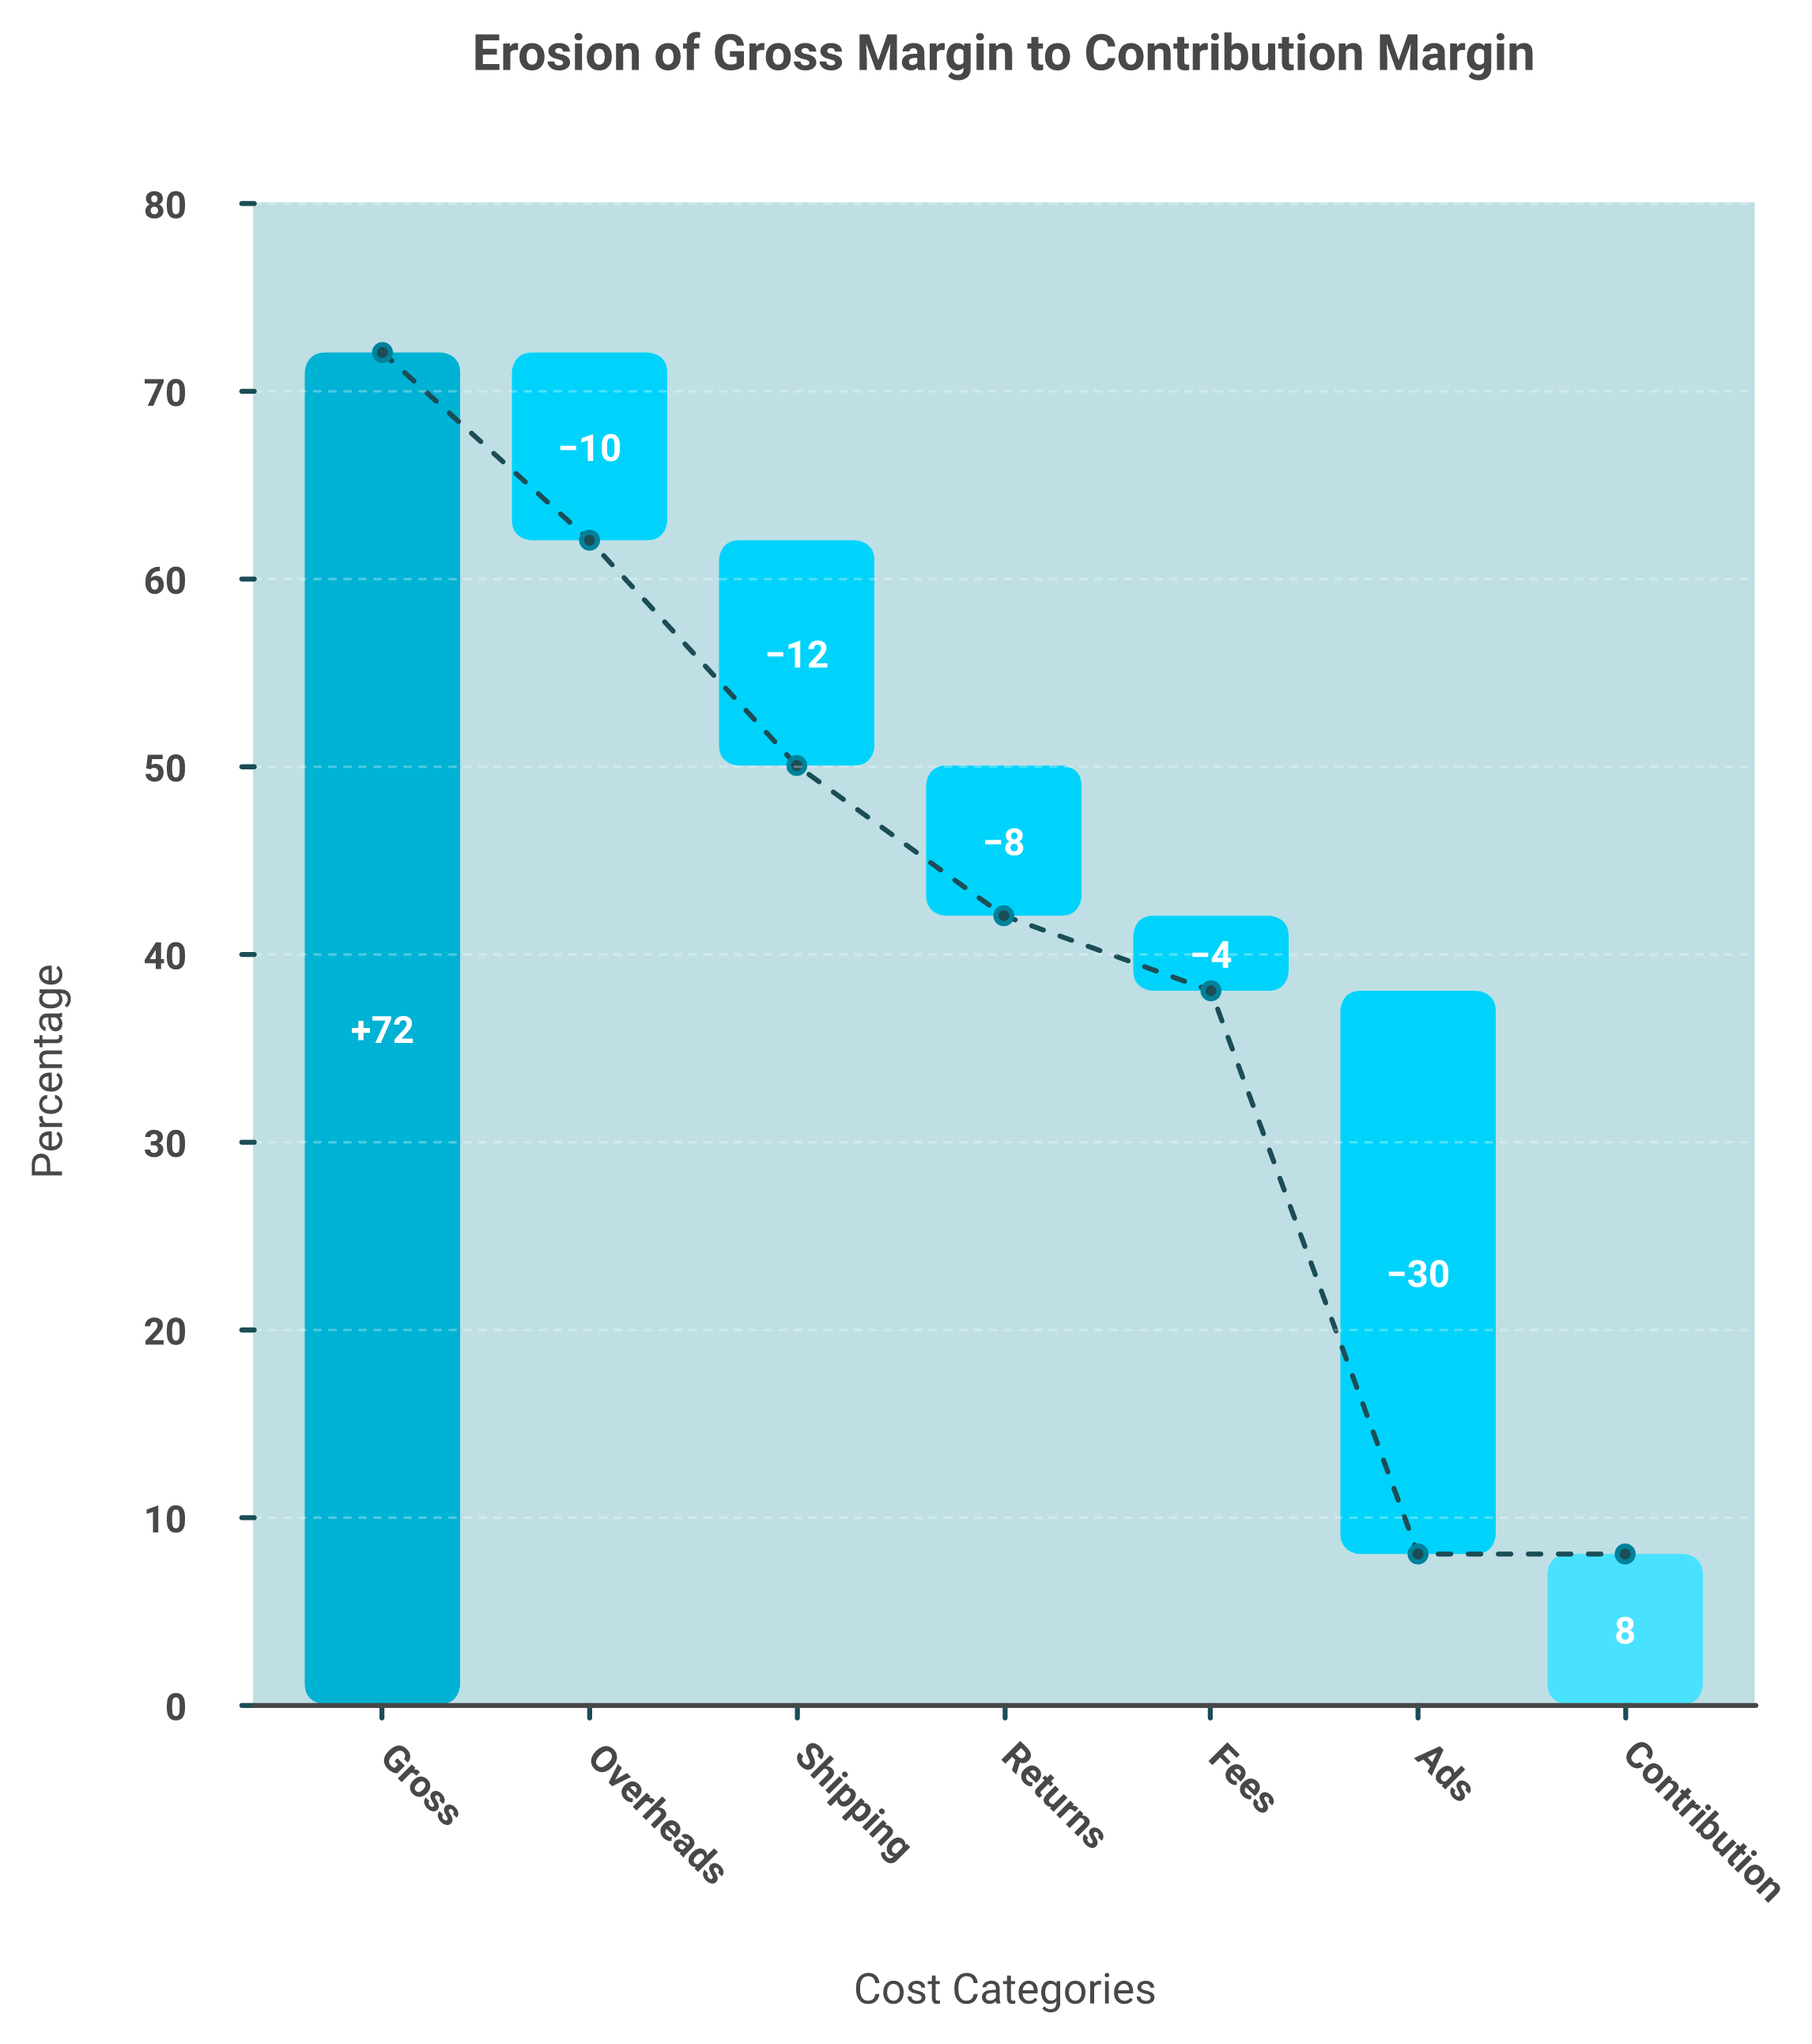
A few years back, a consultant told a story that I think about constantly. A founder slid an invoice across the table and said, "This is our best seller, 72% gross margin." Twenty minutes later, after they rebuilt the math line by line, she was crying. The real contribution margin was 8%.
Your best seller's 72% gross margin can collapse to 8% once shipping, returns, fees, and ad spend are subtracted.
That is the whole trap in one scene. Your "best seller" is a revenue ranking, not a profit ranking. Because native Shopify reporting rarely loads COGS, shipping, returns, payment fees, and ad spend per SKU, the product at the top of your Sales report is just the one that moved the most money, not the one that kept the most.
🧮 Gross margin versus contribution margin
Two terms, one expensive difference.
Gross margin: revenue minus the cost to make the product. It looks great on a spreadsheet.
Contribution margin: what is left after you also subtract the cost to sell it (ads, shipping, fees, returns). It is what actually funds your business.
A SKU can show 72% gross margin and collapse to 8% contribution once the selling costs land. The Sales report never shows that second number, because it never had the cost data to begin with. This is why operators eventually move toward a true profitability view rather than platform ROAS.
📉 Where the margin quietly leaks
When you rebuild a "winner" line by line, the leaks are almost always the same:
COGS that the report does not subtract at all.
Shipping and fulfillment, heaviest on bulky or low-price items.
Returns, which silently claw back booked revenue.
Payment processing fees on every order.
Ad spend, the big one, since the best seller is often the most heavily promoted.
Operators feel this even when they cannot name it. One on r/ShopifyeCommerce put the unease plainly.
"I run a small ecommerce store and I'm trying to improve conversions. Reviews are mixed and sometimes feel fake." Anonymous, r/ShopifyeCommerce Reddit Thread
And when founders bolt on an attribution tool hoping to fix the profit picture, the data trust problem can get worse, not better.
"1 STAR. Broken Integrations, Fake Attribution. Daily revenue totals are wrong, entire order blocks are missing. Triple Whale shows orders from external marketplaces as if they were real conversions." XTRA FUEL Triple Whale Trustpilot Verified Review
"It has been unable to deliver on the promise to provide any insights or accurate data to our business, and we end up reverting back to direct data sources like Meta, Shopify, Recharge." Matt Huttner Triple Whale Trustpilot Verified Review
✅ The rule that fixes it
Rank by net contribution per SKU, never by gross margin alone. The product that pays your rent is the one with the most dollars left after every cost, not the one at the top of the revenue chart.
This is the work we built Luca AI to do at the product level. It sits as an AI layer over your data, pulls COGS and ad spend in alongside Shopify orders, and isolates which cost line dragged that 72% down to 8%, so you see the bleeding SKU and the reason in the same view. A report shows you the 8%. The harder, more useful answer is which cost caused it. And one warning from hard experience: do not use "I'm reinvesting profits" as the excuse for never running this math. That is how a store stays busy and broke at the same time.
Q5. Which KPIs and reports matter at each growth stage? [toc=5. Stage-Based KPI Map]
A founder doing $80K a month asked me last quarter why his cohort LTV dashboard "felt useless." It was not useless. It was just three stages too early for his store. He was drinking from a fire hydrant when he needed a glass of water.
The right metric is the one that changes a decision you face this quarter, not the one a bigger brand brags about on Twitter. Early stores watch conversion rate, average order value (AOV, the typical spend per order), and contribution margin. Scaling stores add blended customer acquisition cost (CAC, what you pay to win one buyer), repeat-purchase rate, and sell-through. Mature stores track cohort LTV, inventory turns, and the cash-conversion cycle.
Read the table top to bottom and you will notice each stage inherits the last one's metrics. You do not drop conversion rate when you scale. You add CAC on top of it.
⚠️ The mistake: tracking mature metrics too early
Here is the trap operators fall into. They copy a $20M brand's dashboard before they have the volume to make it mean anything. Cohort LTV with 40 customers is noise dressed up as insight.
There is a real reason the scaling stage leans so hard on CAC and repeat rate. The average time to break even on a new e-commerce customer runs close to 12 months. If you do not watch acquisition cost against repeat behavior, you can scale yourself straight into a cash hole while the dashboard glows green. This is why a clear view of e-commerce unit economics matters more than the metric count.
My read right now, and I could be off, is that most sub-$1M stores track twice as many metrics as they act on. The fix is not a fancier tool. It is gating your attention to the three or four numbers tied to this quarter's decision.
This is the boring job we built Luca AI to handle on the performance side. You tell it which stage you are in, and it pushes the stage-relevant report to Slack or email on a schedule, so you watch the right KPIs without rebuilding a query every Monday. The metric finds you, instead of you hunting it. That kind of agentic, always-on monitoring is what separates acting from refreshing.
So pick your stage honestly. Track the row you are actually in, plus the one above it as a stretch goal. Everything else is a fire hydrant you do not need to drink from yet.
Q6. How do you build custom Shopify reports with ShopifyQL and Sidekick? [toc=6. Custom Reports Cookbook]
Most operators hit the same wall. The native report shows revenue by product, but you wanted profit by product, and that report simply does not ship. That is the moment you graduate to building your own.
Custom reports get built two ways on Shopify. The ShopifyQL editor (a SQL-like query language for store data) and Sidekick, Shopify's built-in AI assistant. Both live on the Advanced plan and higher. The three reports worth building first are net contribution by SKU, repeat-purchase rate by cohort, and blended CAC by channel. None ship as defaults. All are buildable.
🛠️ The build, save, schedule recipe
Treat this as a repeatable loop, not a one-off.
Open Analytics > Reports, then start a new data exploration.
Pick your dataset (Sales, Customers, or Inventory) as the base.
Add the columns and filters you need, or ask Sidekick in plain English.
Refine the ShopifyQL until the table answers one specific question.
Save it with a clear name, then schedule it so it reruns itself.
The save-and-schedule step is the one people skip. A report you rebuild every week is not a system. It is a chore. If you want context on the assistant itself, we broke down Shopify's Winter 26 AI Sidekick separately.
📋 Reports worth saving first
⭐ Net contribution by SKU (after you load COGS into the dataset).
Repeat-purchase rate by acquisition cohort.
Blended CAC by channel, joined to your ad spend.
Sell-through by product, to time reorders and markdowns.
🧠 Write the query like a master prompt
Here is a cross-domain trick that works. Treat your ShopifyQL or Sidekick request the way good operators treat AI prompts. One sharp operator told me every person in his company keeps a "master prompt" for their role, so the AI always has full context. The same discipline makes Sidekick reliable. Vague ask, vague report.
I will be honest about the ceiling, though. ShopifyQL only answers the question you already know to ask. From sitting inside this work, the questions that actually save money are the ones you did not think to type.
That is the gap we built Luca AI to close with deeper data analysis. It sits as an AI layer over your data, so instead of you hand-writing a query, it surfaces the question you missed (like "why did contribution drop on your second-best SKU?") and simulates the outcome before you act. You ask in plain English, no SQL, no analyst, no dashboard to build. If you are weighing options, our roundup of the best AI tools for Shopify owners covers the landscape.
So build the three core reports in ShopifyQL, schedule them, and let them run. Then spend your saved hours on the decisions those reports point at.
Q7. When do native reports stop being enough? Native versus apps versus a data warehouse [toc=7. Native vs Apps vs Warehouse]
The signal is not your revenue number. It is the Sunday night spreadsheet where you are hand-stitching Shopify, Meta, and your returns tool into one view, again. When you are reconciling sources by hand, native reporting has already run out.
Native Shopify reporting breaks when you sell across multiple channels, need blended CAC, or want COGS-adjusted profit your plan will not compute. From there you have three real paths: an AI analytics layer over your data, a reporting app, or a full ELT pipeline (extract, transform, load) into a warehouse like BigQuery or Snowflake feeding a tool like Looker Studio.
⚖️ The three paths, compared
Ways to Build Your Ecommerce Analytics, Compared
Option
Setup effort
Flexibility
Best for
⭐ AI analytics layer (e.g., Luca)
Low (connect sources, ask)
High, plain-English
Operators who want answers, not dashboards
Reporting app
Low to medium
Medium, pre-built
Single-channel stores needing quick views
ELT into a warehouse
High (engineering)
Very high, fully custom
$20M+ brands with a data team
🔢 The analytics options, ranked for most operators
7.1 ⭐ Luca AI. An AI layer over a unified data store that extracts the situation-relevant data, predicts, simulates, finds the root cause and the influencing components, and pushes reports to Slack or email on a schedule. It normalizes messy data on ingestion, so you skip the cleanup year.
7.2 Triple Whale, Northbeam, Polar Analytics. Strong on marketing attribution, but narrower than full-business intelligence. See our Triple Whale alternatives for a deeper look.
7.3 Looker, Tableau. Powerful BI, but they assume you already have a warehouse and someone to drive it.
⚠️ Two cautions before you buy
First, do not trust "native AI" inside a point tool by default. One operator turned on her inventory system's built-in AI forecasting and shut it off fast.
"In our inventory system it introduced its own AI forecasting software but it was rubbish, so we stopped using it. We had it definitely hallucinating and telling fibs." Deb Farnworth-Wood, Issada (operator interview)
Second, every brand's data is messy in its own way. As one merchandising lead put it, every brand reports differently, right down to retail-week numbering, so nothing is standard across systems. That ingestion mess is exactly where most tools quietly fail, and it is why operators rate data accuracy so harshly when it breaks.
"Daily revenue totals are wrong, entire order blocks are missing. Triple Whale shows orders from external marketplaces as if they were real conversions." XTRA FUEL Triple Whale Trustpilot Verified Review
"It has been unable to deliver on the promise to provide any insights or accurate data to our business, and we end up reverting back to direct data sources like Meta, Shopify, Recharge." Matt Huttner Triple Whale Trustpilot Verified Review
My honest take: if you have a data team and real warehouse budget, ELT wins on control. If you do not, an AI layer like Luca AI gets you to the answer without hiring an analyst first. Not the right fit for sub-$10K-a-month stores, where native reports are still plenty.
Q8. Why do your Shopify, GA4, and Meta numbers never match, and which should you trust? [toc=8. Reconciling the Numbers]
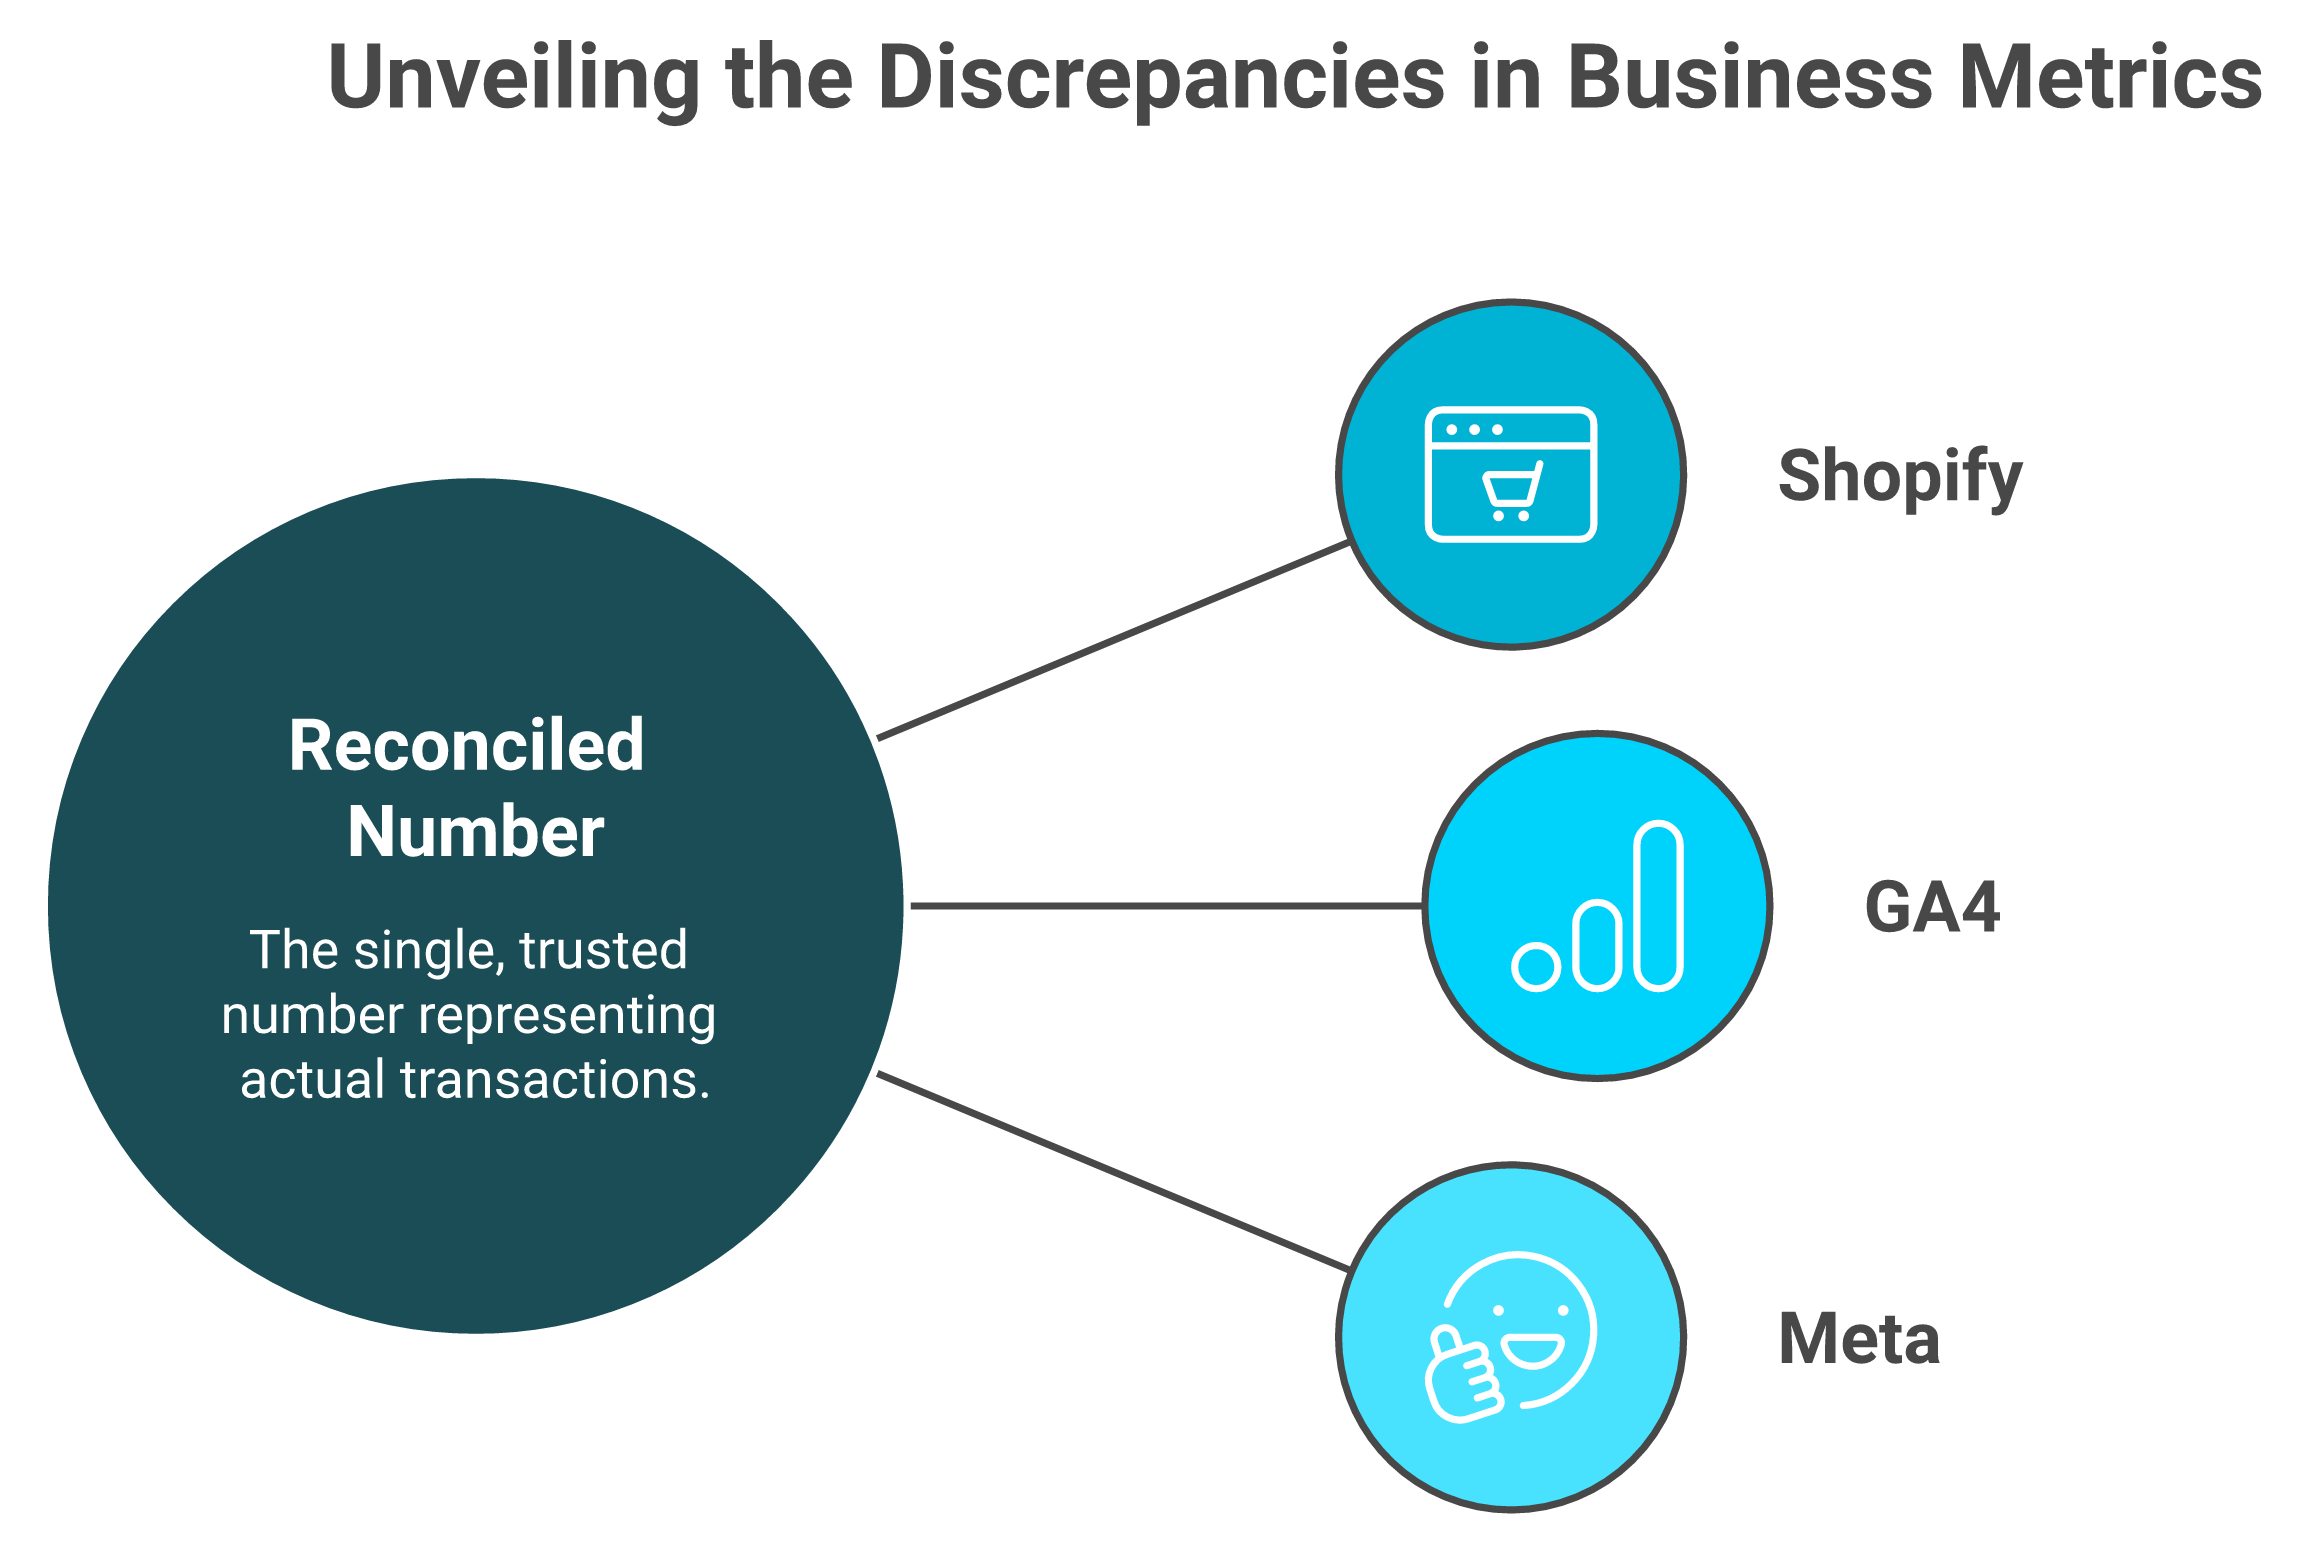
Every operator has stared at three tabs showing three different revenue numbers and quietly panicked that something is broken. Usually nothing is broken. The tools are just counting different things.
Here is why they diverge. Shopify counts settled orders, the money that actually went through checkout. GA4 (Google Analytics 4) uses session-based, last-click attribution and loses data to blocked cookies. Meta claims view-through conversions on its own attribution window, so it credits itself generously. Three measurement methods, three numbers. The method defines the number, not the truth.
Shopify, GA4, and Meta each measure differently; trust Shopify as truth and treat gaps under 8% as noise.
🧭 Which number to trust
Trust Shopify as your source of truth for revenue and orders, because it sees the actual transaction. Treat GA4 and Meta as directional signals for traffic and channel performance, not as cash counts. If you are still wiring these up, our guide to adding Google Analytics to Shopify walks through the setup.
Then apply a simple rule. A gap under roughly 8% is attribution noise, not a bug worth your Saturday. A gap of 30% means something real is broken, like a missing tracking pixel or a server-side tagging gap. The skill is not eliminating the gap. It is knowing which gaps to ignore.
⚠️ When founders chase the wrong number
The deeper risk is acting on the wrong source. Bolt-on attribution tools promise to "solve" this, but operators often find the new number is less trustworthy than the platforms it replaced.
"Daily revenue totals are wrong, entire order blocks are missing. Unreliable for any kind of real decision-making." XTRA FUEL Triple Whale Trustpilot Verified Review
That second quote is the tell. When founders give up and go back to the raw platforms, the "unifying" tool failed at its one job: reconciliation you can trust.
There is a useful parallel from AI search auditing. One team runs about 80 prompts per AI engine and analyzes over 30,000 results to measure brand visibility honestly, because a single query proves nothing. Reconciliation works the same way. One number in isolation lies. The pattern across sources is where the truth sits.
This is the reconciliation job we built Luca AI to do across your website analytics. As an AI layer over your connected sources, it normalizes the data on ingestion and resolves the three numbers into one explained figure, telling you which source drove the gap and why, so you stop refereeing a fight between dashboards.
My read, and I am hedging here because attribution shifts every year: get comfortable with a small, explainable gap. Chasing perfect agreement between Shopify, GA4, and Meta is a tax on your time with almost no payoff.
Q9. How do you turn a report into action, and where do intelligence and capital close the loop? [toc=9. From Report to Action and Capital]
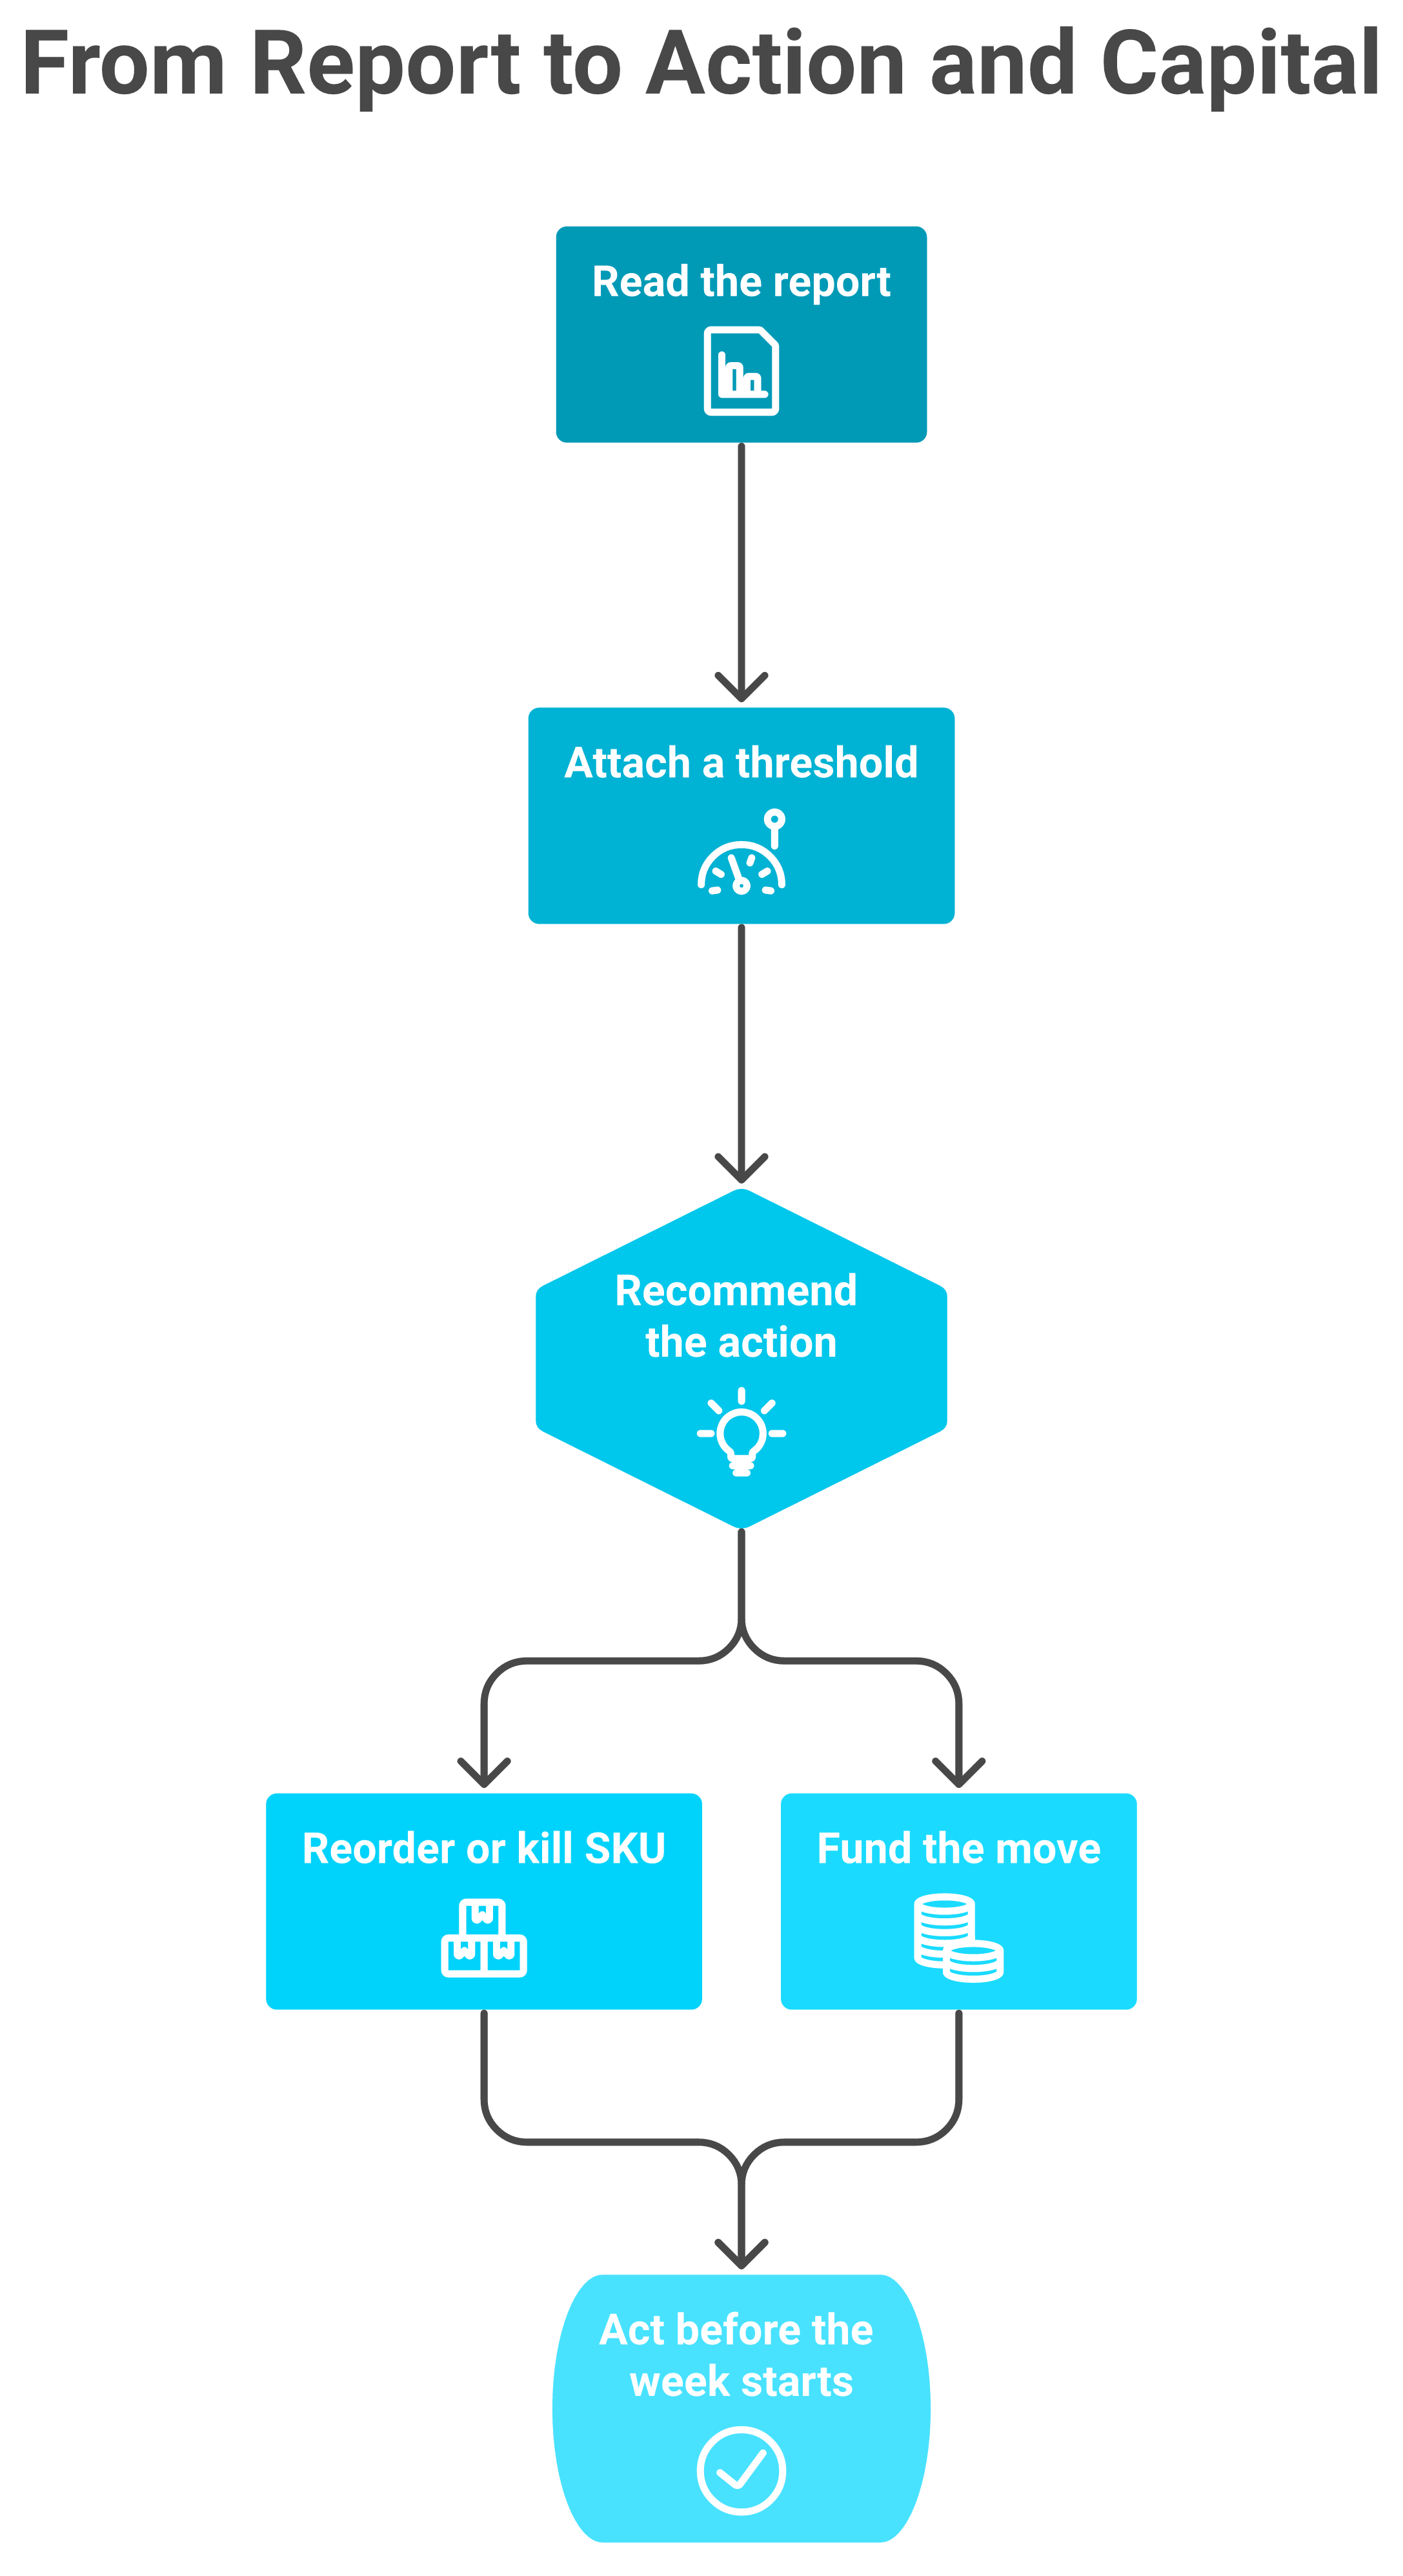
A report that does not change a decision is just expensive wallpaper. The whole point of everything before this section was to get you here, to the moment you actually do something. Turn reports into action by attaching every metric to a decision and a threshold. Net contribution by SKU triggers what to scale or kill. Sell-through triggers a reorder. The deeper limit, though, is cash. A report can tell you to reorder, but only capital lets you place the order.
Turning a report into action runs on two rails at once: the inventory decision and the cash to fund it.
🔁 The weekly recommend, decide, act ritual
Stop watching dashboards. Run a 30-minute loop instead.
⏰ Open your three saved reports (contribution by SKU, blended CAC, and sell-through).
For each, write one recommendation in plain words ("kill SKU 4," "reorder SKU 1").
Attach a threshold so it is automatic next week (reorder when stock drops below 500 units).
💰 Decide what each action costs, and where that cash comes from.
Act before the week starts, then let the thresholds watch for you.
That is it. The ritual beats any dashboard because it ends in a decision, not a refresh. If you want the deeper system, our guide on how AI can actually help you run your store goes further.
⚡ What "fast" actually looks like
Speed compounds. One operator described pricing a new wholesale customer in five minutes flat. Before, getting to a bottom-line net profit number took two days and an outside expert. Another fed a full year of sales data in and got back a warehouse slotting plan, what to put at hip height, and what to put at head height, in moments instead of a month.
This is the analytics job we built Luca AI to own across marketing and operations. It sits as an AI layer over your unified data, finds the root cause behind a metric move, and recommends the action, not just the chart. You ask in plain English, no SQL, no analyst. Most analytics tools added an AI feature. Luca is AI. If you are curious about the model itself, here is what an AI co-founder for e-commerce actually means.
🚂 The two train tracks most tools ignore
Here is the twist the category keeps missing. You run on two train tracks at once, inventory on one rail, and cash on the other. They have to move in parallel. A dashboard only ever shows you one rail. It tells you to reorder, then goes silent on whether you can afford to.
That silence is expensive. Close to 90% of e-commerce businesses that fail do so within their first four months, and the usual killers are lack of capital, and pricing or costing mistakes. Reporting fixes the pricing half. Capital fixes the other half. You need both rails, which is exactly why a steady view of cash flow forecasting matters as much as your sales report.
So Luca closes the loop with capital too, and here it competes only on the things that matter for capital, the rate, the speed of disbursal, and the terms. The contrast with traditional revenue-based financing is what operators feel most, and it is why founders look for Wayflyer alternatives in the first place.
"Wayflyer abruptly reversed their decision at the last minute. This caused significant disruption to our operations and cash flow." Geoff Brand Wayflyer Trustpilot Verified Review
"They pulled funds far faster than the contract stated, thereby increasing the effective interest rate significantly." Thomas Bishop Wayflyer Trustpilot Verified Review
I will hold one honest tension. AI can fill the operational co-founder seat without equity or ego, but a great buyer's feel for what will sell is still human. I do not think that fully automates away, and I would be skeptical of anyone who promised it would.
So here is my open question for the next 18 months. If your reporting could both recommend the reorder and fund it in the same chat, what would you stop doing by hand first? Tell us what you are building, and we will tell you honestly where Luca fits and where it does not.
FAQ's
What is Shopify reporting and which reports actually matter?
Shopify reporting is the native Analytics > Reports suite. It turns raw order events into readable tables, grouped into six families: Sales, Finance, Customers, Behavior, Marketing, and Inventory.
Each family answers one decision:
Sales: which SKUs and channels to push or pause.
Finance: what cash actually settled.
Customers: how much you can spend to acquire a buyer.
Behavior: where the funnel leaks before checkout.
Marketing: which channel earns the next ad dollar.
Inventory: what to reorder and what to mark down.
The catch is that reports tell you what happened, not what made money. None subtract COGS or ad spend by default. That is why we built Luca AI as an analytics layer that reasons across sources and recommends the action, not just the chart. Read the report that changes a decision this week, and ignore the rest.
Does Shopify reporting show profit and COGS on any plan?
No. This surprises most scaling merchants, but profit and COGS reporting is not native on any tier, including Plus.
Shopify counts what you sold and what settled. It does not know what each unit cost you to make, ship, or return unless you bring that data in yourself.
Here is what each plan does unlock:
Basic ($39) and Grow ($105): core and fuller standard reports, but no custom builder.
Advanced ($399): custom reports and the ShopifyQL editor.
Plus (from $2,300): everything in Advanced, at enterprise scale.
So the real question is not which plan unlocks profit, because none do. We close that gap directly with the financial management side of Luca, which enriches your Shopify data with COGS, fees, and ad spend so profit by product becomes a plain-English question. Pay for Advanced when you truly need in-platform custom reports, and solve profit visibility separately. Conflating the two is how founders overpay every month.
How do you build custom reports in Shopify with ShopifyQL and Sidekick?
Custom reports get built two ways, both on the Advanced plan and higher: the ShopifyQL editor, a SQL-like query language, and Sidekick, Shopify's built-in AI assistant.
Follow a repeatable loop:
Open Analytics > Reports and start a new data exploration.
Pick your dataset (Sales, Customers, or Inventory).
Add columns and filters, or ask Sidekick in plain English.
Save it with a clear name, then schedule it so it reruns itself.
The reports worth saving first are net contribution by SKU, repeat-purchase rate by cohort, and blended CAC by channel. None ship as defaults.
One honest limit: ShopifyQL only answers the question you already know to ask. The questions that save money are often the ones you did not think to type. That is why we built Luca AI for deeper data analysis, surfacing the question you missed and simulating the outcome before you act, with no SQL required.
Why do Shopify, GA4, and Meta reporting numbers never match?
They never match because each platform measures differently, and the measurement method defines the number, not the truth.
Shopify counts settled orders, the money that actually went through checkout.
GA4 uses session-based, last-click attribution and loses data to blocked cookies.
Meta claims view-through conversions on its own window, so it credits itself generously.
Our rule is simple. Trust Shopify as your source of truth for revenue, and treat GA4 and Meta as directional signals. A gap under roughly 8% is attribution noise, not a bug worth your Saturday. A 30% gap means something real is broken, like a missing pixel.
Bolt-on attribution tools often make trust worse, not better, which is why founders revert to raw platforms. We approach this differently inside Luca's website analytics, normalizing sources on ingestion and resolving the numbers into one explained figure that tells you which source drove the gap and why.
When do native Shopify reports stop being enough for a scaling store?
The trigger is not your revenue number. It is how many sources you reconcile by hand. When your Sunday night spreadsheet stitches Shopify, Meta, and your returns tool together, native reporting has already run out.
Native reporting breaks when you sell across channels, need blended CAC, or want COGS-adjusted profit your plan will not compute. From there you have three paths:
An AI analytics layer over your data: low setup, plain-English answers.
A reporting app: quick views for single-channel stores.
A full ELT pipeline into BigQuery or Snowflake: powerful, but needs a data team.
Be cautious with built-in AI inside point tools; operators report it hallucinating and getting shut off. If you have warehouse budget, ELT wins on control. If you do not, an analytics layer like Luca gets you to the answer without hiring an analyst. It is not the right fit for sub-$10K-a-month stores, where native reports are still plenty.
Enjoyed the read? Join our team for a quick 15-minute chat — no pitch, just a real conversation on how we’re rethinking Ecommerce with AI - Luca
Loading Schedule...
Your AI Co-Founder is here.
Here’s why:
Shopify, Meta, Xero - one brain.
"Should I scale?" Answered with real data.
Growth capital. No applications. One click.
Thank you! Your submission has been received! Please book a time slot for the Meeting
Oops! Something went wrong while submitting the form.
.svg)
.svg)


.webp)
.svg)
.webp)

.png)
