Shopify Analytics Dashboard: Every Metric, Report & Insight Explained for Founders
12
mins read
TL;DR
Shopify Analytics provides 60+ reports across 8 categories but shows commerce-layer data only - missing marketing spend, cash flow, and COGS integration.
Data discrepancies (10-20%) between Shopify and ad platforms stem from attribution methodology differences - use Shopify as financial source of truth.
Critical blind spots include multi-touch attribution, contribution margin visibility, predictive intelligence, scenario modeling, and cross-platform synthesis.
Founders managing €1M+ revenue across 5+ channels hit "fragmentation wall" - spending 10-15 hours weekly manually reconciling disconnected dashboards.
Unified AI intelligence collapses multi-report workflows into conversational queries with embedded capital access for identified growth opportunities.
Stage-based priorities shift from validation metrics (launch) to efficiency ratios (growth) to predictive modeling (scale) requiring architectural upgrade.
Q1. What Is the Shopify Analytics Dashboard and How Do You Navigate It? [toc=Dashboard Navigation Guide]
The Shopify analytics dashboard is the built-in reporting interface inside every Shopify Admin panel. It aggregates store performance data across sales, customers, marketing, behavior, and finance into a single overview screen designed to give merchants a quick pulse on store health without leaving their admin.
Every Shopify plan, from Basic ($39/month) through Plus ($2,300+/month), includes access to the analytics dashboard, though the depth of available reports and customization options varies significantly by tier. For solo founders and early-stage operators running a single storefront, the native dashboard provides a workable starting point for tracking daily performance.
✅ How to Access the Dashboard
Navigating to your analytics takes three steps:
Log into your Shopify Admin panel at admin.shopify.com
Click "Analytics" in the left-hand sidebar menu
Land on the Overview Dashboard the default home screen for all store data
The Overview Dashboard displays KPI summary cards at the top of the screen, including:
Total sales revenue for the selected period
Online store sessions total visitor traffic
Online store conversion rate percentage of sessions that resulted in a purchase
Average order value (AOV) average revenue per transaction
Top products and traffic sources highest-performing items and referral channels
⏰ Date Ranges, Comparisons, and Key Sections
The date range selector defaults to a 30-day view but allows comparison toggles against the previous period or the same period last year, useful for identifying seasonal shifts and week-over-week trends.
Beyond the Overview, three additional sections live under the Analytics tab:
Reports (Analytics → Reports): Pre-built and, on higher plans, custom reports across sales, customers, marketing, behavior, finance, and inventory
Live View: A real-time map showing active visitors, current sessions, and recent orders as they happen
Dashboard Customization: On Shopify and Advanced plans, you can pin, reorder, and customize which KPI cards appear on your overview screen. Basic plan users see a fixed, simplified layout
⚠️ Common Navigation Frustrations
While access is straightforward, the day-to-day experience frustrates many founders. A Shopify Community thread captured this sentiment directly:
"I'm finding Shopify's analytics dashboard a bit overwhelming, especially when I just want the 'important stuff' instead of digging through different sections every week." — Shopify Community Member, Shopify Community Thread
Merchants consistently report three pain points: the dashboard is "click-heavy" when you simply want 3 to 4 key numbers each morning, custom report building requires upgrading beyond Basic, and there is no native scheduled report delivery, meaning manual CSV exports are the only option for sharing data with your team.
How Luca AI Simplifies This
Luca AI replaces dashboard navigation entirely with a conversational interface. Instead of clicking through multiple screens, ask a question in plain English, "What's my conversion rate this week vs. last?", and receive an instant, cross-functional answer that pulls from Shopify, ad platforms, and financial tools simultaneously, without logging into a single admin panel.
Q2. What Reports Are Available Inside Shopify Analytics? [toc=Available Shopify Reports]
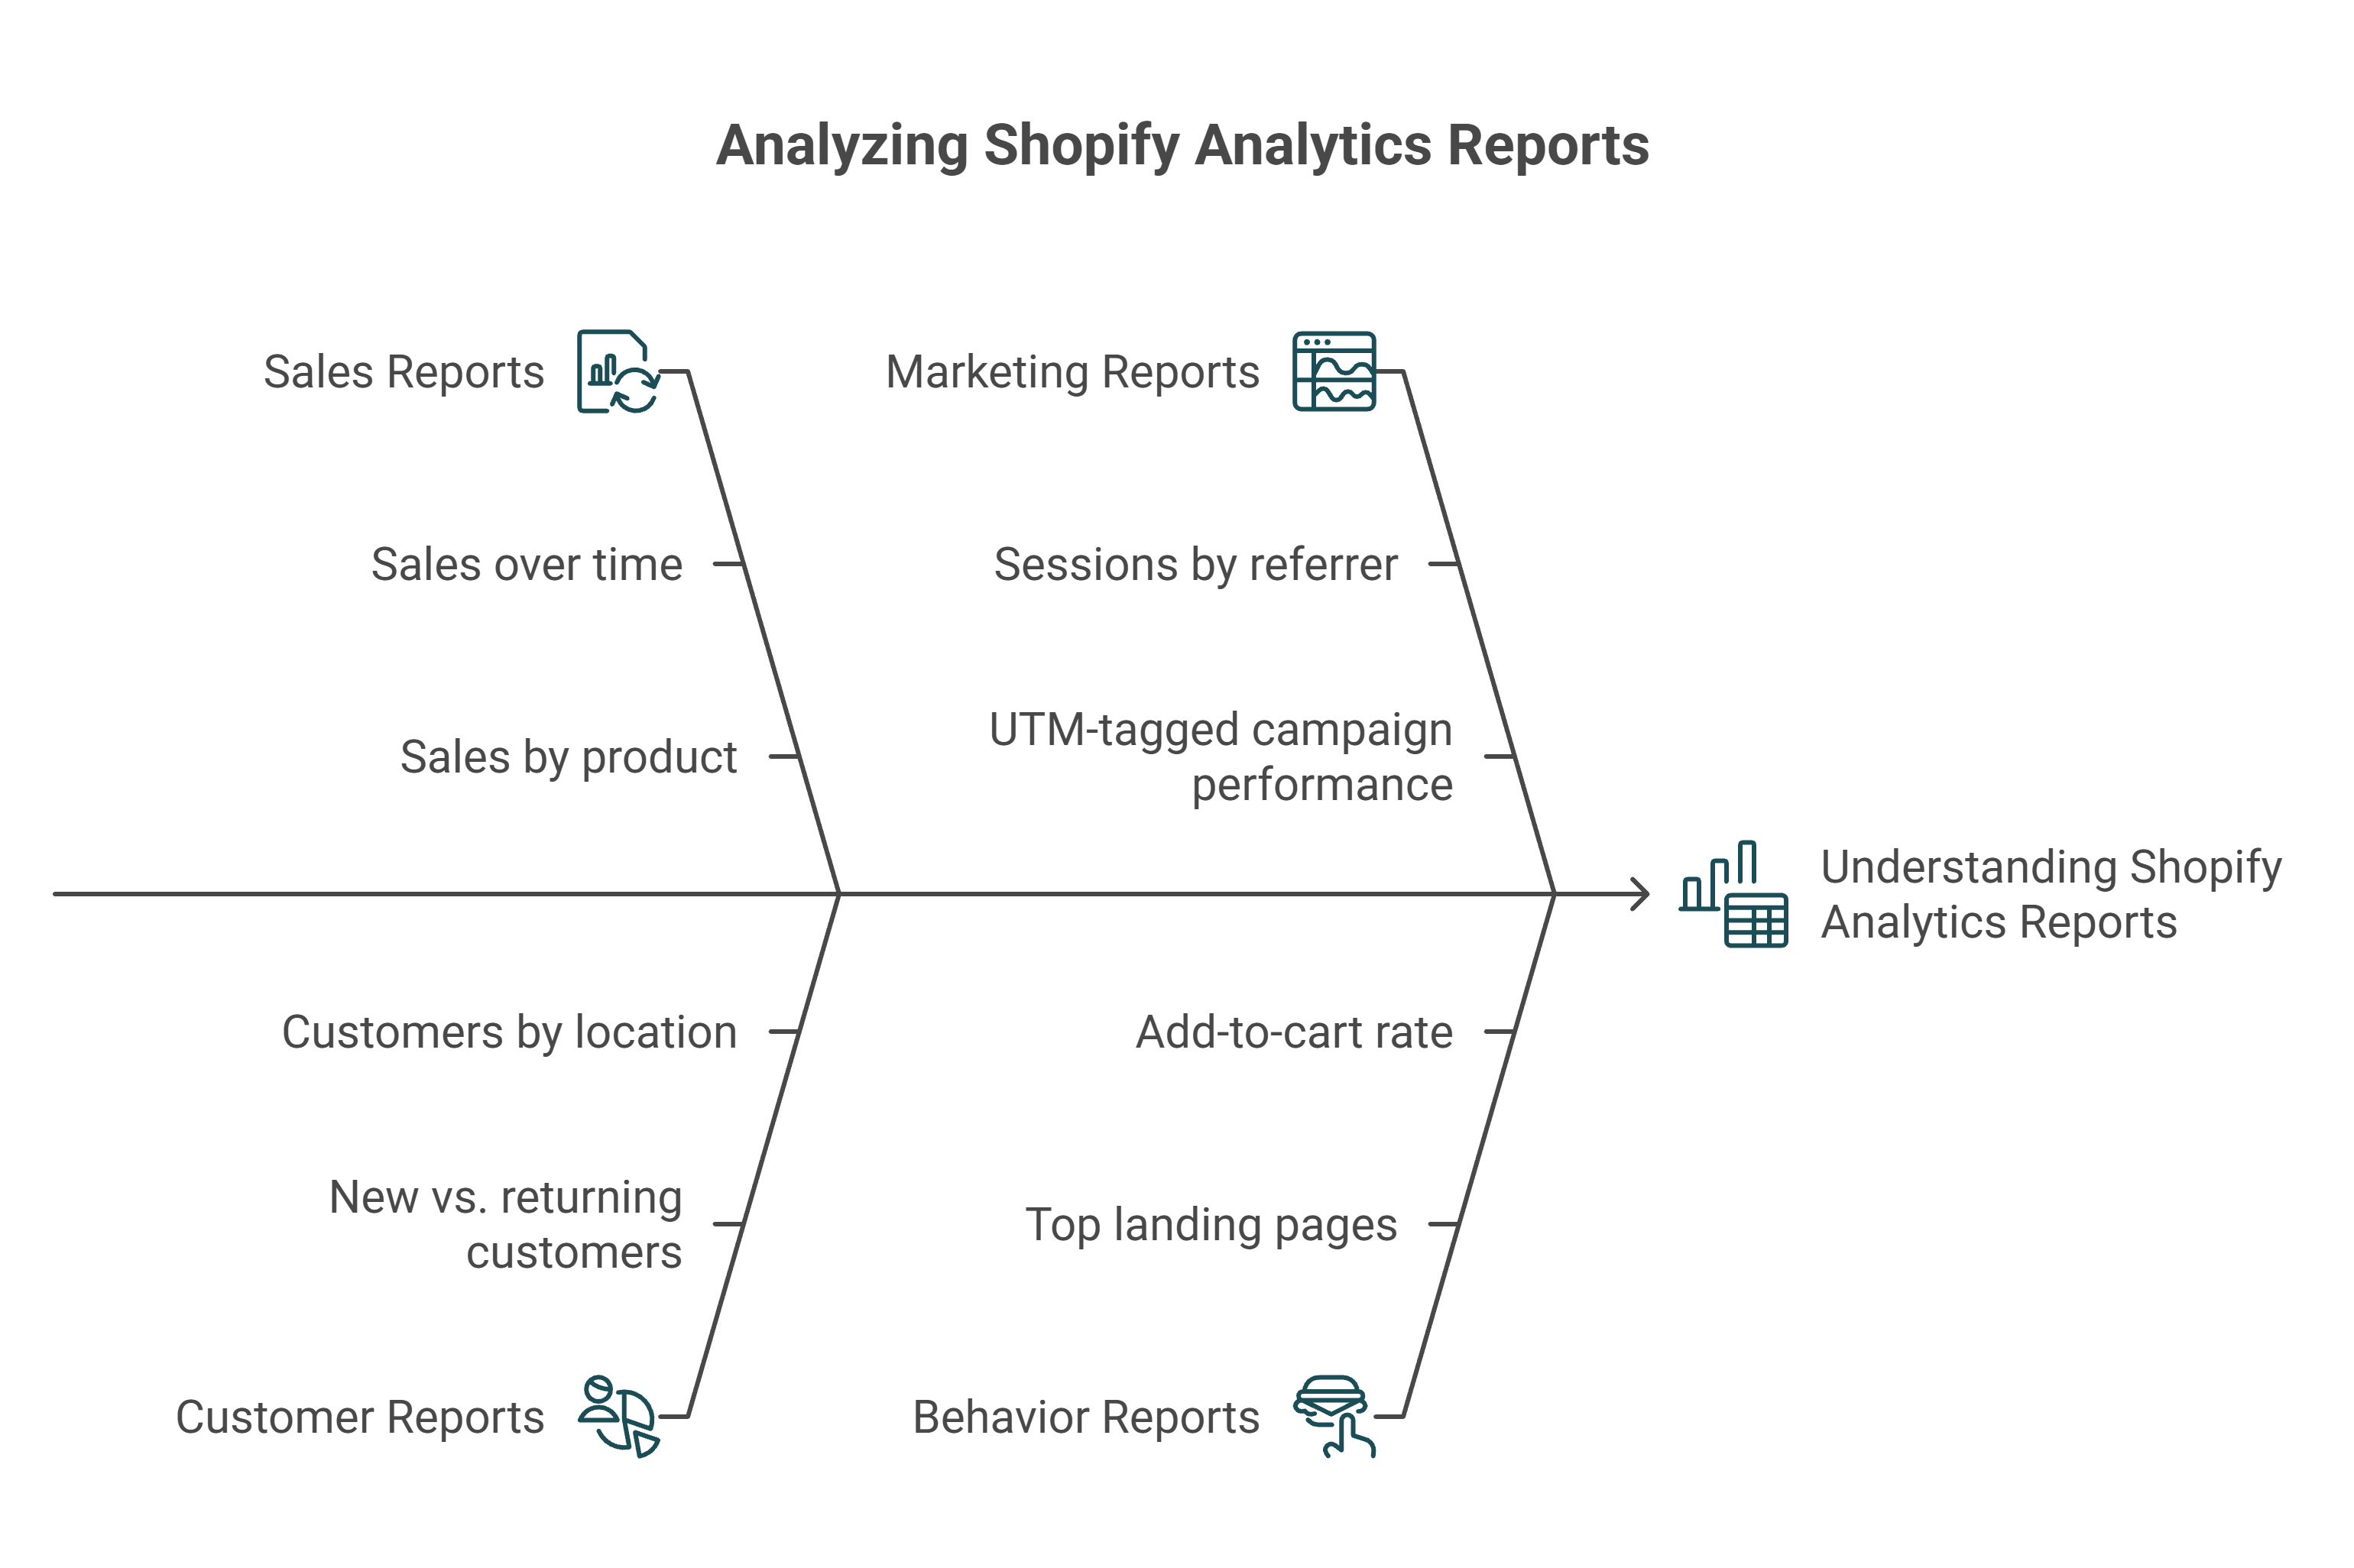
Shopify Analytics organizes its reporting into seven core categories: Sales, Customers, Marketing, Behavior, Finance, Inventory, and Live View. Together, they cover the full spectrum of commerce data flowing through your store.
Report availability depends on your plan tier. Basic Shopify includes approximately 60 pre-built reports, while Advanced and Plus unlock 80+ reports along with a custom report builder that lets you filter, sort, and create tailored views. Each category answers a distinct operational question.
Fishbone diagram breaking down four Shopify analytics report categories with key sub-reports like sales by product, sessions by referrer, customer segmentation, and add-to-cart rate for store data analysis.
💰 Sales Reports
Sales reports form the backbone of Shopify analytics, tracking revenue and order activity across multiple dimensions:
Sales over time daily, weekly, or monthly revenue trends
Sales by product revenue breakdown per SKU (excludes shipping costs)
Sales by channel performance across online store, POS, wholesale, and marketplace channels
Sales by discount code which promotions are driving (or discounting) revenue
Sales by traffic referrer which external sources convert to purchases
Average order value over time AOV fluctuation and trend analysis
👥 Customer Reports
Customer reports segment your buyer base to reveal retention and acquisition patterns:
New vs. returning customers revenue split between first-time and repeat buyers
Customers by location geographic order distribution
One-time vs. repeat purchase rates percentage of buyers who come back
Customer cohort analysis (Advanced+ only) track how monthly acquisition cohorts behave over time, including repeat rate and revenue per cohort
📊 Marketing and Behavior Reports
Marketing reports track how visitors find your store, while behavior reports reveal what they do once they arrive:
Sessions by referrer traffic volume from organic, paid, direct, social, and email sources
Sessions by social source breakdown across Facebook, Instagram, TikTok, Pinterest
UTM-tagged campaign performance conversion tracking for campaigns with custom parameters
Top landing pages which pages visitors enter through (and whether those pages convert or bounce)
Top online store searches what visitors search for on-site (reveals demand gaps)
Sessions by device type mobile vs. desktop traffic split
Add-to-cart rate and reached-checkout funnel conversion progression through the purchase journey
⚠️ A critical caveat: marketing attribution in Shopify relies on last-click attribution only, which inflates the reported value of direct and branded search while under-crediting upper-funnel channels like Meta and TikTok. For a deeper breakdown of how this distorts your numbers, see declining platform ROAS vs. true profitability.
📋 Finance, Inventory, and Live View
Finance reports include gross sales, net sales, taxes, shipping charges, returns/refunds, and gross profit by product
Inventory reports (Advanced+ only) cover month-end inventory snapshots, average inventory sold per day, percent of inventory sold, ABC product analysis, and days of inventory remaining, critical for preventing stockouts
Live View provides a real-time visitor map, active session count, current cart activity, and recent orders as they flow in
Where Native Reporting Reaches Its Ceiling
These reports cover Shopify's commerce data thoroughly, but they cannot reason across marketing spend, cash flow, or operational costs simultaneously. Every report exists in isolation. Luca AI closes this gap by unifying 20+ data sources (Shopify, Meta, Google Ads, Stripe, Xero) into one cross-functional intelligence layer, enabling questions like "Which channel drives the highest-margin revenue after accounting for ad spend and fulfillment costs?" in a single query.
Q3. Every Key Shopify Metric Explained: Definitions, Formulas, and What to Do When They Move [toc=Metric Definitions and Formulas]
Tracking the right metrics is only half the equation, knowing what action to take when they shift is where founders gain an edge. Below are 20+ essential Shopify metrics organized by category, each with a formula, benchmark, and a specific decision trigger.
Sessions by Traffic Source organic, paid, direct, social, email; track which channels are growing or declining week-over-week
ROAS (Return on Ad Spend) Revenue from Ads ÷ Ad Spend. ⚠️ Shopify reports last-click only, creating inflation vs. Meta/Google self-reported ROAS. Action trigger: if blended ROAS drops below 3x, audit channel-level performance before cutting overall spend
Online Store Speed impacts SEO and conversion. Shopify Lighthouse score of 50+ is acceptable; 70+ is strong
How Luca AI Turns Metrics into Decisions Automatically
Shopify tracks these metrics in isolation, each lives in a separate report, disconnected from financial and operational context. Luca AI monitors all 20+ metrics simultaneously, connects them cross-functionally (how today's ROAS affects next month's cash position), and proactively alerts you when any metric crosses your action trigger threshold, without opening a single dashboard.
Q4. Which Metrics Should Founders Prioritize at Each Growth Stage? [toc=Metrics by Growth Stage]
Not all metrics matter equally at every stage, and tracking the wrong ones wastes the hours you can't afford to lose. The priority shifts as your store evolves from validating product-market fit to systematizing a multi-million-euro operation.
Here is the stage-gated framework that maps Shopify analytics metrics to your actual revenue stage, with the specific action each metric should trigger.
Don't scale ad spend until conversion rate exceeds 1.5% and you've identified 2+ profitable traffic sources. Focus entirely on product-market fit signals.
✅ Optimize
$100K-$500K
Repeat purchase rate, LTV, sales by channel, blended ROAS
Shift budget toward channels with LTV:CAC above 3:1. Build email/SMS retention flows to push repeat purchase rate above 25%. Kill channels where ROAS sits below 2x after 90 days.
✅ Scale
$500K-$2M
Customer cohort analysis, gross margin by product, inventory sell-through rate, CAC by channel
Eliminate underperforming SKUs (bottom 10% by margin). Model cash flow impact before scaling any campaign beyond 50%. Cohort analysis reveals which acquisition months produce the highest 90-day LTV.
Automate weekly cross-functional reporting. Evaluate whether your analytics stack can answer questions spanning marketing + finance + operations, or if you're still the manual integration layer.
⚠️ Why Most Founders Track the Wrong Metrics
At the Validate stage, founders often obsess over revenue volume instead of conversion rate, spending aggressively on traffic before the store can convert visitors into buyers at a sustainable rate. At the Scale stage, the trap reverses: founders fixate on top-line ROAS without understanding gross margin by product, which means scaling campaigns that generate revenue but destroy profitability.
The pattern across all stages is consistent: the metrics that matter most are the ones that connect marketing decisions to financial outcomes. A 4x ROAS means nothing if your gross margin is 30% and your fulfillment costs eat the rest. This is exactly why e-commerce founders are drowning in data without gaining actionable clarity. As one Reddit user put it:
"Shopify analytics are fine for a quick snapshot, but they fall short once you want to understand real behavior or make decisions. They're mostly transactional and superficial." — u/CardiologistNo8688, r/ecommerce Reddit Thread
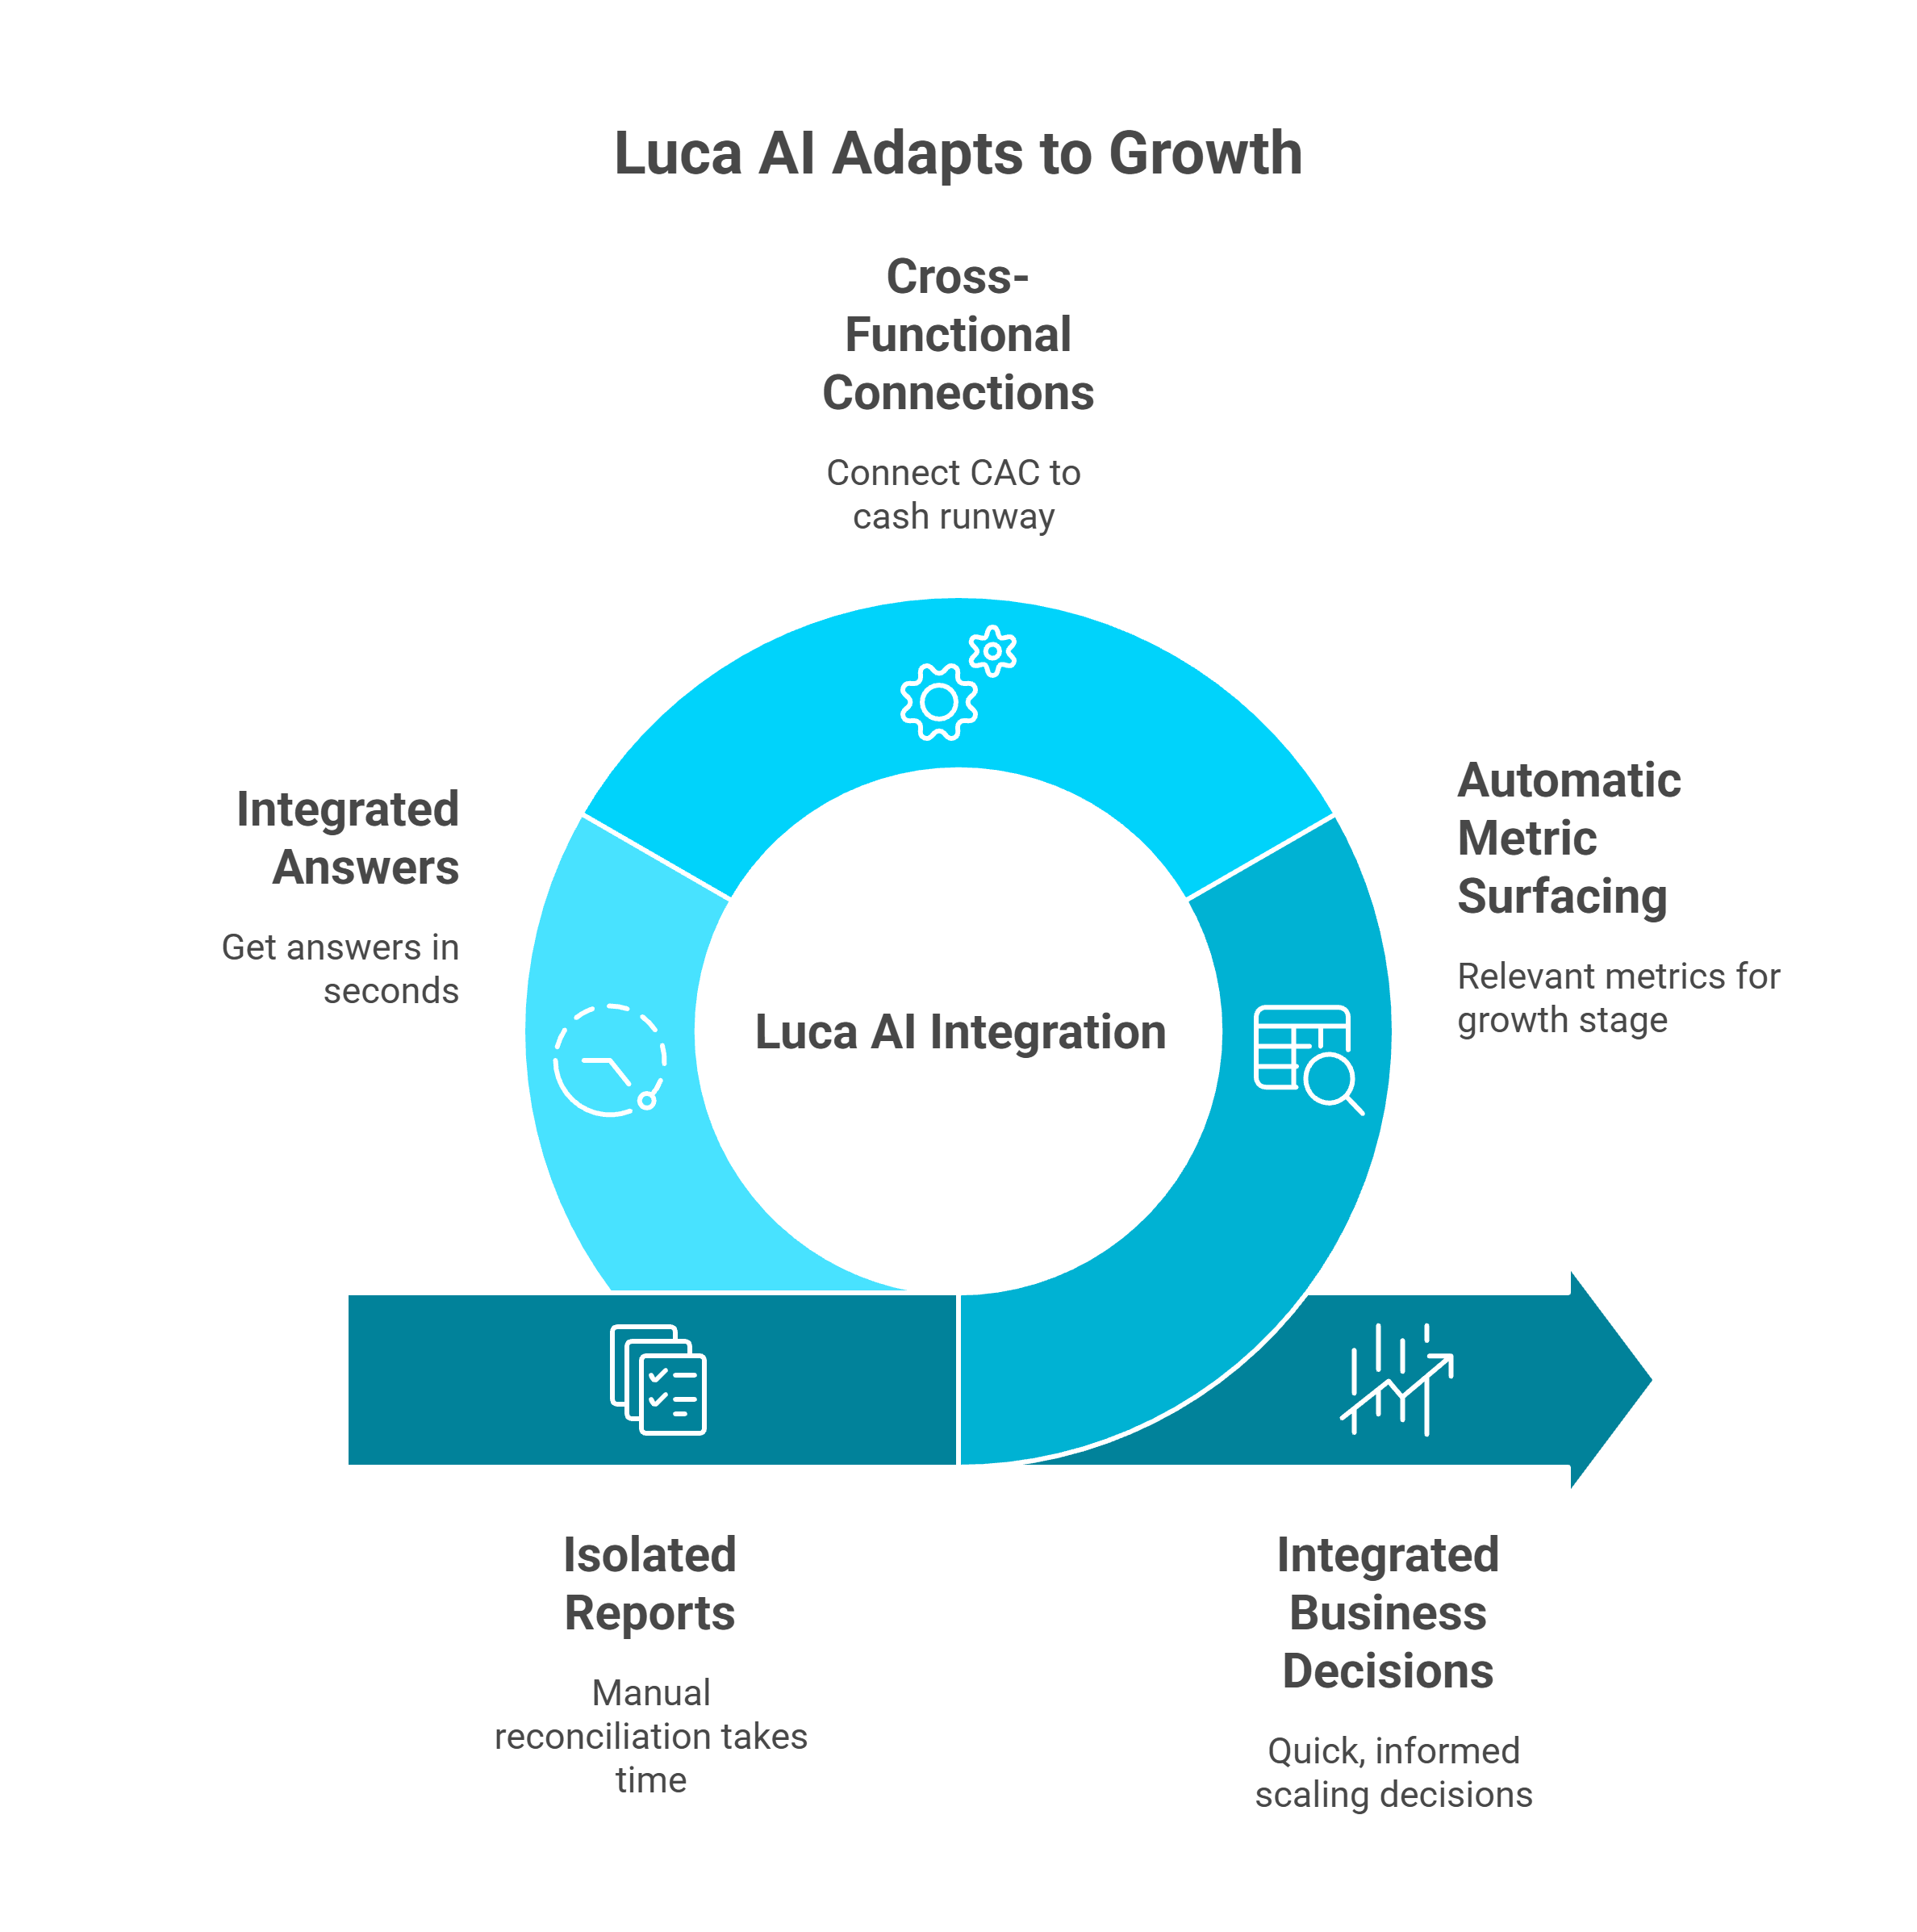
How Luca AI Adapts to Your Growth Stage
Circular diagram illustrating how Luca AI unifies Shopify analytics by connecting cross-functional data, surfacing growth-stage metrics automatically, and transforming isolated reports into integrated ecommerce business decisions.
Luca AI automatically surfaces the metrics that matter for your current growth stage and connects them cross-functionally, so you see how today's CAC affects next quarter's cash runway without manual spreadsheet reconciliation. Instead of toggling between isolated reports, ask "Am I ready to scale this campaign?" and receive an integrated answer spanning marketing performance, inventory capacity, and cash flow projections in seconds.
"A typical Shopify founder with $1M revenue uses 8 to 12 separate tools to answer questions that should take 5 seconds." - Eric Bidinger, Luca AI Founder
Q5. How Does Shopify Reporting Differ by Plan and When Should You Build Custom Reports? [toc=Plan Tiers and Custom Reports]
Shopify gates its analytics capabilities behind pricing tiers, a structure that catches many scaling founders off guard. While every plan includes the basic Analytics dashboard with overview metrics like total sales, sessions, and conversion rate, the depth of reporting available varies significantly depending on your subscription level.
⚠️ Analytics Features by Shopify Plan
Shopify Analytics Features by Plan Tier
Feature
Basic ($39/mo)
Shopify ($105/mo)
Advanced ($399/mo)
Plus ($2,300+/mo)
Overview Dashboard
✅
✅
✅
✅
Standard Pre-Built Reports
✅
✅
✅
✅
Custom Report Builder
❌
❌
✅
✅
Customer Cohort Analysis
❌
✅
✅
✅
Inventory Analytics
Basic
Full
Full
Full
Professional Finance Reports
❌
✅
✅
✅
ShopifyQL Notebooks
❌
❌
✅
✅
Live View
✅
✅
✅
✅
Pricing reflects monthly billing rates. Annual billing reduces costs by approximately 25%.
The most critical distinction is that the Custom Report Builder, the ability to create tailored reports with custom columns, filters, and dimensions, is only available on Advanced ($399/month) and Plus ($2,300+/month). Basic and Shopify plan users are limited to pre-built report templates with no ability to customize data views beyond date range adjustments.
✅ How to Build Custom Reports (Advanced and Plus Only)
For merchants on eligible plans, the custom report workflow follows these steps:
Navigate to Analytics > Reports in your Shopify Admin
Click "Create custom report"
Select a base template (sales, customers, marketing, or behavior)
Add or remove columns from 50+ available data dimensions
Apply filters by date range, product, channel, or location
Save, name, and share the report with your team
Key capabilities include multi-filter combinations, column sorting, and CSV export for offline analysis. However, custom reports carry important limitations that founders should understand before upgrading:
No scheduled or automated delivery reports must be pulled manually every time
No visualization beyond basic data tables no charts, graphs, or trend lines
No cross-source data blending you cannot combine Shopify data with Meta, Google Ads, or Xero in one report
Standard data retention of 13 months meaning historical trend analysis beyond one year requires external archiving
💰 The Upgrade Cost-Benefit Calculation
Upgrading from Basic ($39/month) to Advanced ($399/month) solely for custom reports costs an additional $4,320 per year. Before committing, founders should ask whether the underlying architectural limitation, single-channel, commerce-only data, will persist regardless of plan tier.
Even on Advanced and Plus, Shopify custom reports can only query Shopify data. They cannot pull in Meta ad spend, Google Analytics behavior data, Stripe payment information, or Xero accounting records. For founders managing 8 to 12 disconnected tools, upgrading the Shopify plan adds custom columns but does not solve the cross-functional visibility gap. When evaluating whether a plan upgrade or an external tool delivers more value, consider the best AI tools for Shopify owners that address this architectural limitation directly.
How Luca AI Replaces the Upgrade Decision
Luca AI generates custom reports conversationally. Ask "Show me contribution margin by product and channel for Q4" and receive an instant cross-platform analysis without CSV exports, plan upgrades, or SQL knowledge. Because Luca connects 20+ data sources into one reasoning layer, the limitations of plan-gated reporting become irrelevant.
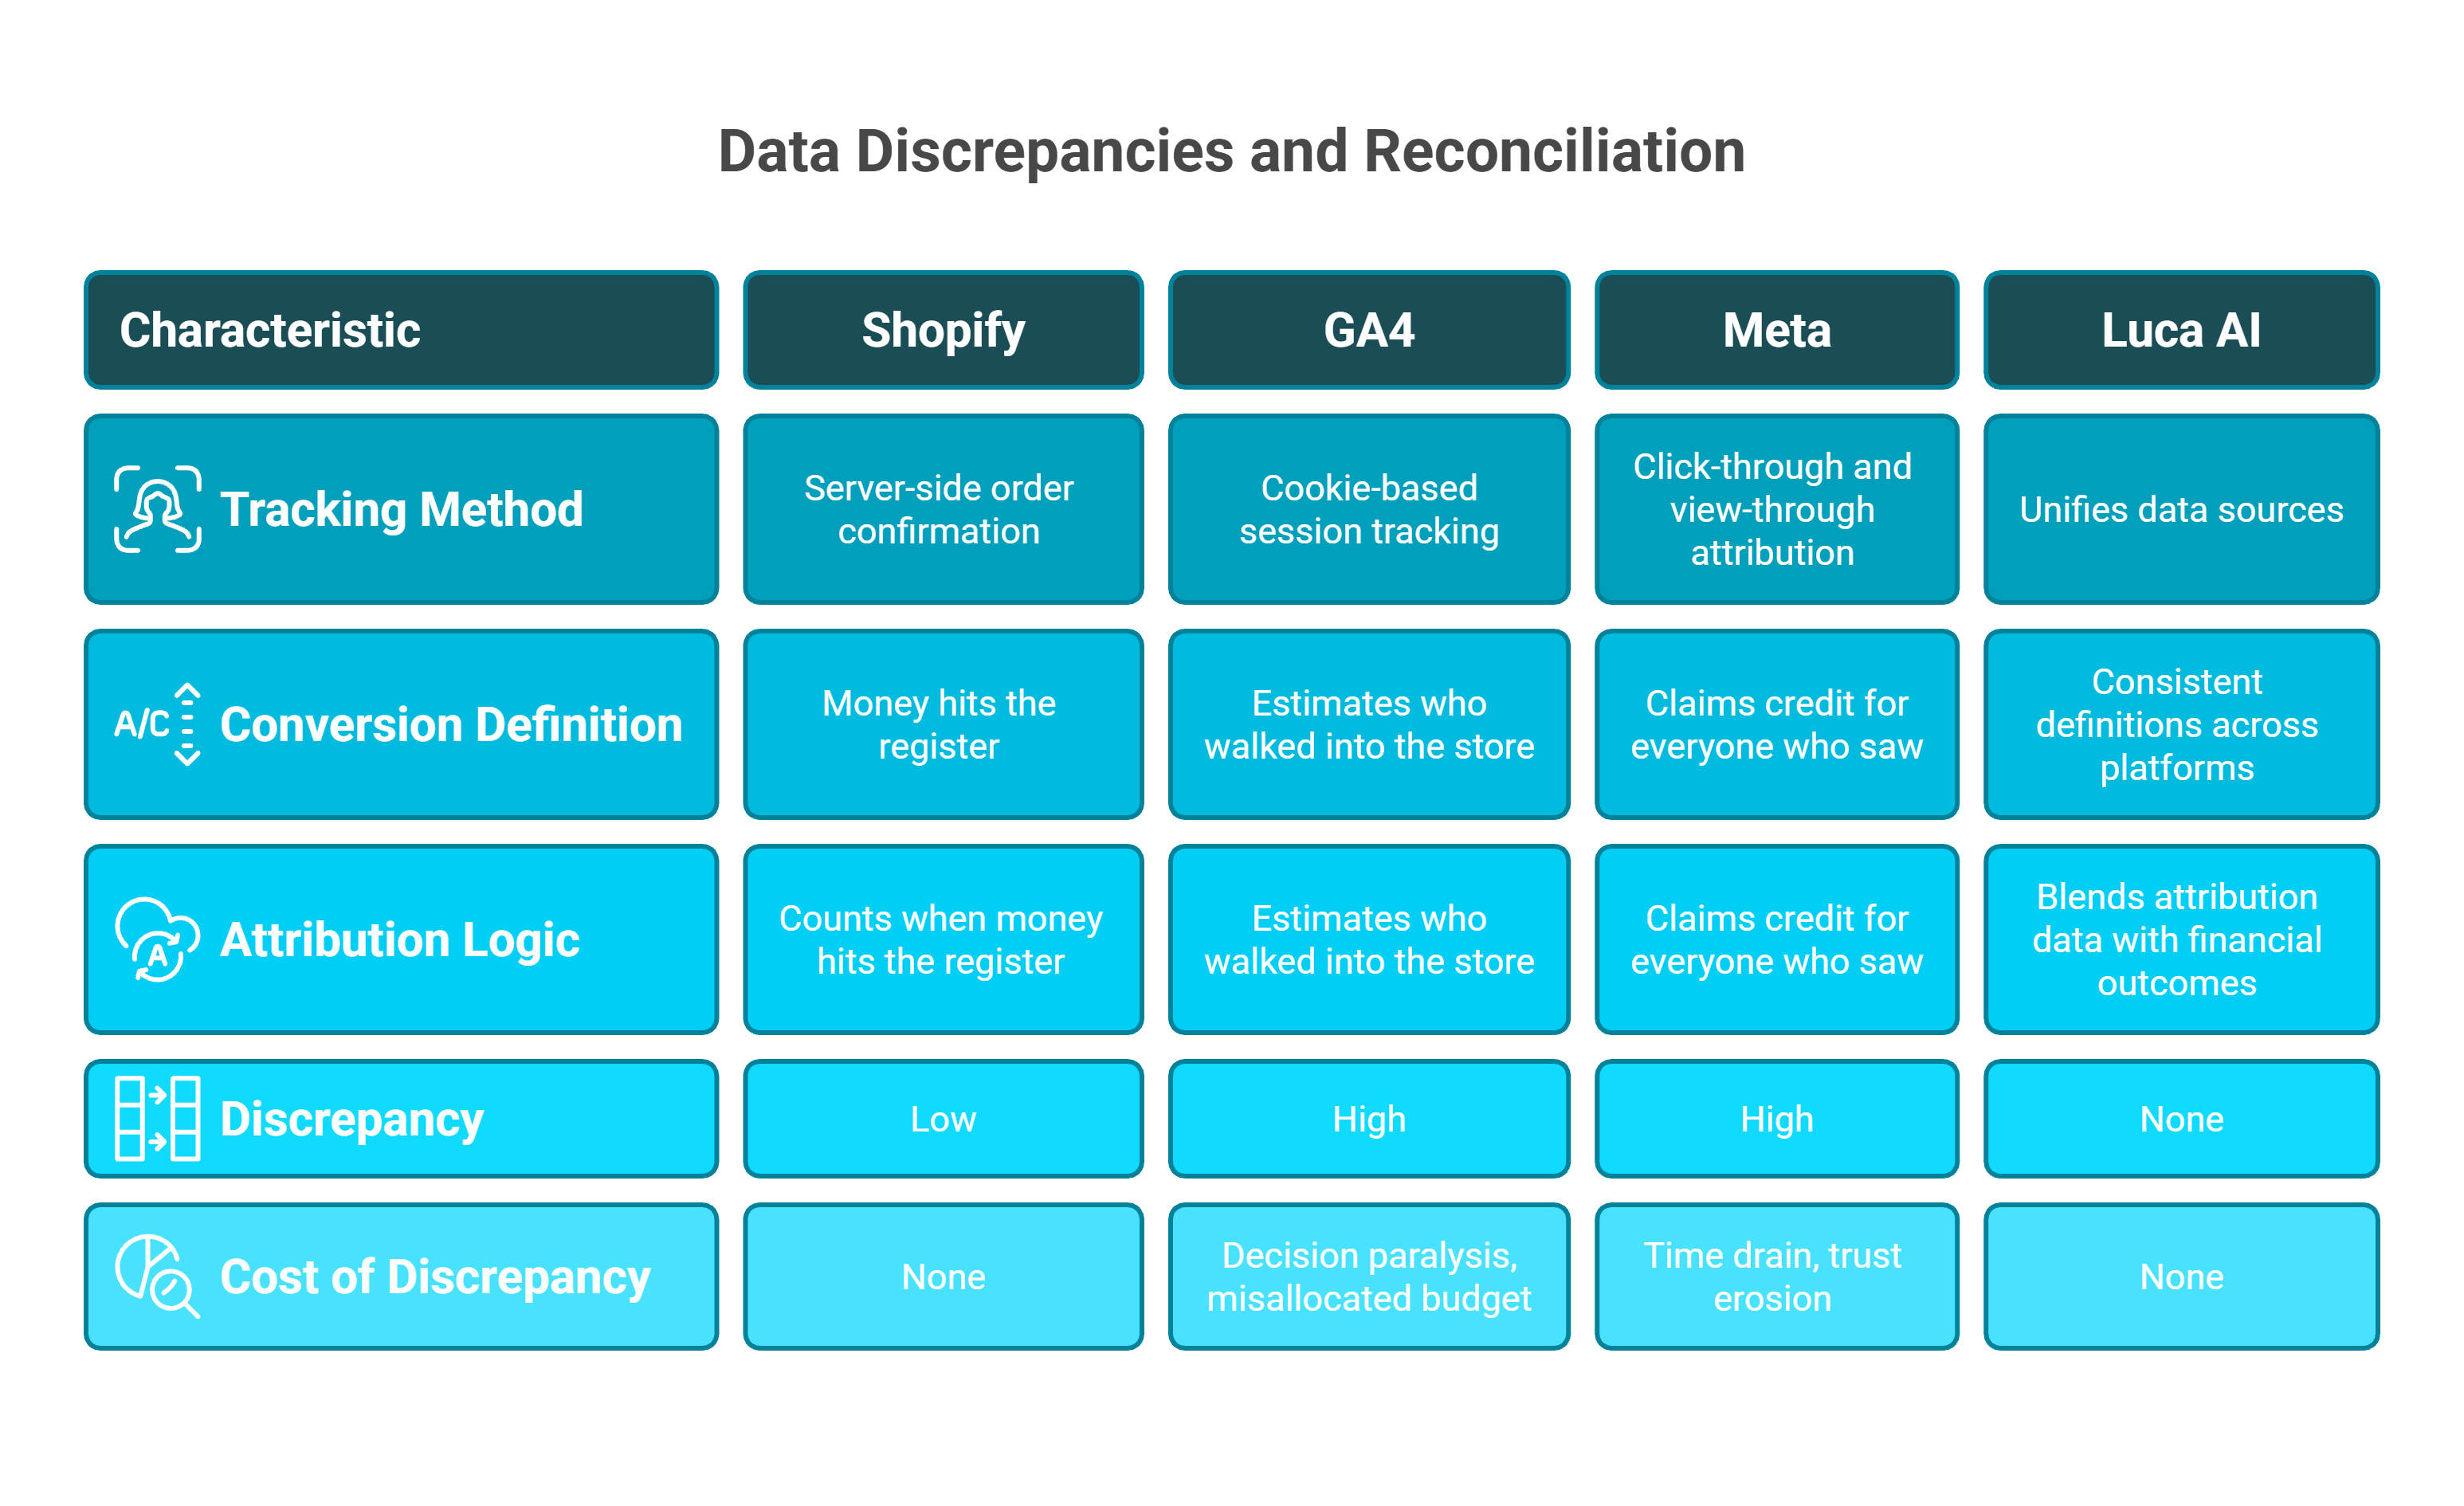
Q6. Why Does Your Shopify Data Disagree with Google Analytics and Meta Ads? [toc=Data Discrepancy Root Causes]
It is Monday morning. Your Shopify dashboard says you made $42,000 last week. Meta Ads Manager claims it drove $58,000 in purchases. Google Analytics reports $36,000 in e-commerce revenue. Three tools, three different truths, and you have no idea which one to trust.
⚠️ Why This Problem Exists
Side-by-side comparison of Shopify, GA4, Meta, and Luca AI across tracking methods, conversion definitions, and attribution logic, highlighting data discrepancy costs in ecommerce reporting.
Shopify uses server-side order confirmation, the most accurate method for completed purchases. GA4 uses cookie-based session tracking, subject to ad blockers, consent banners, and iOS privacy changes that lose 15 to 30% of sessions. Meta uses its own click-through and view-through attribution windows (7-day click, 1-day view default). Each tool defines a "conversion" differently, counts revenue at different points in the funnel, and applies different attribution logic. Discrepancies of 20 to 40% between platforms are now the norm, not anomalies.
The problem is architectural, not a bug. Shopify counts when money hits the register. GA4 estimates who walked into the store. Meta claims credit for everyone who saw the billboard on the highway. Each measurement is technically correct within its own framework, but none tells the complete story.
❌ The Hidden Costs of Data Fragmentation
Decision paralysis founders delay scaling winning campaigns because they cannot confirm true ROAS
Misallocated budget over-crediting Meta leads to under-investment in organic and email channels driving profitable revenue
Time drain 8+ hours per week manually reconciling cross-platform data in spreadsheets to triangulate "the real number"
Trust erosion marketing and finance teams argue over whose numbers are "right," creating organizational friction that slows every decision cycle
💡 How Luca AI Reconciles the Data
Luca AI unifies Shopify order data, GA4 behavioral data, Meta/Google/TikTok ad spend data, and Stripe/Xero financial data into one reconciled view with consistent definitions. Ask "What is my true ROAS on Meta including all costs?" and get a single, cross-validated answer in seconds, blending attribution data with actual financial outcomes. No exports, no conflicting dashboards, no Monday morning reconciliation sessions.
Because Luca normalizes every data source into a single schema where "revenue" and "conversion" carry one definition across all platforms, the 20 to 40% discrepancy problem disappears. You stop debating which tool is right and start making decisions based on a unified source of truth.
📣 What the Community Is Saying
Data trust issues are not isolated frustrations. They are systemic:
"It is becoming very opaque, it doesn't have real-time, the sampling is increasingly wild, and now it applies a threshold. If you don't pay for BigQuery, you're really tied hand and foot. The change to GA4 has been for the worse. Functionalities have been lost, it has switched to a hit measurement model but there is data loss, for example, sessions do not match the session_start event. To make decisions based on grounded data, it is really difficult to trust it 100%." — Verified User in Retail, G2 Verified Review
"When we switched to an enterprise web analytics solution that does no sampling, we found that Google Analytics was telling us we had twice as much traffic as we actually do. The sampling also means that you will not receive the same answer twice." — Gitai B., Marketing Lead, G2 Verified Review
Q7. What Are the Real Limitations of Shopify Analytics? [toc=Analytics Limitations Audit]
Score your current Shopify analytics setup against these 8 criteria to determine if native reporting still serves your growth stage, or if you have outgrown it.
📊 The Analytics Audit Checklist
☐ Can you see true contribution margin by channel (not just gross sales)?
☐ Does your dashboard alert you automatically when CAC spikes or ROAS drops below your threshold?
☐ Can you answer "If I scale this campaign 50%, what happens to cash flow in 90 days?" without a spreadsheet?
☐ Is your marketing, finance, and operations data visible in one unified view?
☐ Can you track customer LTV beyond Shopify's 13-month standard data retention window?
☐ Does your reporting accurately reconcile ad platform spend (Meta/Google) with actual Shopify revenue?
☐ Can your team get answers without exporting CSVs, switching between 4+ tools, or writing SQL?
☐ Can you build scenario models spanning marketing spend, inventory needs, and cash position simultaneously?
If you checked fewer than 4 boxes, you are likely drowning in data without gaining actionable clarity. Every unchecked box represents a decision bottleneck that compounds as you scale.
⚠️ Community Evidence: Where Native Analytics Falls Short
These limitations are not theoretical. Shopify Sidekick, the platform's AI assistant designed to help merchants get answers faster, has faced significant user criticism for inaccuracy and unreliability:
"Sidekick straight up lied to me at one point. I spent AGES following its instructions before eventually talking to a real agent who told me what I was trying to do wasn't possible." — u/ntyelac, r/shopify Reddit Thread
"I've asked for inventory value, gives me an incorrect figure." — u/ntjgikz, r/shopify Reddit Thread
"I tried getting it to build some category sales analytics, but it failed miserably." — u/nv1x5p0, r/shopify Reddit Thread
📈 Score Interpretation
6 to 8 checks: Your analytics stack is mature. Focus on optimization, not overhaul.
3 to 5 checks: Critical gaps exist. You are likely making high-stakes decisions on incomplete data.
0 to 2 checks: Fragmentation is costing you revenue, time, and confidence. Manual processes dominate your workflow.
The pattern across most scaling Shopify stores is consistent: founders start between 1 and 3 checks and stay there because Shopify's native analytics was designed for commerce reporting, not cross-functional financial management or operational intelligence.
✅ How Luca AI Converts Unchecked Boxes into Checks
Luca AI is designed as an AI Co-Founder for e-commerce that addresses every gap in the audit above. Cross-functional data synthesis, proactive alerts, scenario modeling, and a conversational interface are all accessible without CSV exports or plan upgrades. Most founders go from 2 to 3 checks to 8 out of 8 within the first week of connecting their data sources.
"Most tools show marketing OR finance, never both together with capital access." - Eric Bidinger, Luca AI Founder
Q8. What Should Founders Look for When Shopify Analytics Isn't Enough? [toc=Evaluating Analytics Alternatives]
Choosing an analytics layer beyond Shopify means committing to a data architecture that will shape every business decision for years. Most founders evaluate based on integration count or monthly price, both of which miss the critical question: Can it reason across your data, or just display it in a prettier interface?
❌ The Wrong Way to Decide
Feature checklists favor incumbents with the longest product history, not the best architecture. The real risk is not picking a tool with fewer integrations. It is locking into a system that silos your data by function (marketing here, finance there) and forces you to remain the manual integration layer between them.
Community evidence validates this trap consistently:
"Our experience with Triple Whale has been extremely frustrating and almost categorically terrible. The integrations are inconsistent, building with the AI tool Moby is very buggy and crashes more than half the time, and support is largely unresponsive. It has been unable to deliver on the promise to provide any insights or accurate data to our business, and we end up reverting back to direct data sources like Meta, Shopify, Recharge." — Matt Huttner, Trustpilot Verified Review
"Since day one, the data has been inaccurate. Daily revenue totals are wrong, entire order blocks are missing. Worse yet, Triple Whale shows orders from external marketplaces as if they were real conversions even though these orders never go through our Shopify store. Completely fake data." — XTRA FUEL, Trustpilot Verified Review
"The downside of GA is its learning curve, especially with GA4. The interface and reporting structure are not very intuitive at first, and finding specific metrics or building custom reports can take time." — Aman S., Performance Marketing Head, G2 Verified Review
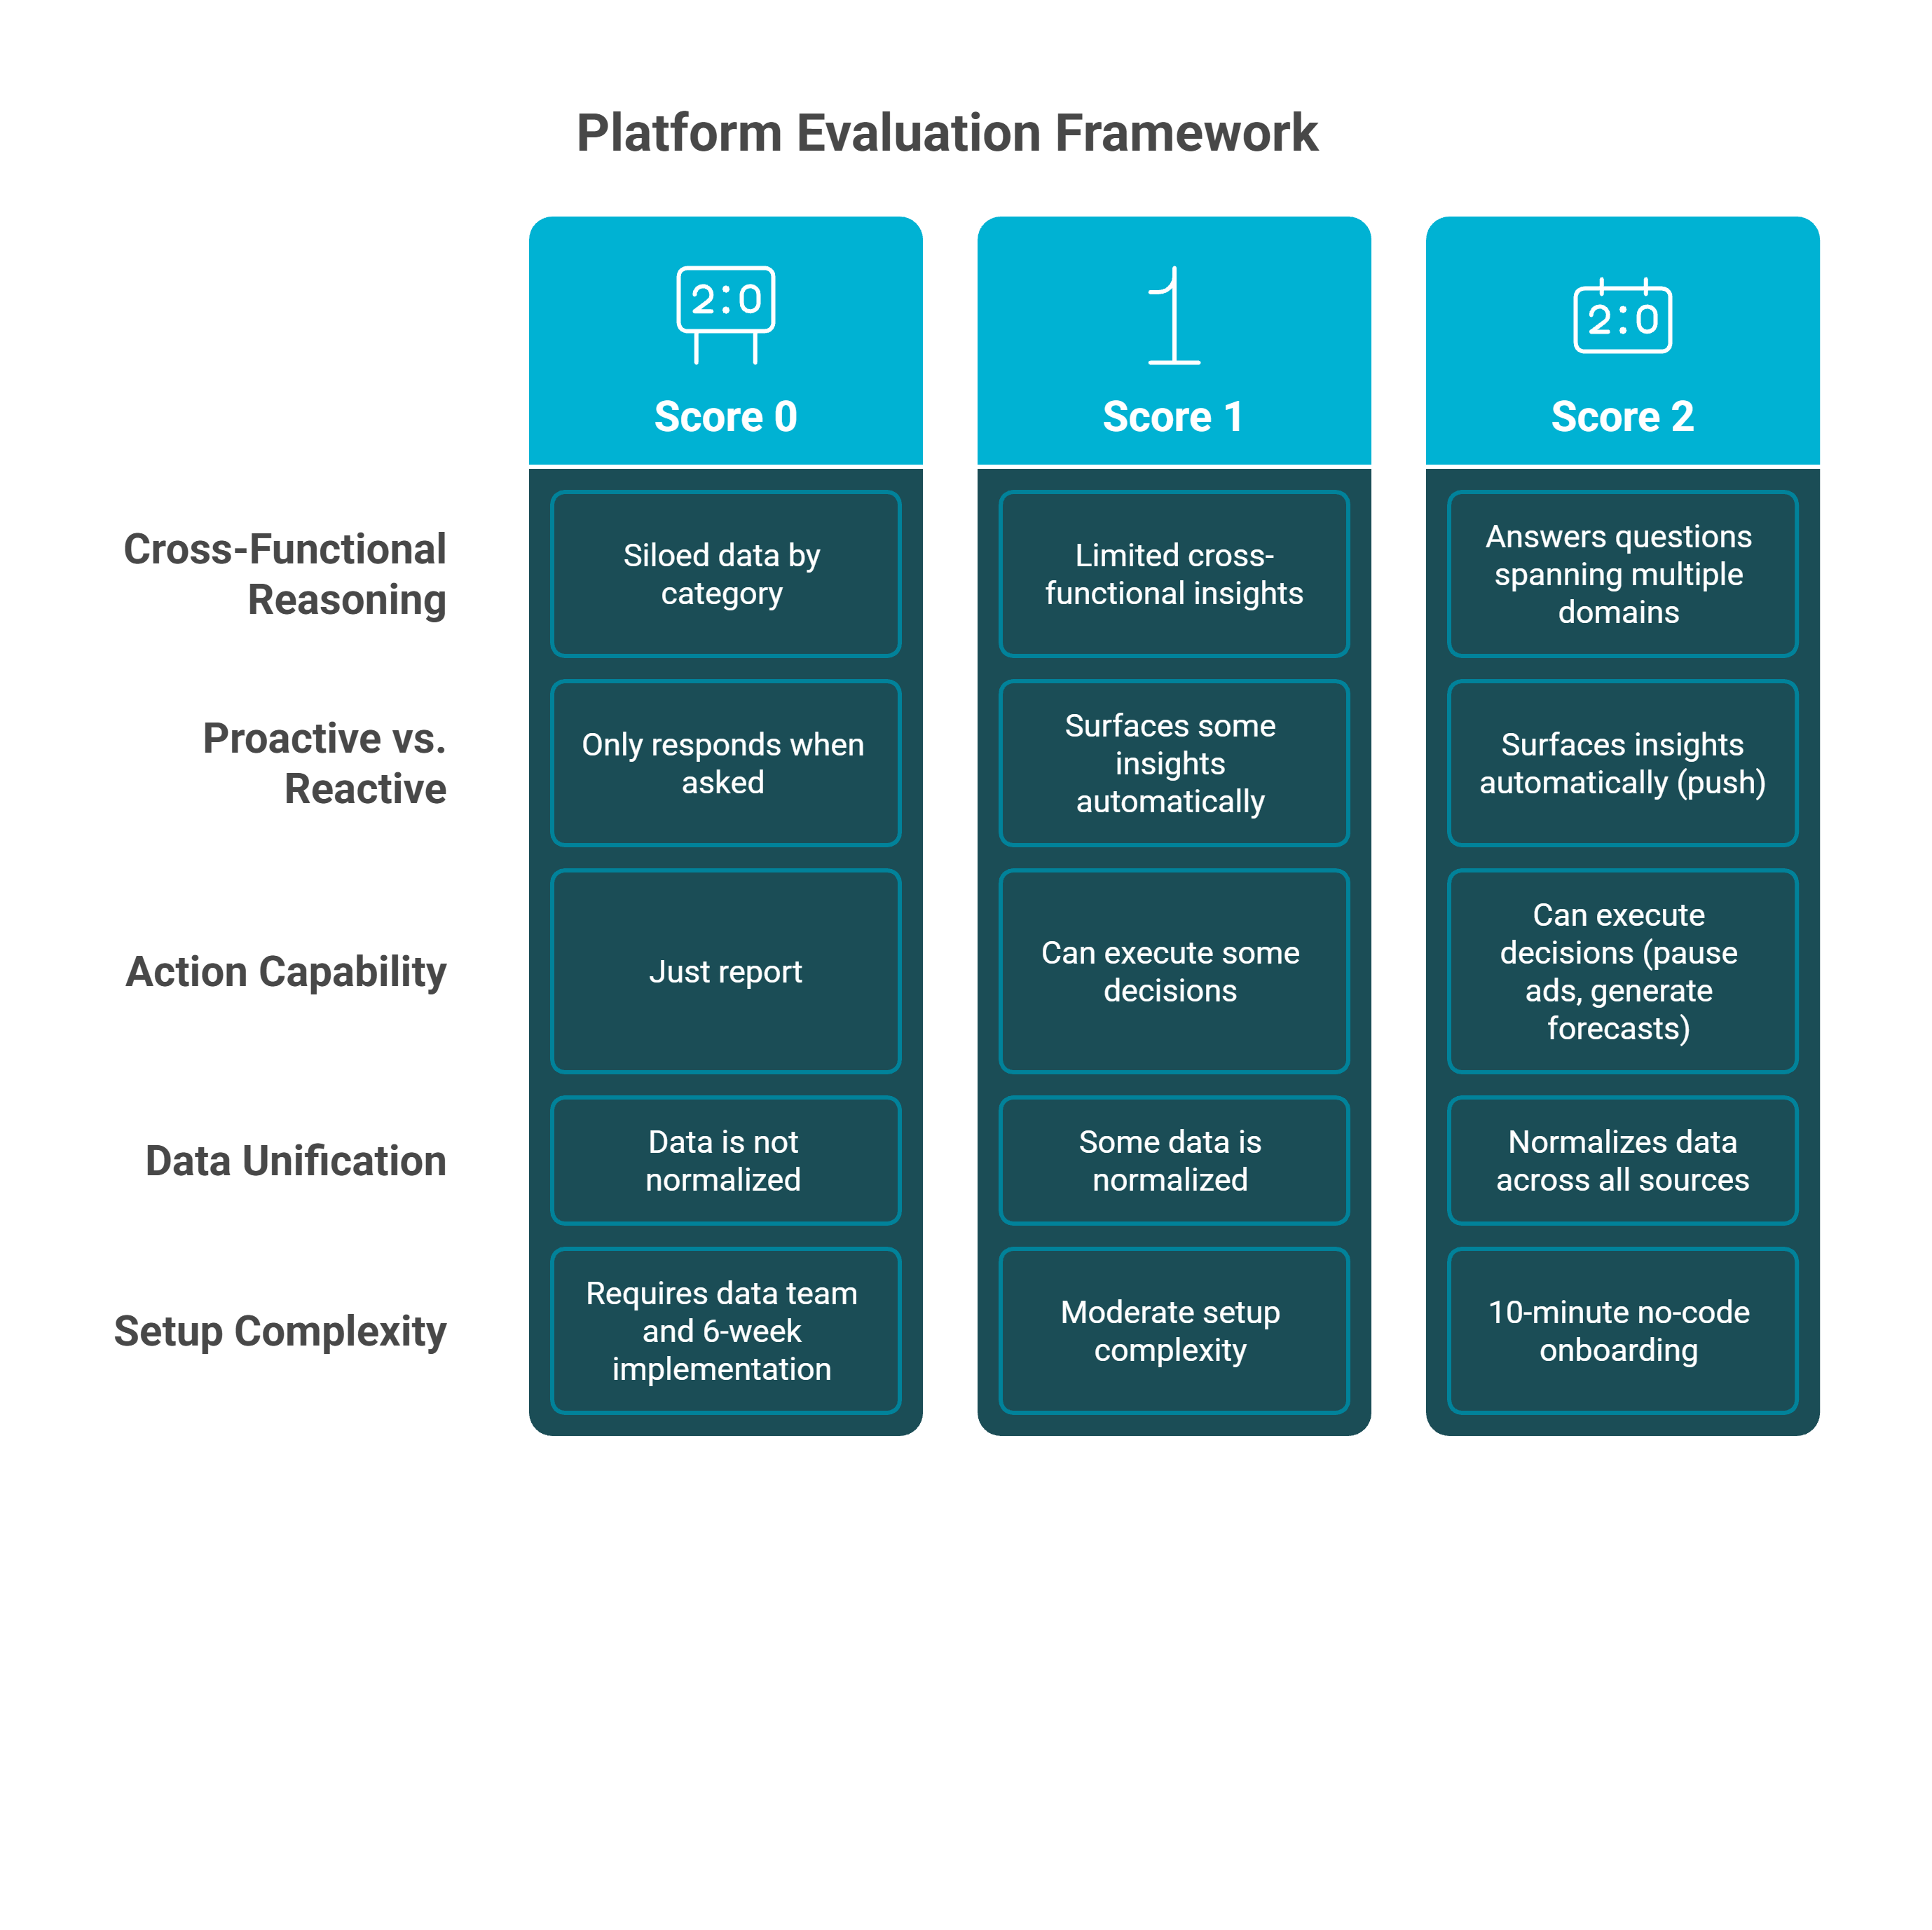
Score each platform 0 to 2 on these seven criteria. Tools scoring 10+ represent genuine architectural advancement. Below 7 means you are buying a prettier dashboard, not intelligence.
Three-tier scoring matrix for evaluating Shopify reporting alternatives across five criteria, from siloed dashboard tools at Score 0 to unified cross-functional intelligence platforms at Score 2.
Cross-Functional Reasoning can it answer questions spanning marketing + finance + operations, or does it silo data by category?
Proactive vs. Reactive does it surface insights automatically (push), or only respond when asked (pull)?
Action Capability can it execute decisions (pause ads, generate forecasts), or just report?
Data Unification does it normalize data across all sources into one consistent schema?
Setup Complexity does it require a data team and 6-week implementation, or 10-minute no-code onboarding?
Conversational Interface can founders get answers in natural language without SQL or dashboard navigation?
Intelligence Architecture does it use AI to reason across domains, or just display pre-built dashboards?
⭐ Where Luca AI Stands
Luca AI Evaluation Framework Scorecard
Criterion
Score
Why
Cross-Functional Reasoning
2/2
Unified data layer across commerce, marketing, finance, and ops
Proactive Intelligence
2/2
24/7 automated scanning for risks and opportunities
Action Capability
2/2
Executes decisions, not just recommendations
Data Unification
2/2
Single schema, consistent definitions across 20+ sources
Setup Complexity
2/2
10-minute no-code integration
Conversational Interface
2/2
Natural language replaces SQL and dashboard clicks
Intelligence Architecture
2/2
AI reasoning engine, not static dashboards
Total
14/14
-
Luca AI scores 14 out of 14 because it was designed from the ground up as an AI Co-Founder, not a retrofitted analytics tool. The real question is not "Which tool has the most features?" It is "Which system can reason about your business the way a co-founder would, and then fund the opportunity it identifies in real time?" That is the shift from renting dashboards to hiring an intelligence partner that understands your marketing, forecasts your cash flow, and acts on both.
"Most tools show marketing OR finance, never both together with capital access." - Eric Bidinger, Luca AI Founder
Q9. How Can You Move from Isolated Metrics to Cross-Functional Business Decisions? [toc=Cross-Functional Decision Making]
The gap between having metrics and making decisions is the single most expensive bottleneck in scaling e-commerce. Shopify analytics gives you conversion rate in one tab, sales by channel in another, and customer data in a third. But no report answers the question that actually matters: "If I increase Meta spend by 40% this month, will I have enough cash to cover the inventory I need in 60 days?"
⚠️ Why Isolated Reports Create Decision Paralysis
The core problem is architectural. Every Shopify report answers one question about one dimension of your business. Connecting those answers requires you to become the manual integration layer, exporting CSVs, building spreadsheets, cross-referencing ad platform data, and reconciling numbers that never quite match. This process introduces three compounding failures:
Latency by the time you reconcile last week's data across 4 to 6 platforms, the window for action has often closed
Error accumulation manual data stitching introduces formula errors, stale numbers, and conflicting definitions that erode confidence in every decision
Context collapse a 4x ROAS on Meta looks great in isolation, but if that campaign drives low-margin products that increase fulfillment costs, you are scaling a losing proposition without realizing it
The result is that founders either make gut decisions without data support or delay decisions while waiting for "complete" information that never arrives. Both paths cost revenue.
💡 The Cross-Functional Decision Framework
Moving from isolated metrics to integrated decisions requires a structural shift, not a tool upgrade. The intelligence capital thesis argues that analytics and capital must be connected for decisions to translate into action. The framework has three requirements:
Unified data schema every metric (ROAS, LTV, gross margin, cash position) must share consistent definitions across all sources
Relational reasoning the system must connect marketing inputs to financial outputs automatically, so a question about ad spend returns an answer about cash flow
Action capability insights must be paired with execution, whether that means adjusting budgets, triggering alerts, or deploying capital
Without all three, you are still the middleware between your tools.
📣 Community Evidence
The frustration with fragmented analytics is consistent across platforms:
"Sidekick is still pretty rough around the edges for a lot of queries. The AI stuff they rolled out feels more like a beta feature than something production ready." — u/ntmq97a, r/shopify Reddit Thread
"It has pretty substantial limitations for ecommerce tracking and often isn't close to accurate for conversion rate, number of orders, or revenue." — Verified User in Information Technology and Services, G2 Verified Review
✅ How Luca AI Bridges the Gap
Luca AI is built on all three pillars of the cross-functional decision framework. It normalizes data from Shopify, Meta, Google Ads, Stripe, and Xero into a single schema, reasons across marketing, finance, and operations in every query, and pairs insights with capital deployment when the opportunity warrants it. Ask "Should I scale this campaign?" and receive an answer that factors in ROAS, gross margin, inventory availability, and 90-day cash impact, all in one response.
Q10. What Does an AI-Powered Analytics Workflow Look Like in Practice? [toc=AI-Powered Analytics Workflow]
The difference between manual reporting and AI-powered analytics is not speed. It is the elimination of an entire category of work that should never have been the founder's job in the first place.
⏰ The Manual Reporting Morning
A typical Monday for a founder relying on native Shopify analytics and disconnected tools looks like this:
Open Shopify Admin, check weekend sales totals and conversion rate (5 minutes)
Switch to Meta Ads Manager, review campaign spend and ROAS (10 minutes)
Open Google Analytics, compare session data and landing page performance (10 minutes)
Log into Klaviyo, check email revenue attribution (5 minutes)
Open a spreadsheet, manually calculate blended ROAS, CAC, and contribution margin (20 minutes)
Cross-reference numbers that do not match across platforms (15 minutes)
Draft a summary for your team or co-founder (10 minutes)
Total: 75 minutes before a single decision is made. And this happens every day. Over a week, that is 6+ hours spent on reporting mechanics, not strategic thinking.
💡 The AI-Powered Alternative
An AI-powered analytics workflow replaces all seven steps with a single interaction. Instead of navigating dashboards, the founder opens a conversational interface and asks:
"How did we perform over the weekend across all channels?"
"Which campaigns have a blended ROAS above 3x after accounting for fulfillment costs?"
"Is my CAC trending up this month, and which channel is driving the increase?"
Each question returns a synthesized, cross-functional answer in seconds, pulling from every connected data source simultaneously. No tab switching, no CSV exports, no reconciliation spreadsheets.
📊 Beyond Reactive Reporting
The deeper shift is from reactive to proactive. Manual workflows only surface information when you ask for it. Agentic AI for ecommerce continuously monitors your business and pushes alerts before problems compound:
CAC spiked 22% on Google Ads this week, recommend pausing underperforming ad sets
Inventory for your top SKU will run out in 14 days at current sell-through rate
Conversion rate dropped 18% on mobile since your last theme update
This is the architectural difference between a dashboard you check and an intelligence layer that watches your business 24/7.
📣 Why Current AI Tools Fall Short
Not all AI-powered tools deliver on this promise. Shopify Sidekick, for example, has access to store data but struggles with reliability:
"Nothing right now. Its cool that it can access a lot more data than other AI chatbots but I find I get much better results from ChatGPT or Claude after I've gathered and provided it with all the information necessary." — u/o4fb00j, r/shopify Reddit Thread
"Spinning in circles and telling you it can do things that it can't. AI is a great tool. Sidekick just acts like a tool." — u/o4hy5m7, r/shopify Reddit Thread
✅ How Luca AI Delivers the Full Workflow
Luca AI was designed as the daily operating system for e-commerce founders. It replaces the 75-minute manual morning with a single conversational query, monitors all metrics proactively, and connects insights to action, including capital deployment when a scaling opportunity is validated. The result is that founders spend time on strategy, not spreadsheet reconciliation.
Q11. How Should Founders Build Their E-Commerce Analytics Stack? [toc=Building Your Analytics Stack]
The analytics stack you build today will shape every business decision for the next 12 to 24 months. Most founders assemble their stack reactively, adding tools as problems emerge, and end up with 8 to 12 disconnected platforms that create more confusion than clarity.
❌ The Common Stack Mistake
The typical DTC analytics stack evolves like this: Shopify for sales, Google Analytics for behavior, Meta Ads Manager for acquisition, Klaviyo for retention, a spreadsheet for financial modeling, and eventually a third-party tool like Triple Whale or Polar Analytics to "unify" it all. Each addition solves one problem while creating a new integration gap. The result is a patchwork architecture where no single tool can answer cross-functional questions, and the founder remains the manual data integration layer.
The reviews tell this story consistently:
"Not impressed compared to price point. They have not basic features in place like a line chart Year on Year comparison of revenue etc. I've also reported an issue with inventory levels, as our inventory is multiplied with 6, since we have 6 different Shopify stores connected to the same warehouse. Not really rocket science." — Maja, Trustpilot Verified Review
"Shortly after onboarding we were assigned an account manager. About a month later, she was laid off and we were never assigned a new account manager. I have the direct email of a support specialist, but the response time has been less than ideal especially when real-time data is important for our team." — Ben S., Director of Commercial Operations, G2 Verified Review
"Worst customer service I have ever experienced. Reached out about a simple issue that I can't edit widgets as I am supposed to according to their help center. It takes at least 24 hours until I get a response, if I am lucky and they don't just ignore the message." — Lars Volkers, Trustpilot Verified Review
Instead of adding tools layer by layer, evaluate your analytics architecture against three criteria:
Data unification does the system connect all sources into one schema, or does it sit on top of silos and display them side by side?
Reasoning capability can it answer questions that span marketing, finance, and operations, or only questions within a single domain?
Action integration can insights trigger execution (budget adjustments, alerts, capital deployment), or do they require manual follow-through?
Founders who evaluate on these criteria avoid the trap of accumulating point solutions that each solve 20% of the problem. The goal is not the best way to track unit economics in isolation. It is a system that connects unit economics to marketing decisions to cash flow outcomes in real time.
💡 How Luca AI Replaces the Stack
Luca AI is architecturally designed to replace the fragmented stack, not add to it. By unifying 20+ data sources into a single reasoning engine, Luca eliminates the integration gaps that force founders to become manual data engineers. One conversational interface replaces 8 to 12 disconnected logins, and every answer factors in the full business context, from ROAS to cash runway to inventory capacity.
Yes. Every Shopify plan includes access to the analytics dashboard and a set of pre-built reports. However, advanced features like the Custom Report Builder, customer cohort analysis, and detailed inventory analytics require upgrading to Advanced ($399/month) or Plus ($2,300+/month). The free analytics tier covers basic sales performance tracking but limits customization and cross-functional analysis.
❓ What is the difference between Shopify Analytics and Google Analytics?
Shopify Analytics tracks server-side commerce data: orders, revenue, products, and customer transactions. Google Analytics (GA4) tracks client-side behavioral data: sessions, page views, events, and user journeys. The two systems use different tracking methods, different attribution models, and different definitions of "conversion," which is why their numbers rarely match. Most founders need both, but neither provides cross-functional reasoning across marketing spend and financial outcomes.
❓ Can Shopify Analytics track marketing ROI?
Partially. Shopify reports sessions by traffic source and sales by traffic referrer, but it uses last-click attribution only. This means it over-credits direct and branded search while under-crediting upper-funnel channels like Meta, TikTok, and Google Display. Shopify cannot calculate true ROAS because it does not ingest ad spend data natively. You need to manually compare Shopify revenue against ad platform spend, or use a unified tool that reconciles both automatically.
❓ What reports are only available on Shopify Advanced and Plus?
The Custom Report Builder, customer cohort analysis, ShopifyQL Notebooks, ABC inventory analysis, and detailed inventory reports (days of inventory remaining, average inventory sold per day) are restricted to Advanced and Plus tiers. Basic and Shopify plan users are limited to pre-built report templates with no customization beyond date range selection.
❓ How do I export data from Shopify Analytics?
Navigate to any report in Analytics > Reports, set your desired date range and filters, then click the "Export" button in the top right corner. Shopify supports CSV export for all reports. There is no native option for scheduled or automated report delivery; every export must be triggered manually.
❓ Can Shopify Analytics calculate Customer Lifetime Value (LTV)?
Not directly. Shopify provides the raw data components (order history, purchase frequency, average order value) but does not calculate LTV as a native metric. Customer cohort analysis on Advanced+ plans shows revenue per cohort over time, which approximates LTV tracking. For precise LTV:CAC ratios, founders must blend Shopify data with ad platform spend data externally.
❓ What is the best alternative to Shopify Analytics for scaling brands?
For founders who have outgrown native Shopify reporting, the evaluation comes down to whether you need a better dashboard or a fundamentally different architecture. Tools like Triple Whale and Polar Analytics add visualization layers on top of existing data silos. Luca AI takes a different approach: unifying 20+ data sources into a conversational reasoning engine that connects marketing, finance, and operations in every answer. For detailed pricing and plan options, visit the Luca AI homepage.
❓ How often does Shopify Analytics update?
Most Shopify reports update in near real-time for order and revenue data, with a slight delay of a few minutes for processing. The Live View feature shows real-time visitor activity with no delay. However, some aggregated reports (like customer cohort analysis) update on a daily cycle, meaning morning data may not reflect the previous evening's activity until the following day.
FAQ's
What is the biggest limitation of Shopify Analytics Dashboard for scaling e-commerce brands?
Shopify Analytics Dashboard's fundamental limitation is commerce-layer isolation - it shows orders, products, and sessions brilliantly, but structurally cannot synthesize marketing spend, financial cash flow, operational costs, or cross-platform customer journeys. When you're managing €1M+ revenue across 5+ acquisition channels, this creates the "dashboard fragmentation wall": Shopify shows revenue, Meta Ads Manager shows spend, Xero tracks cash flow, and you become the manual integration layer spending 10-15 hours weekly triangulating insights that should be automatic.
The critical blindspot? Contribution margin visibility. Shopify displays gross sales (€100K/month) but can't show true profit after ad spend, COGS, fulfillment, returns, and processing fees - which could be €25K profit or -€8K loss. This is why unified AI intelligence synthesizes commerce + marketing + finance + operations into a single reasoning layer, answering cross-functional questions like "Which product-channel combo is most profitable after all costs?" in seconds, not 3-hour manual analysis across 6 platforms.
Why do Shopify Analytics and Meta Ads Manager show different revenue numbers for the same campaign?
The 10-20% data discrepancy between Shopify and Meta exists because they use fundamentally different attribution methodologies:
Meta's view (optimistic): 7-day click, 1-day view attribution window + probabilistic modeling to estimate iOS14-blocked conversions. Meta claims conversions up to 7 days after ad click and uses modeled data for the 50-65% of users who opted out of tracking.
Shopify's view (conservative): 30-day last-click attribution crediting only the final referrer + actual transaction recording (no modeling). Shows ground truth - cash in bank.
Why it matters: Making budget decisions on Meta's reported 4.2x ROAS when Shopify validates only 2.4x actual revenue = scaling based on inflated platform claims that destroy cash flow.
The fix: Accept 10-15% variance as structurally normal post-iOS14. Use Shopify as source of truth for financial decisions, ad platform data for creative optimization only. Or deploy cross-functional intelligence that reconciles multi-platform discrepancies with probabilistic attribution modeling - synthesizing Meta's optimistic view, Shopify's conservative view, and GA4's data-driven view into confidence-weighted ROAS reflecting real business health.
Which Shopify Analytics reports should I prioritize at different growth stages?
Stage 1: Launch/Validation (€0-€100K revenue) - Focus on validation signals, not optimization. Track: Total Sales, Order Count, Basic CVR (1-2% acceptable for cold traffic), AOV (establish baseline pricing), Traffic Sources (where first customers discover you), Top Products by Units Sold. Don't track yet: CLV (insufficient repeat data), Customer Cohorts (sample size too small), Complex Attribution (volume too low).
Stage 2: Growth/Efficiency (€100K-€2M) - Shift to efficiency metrics. Prioritize: Contribution Margin by Channel (which channels are actually profitable after ad spend + COGS?), Customer Acquisition Cost by Source, Returning Customer Rate (20-30% target), AOV Growth Trends, Product-Level Profitability.
Stage 3: Scale/Optimization (€2M-€20M) - Deploy predictive intelligence. Require: Cohort-Based LTV by Acquisition Source, Cash Conversion Cycle, Inventory Turnover by SKU, Predictive Stockout Modeling, Scenario Planning ("What if we scale Meta 3x?").
Critical insight: At Stage 3, native Shopify Analytics becomes structurally insufficient regardless of plan tier - cross-functional intelligence synthesizing commerce + marketing + finance + operations becomes non-negotiable for data-driven growth decisions.
Can Shopify Analytics calculate true Customer Lifetime Value (CLV) and contribution margin?
Short answer: No, not automatically. Shopify Analytics requires manual CLV calculation or custom report building (Advanced+ plan, €399/month) combining purchase frequency × AOV × customer lifespan over time windows. Even then, it shows commerce-layer CLV only - revenue per customer without subtracting acquisition costs, returns, or operational expenses.
What's missing:
True CLV requires: Revenue per customer - CAC - COGS - Fulfillment - Returns - Processing Fees = Actual Profit Per Customer over lifetime. Shopify can't access ad spend (Meta/Google), COGS (Xero), or banking data to perform this calculation.
Contribution margin visibility: Shopify displays gross sales but can't synthesize: €100K revenue - €28K ad spend - €75K COGS - €12K fulfillment - €8K returns - €3K processing = €24K net profit (16% margin vs. the 100% gross sales "vanity metric").
The workaround: Founders spend 10-15 hours weekly exporting Shopify CSVs, merging with Meta/Google spend data, importing COGS from accounting systems, building pivot tables for true profitability. Or deploy unified intelligence that automatically calculates contribution margin across all cost sources in real-time.
When should I graduate from Shopify Analytics to unified AI intelligence?
You've hit the "fragmentation wall" requiring unified intelligence when you exhibit 3+ of these signals:
✅ €1M+ revenue managing 5+ data sources (Shopify + multiple ad platforms + accounting + banking) ✅ Team spends 10+ hours weekly on reporting vs. insights - exporting CSVs, building pivot tables, reconciling discrepancies ✅ Cannot answer cross-functional questions quickly - "Which product-channel combo is most profitable after all costs?" requires opening 4+ tools ✅ Finance and marketing teams misaligned - working from different data sources creating strategic conflicts ✅ Identified growth opportunities but lack capital to scale without dilution or lengthy bank applications ✅ Making decisions on incomplete data - experienced regretful scaling/budget choices due to partial visibility
The tipping point: When manual reconciliation consuming 12-20 team hours weekly costs €31K-€39K annually in wasted labor (at €50/hour blended rate), while decision lag from incomplete data costs €15K-€40K monthly in missed opportunities or inefficient spend.
What changes:Unified AI intelligence collapses 5-platform workflows into single conversational layer - "Should I scale Campaign X accounting for inventory capacity and 90-day cash impact?" answered in 8 seconds with embedded capital access when AI identifies fundable opportunities.
Enjoyed the read? Join our team for a quick 15-minute chat — no pitch, just a real conversation on how we’re rethinking Ecommerce with AI - Luca
Loading Schedule...
Your AI Co-Founder is here.
Here’s why:
Shopify, Meta, Xero - one brain.
"Should I scale?" Answered with real data.
Growth capital. No applications. One click.
Thank you! Your submission has been received! Please book a time slot for the Meeting
Oops! Something went wrong while submitting the form.
.jpg)

.png)

