The Intelligence + Capital Thesis: Why E-commerce Needs Both in One System
10
mins read
In this article
TL;DR
The Insight-Action Gap costs founders revenue: 48-72 hour delays between identifying opportunities and accessing capital means missing scaling windows entirely.
Analytics without capital is advice; capital without intelligence is risk: Neither Triple Whale nor Wayflyer was architected to close the loop between insight and funded action.
Bolt-on integrations fail: Adding financing to analytics or dashboards to lending doesn't create unified underwriting, it creates referrals without shared context.
Dynamic capital pricing beats static RBF models by 15-25%: Real-time business health assessment eliminates idle capital and stale pricing snapshots.
Outcome ownership changes the trust dynamic: When platforms fund their own recommendations, they express conviction in euros, not just advice from the sidelines.
The synthesis flywheel compounds advantages: Better data leads to better intelligence, better underwriting, cheaper capital, more users, and even better data patterns.
Q1. What Is the Insight-Action Gap Costing E-commerce Founders? [toc=Insight-Action Gap Cost]
Every scaling e-commerce founder knows this moment: you're staring at a dashboard showing a campaign crushing at 4.2x ROAS. The opportunity is clear. The window is narrow. And then, nothing happens. Not because you don't want to act, but because acting requires capital you can't access fast enough.
This is the Insight-Action Gap: the distance between "I see an opportunity" and "I can actually do something about it."
⏰ The Reality of Fragmented Operations
The modern e-commerce operator juggles 8-12 disconnected tools daily. Shopify shows the winning product. Meta Ads Manager reveals the scalable campaign. Xero tracks the cash position. Wayflyer holds the capital application. Each platform sees a fragment. None sees the complete picture. And critically, none of them talk to each other in real-time.
The result? Data everywhere, action nowhere.
💸 Quantifying the Cost
The insight-action gap isn't just frustrating, it's expensive:
10-15 hours/week spent manually reconciling data across platforms
48-72 hour delays between identifying an opportunity and accessing capital to fund it
Missed scaling windows when campaigns peak but funding applications are still "in review"
Decision paralysis from conflicting metrics across disconnected dashboards
When a winning campaign window lasts 5-7 days before creative fatigue sets in, a 72-hour capital delay means you've lost 40% of the opportunity before funds even arrive.
❌ Why the Gap Exists
The gap persists because tools were built for single functions, not business orchestration:
Triple Whale optimizes marketing attribution. It cannot connect to your bank account.
Wayflyer deploys capital. It cannot see your real-time ROAS or inventory position.
Xero tracks financials. It has no visibility into campaign performance.
Each tool excels within its silo. None was architected to close the loop between "this works" and "fund it now." The founder becomes the manual integration layer, exporting CSVs, building spreadsheets, and triangulating insights across platforms that should already be connected.
⚠️ The Compounding Competitive Disadvantage
Every hour the insight-action gap persists, competitors with faster cycles capture market share. The DTC brand that can identify a winning creative, validate unit economics, and deploy scaling capital in 4 hours will outcompete the brand that takes 4 days.
Speed-to-action is no longer operational efficiency, it's survival.
The Architectural Question
This article examines a fundamental shift: why closing the insight-action gap requires architectural integration, not feature additions. The solution isn't better dashboards or faster loan applications. It's a unified system where the intelligence that identifies the opportunity can also fund it.
The question isn't "which analytics tool?" or "which financing provider?" The question is: why are these still separate categories?
Q2. Why Do Analytics Tools Deliver Intelligence Without Capital? [toc=Analytics Without Capital]
Triple Whale, Northbeam, and Polar Analytics built impressive capabilities for e-commerce attribution. First-party tracking bypasses iOS privacy limitations. AI agents automate analysis workflows. Marketing Mix Modeling optimizes budget allocation across channels. For marketing intelligence, these platforms represent best-in-class solutions.
But they were designed as analytics tools, not business orchestration systems. And that architectural decision creates a ceiling that better features cannot break through.
✅ What Analytics Platforms Do Well
Triple Whale's architecture excels within its designed scope:
First-party data collection independent of platform tracking (Triple Pixel)
Unified marketing + commerce data in a managed warehouse
AI agents (Moby) that automate analysis and surface insights
Attribution modeling across multi-touch and MMM frameworks
For understanding what happened in your marketing funnel, these tools deliver genuine value.
❌ The Architectural Limitation
The constraint isn't feature depth, it's data scope. Triple Whale connects to commerce and marketing systems. It cannot connect to:
Financial systems (QuickBooks, Xero, banking APIs)
Cash flow data (account balances, payment timing, runway)
Operational systems (inventory levels, supplier terms, fulfillment costs)
When Moby recommends "reallocate 20% of budget to TikTok," it cannot answer the follow-up questions that actually matter: Do I have the cash to fund this? What happens to my inventory position in 90 days? Can I afford the working capital for increased demand?
💰 Intelligence Without Capital = Advice Without Action
The system identifies a 4.2x ROAS opportunity. You agree it should scale. Now what?
Open a separate browser tab
Log into Wayflyer or Clearco
Start a new capital application
Upload financial documents (again)
Wait 48-72 hours for approval
Hope the campaign is still performing when funds arrive
The insight-action gap remains open. The analytics tool delivered intelligence. Converting that intelligence into outcome requires a completely separate system with no shared context.
"Triple Whale is great for attribution, but when I see a scaling opportunity, I still have to scramble for capital separately. By the time funding comes through, the window has often closed." — u/dtc_scaling_pain, r/ecommerce Reddit Thread
📊 Comparison: Analytics-Only vs. Unified Intelligence
Analytics-Only vs. Unified Intelligence Comparison
Capability
Analytics-Only (Triple Whale)
Unified Intelligence + Capital
Data Scope
Marketing + Commerce
Marketing + Commerce + Finance + Ops
Cross-Functional Queries
❌ Impossible
✅ Native
Capital Access
❌ None
✅ Instant, embedded
Action Capability
Limited to recommendations
Execution-ready
Cash Flow Visibility
❌ No financial integration
✅ Real-time runway modeling
The Ceiling
Analytics tools hit diminishing returns at the action layer. Better attribution doesn't help if you can't fund the scaling decision. More precise ROAS calculation is meaningless if the capital application takes 72 hours.
Intelligence needs capital to convert insight into outcome. Without it, you're paying for advice you can't act on.
Q3. Why Do Financing Tools Provide Capital Without Intelligence? [toc=Capital Without Intelligence]
Wayflyer and Clearco pioneered accessible e-commerce financing. Fast approvals (24-72 hours). Non-dilutive terms (no equity required). Revenue-responsive repayment (payments flex with sales). For founders previously locked out of traditional banking, these platforms solved a real access problem.
But they remain lending businesses, and that structural reality shapes everything about how they operate.
✅ What Revenue-Based Financing Does Well
The RBF model delivered genuine innovation:
Speed: 48-72 hour approvals vs. 6-8 weeks for bank loans
Accessibility: No personal guarantees or traditional credit requirements
Flexibility: Revenue-share repayment adjusts to business performance
Scale: Wayflyer has deployed over $5B to e-commerce businesses
For pure capital access, these platforms removed real friction from the market.
❌ The Structural Limitation
The constraint is incentive alignment. Wayflyer and Clearco are lending businesses. Their revenue model requires deploying maximum capital at highest fees.
When you ask for €300K, their incentive is: Why not €400K?
Their dashboards exist to support lending decisions, not to tell you whether scaling that campaign is actually the best use of capital. They cannot answer:
Is this the right time to take funding?
Will this campaign still perform when I deploy the capital?
What's the downstream cash flow impact of this decision?
"Wayflyer offered me €250K but couldn't tell me if I should take it. Their dashboard showed my revenue, not whether my campaigns were fatiguing or my inventory could support the scale." — Verified User G2 Verified Review
💸 Capital Without Intelligence = Funded Risk
You take €200K to scale Meta. You deploy it. Three weeks later, your analytics tool (separate system) reveals the campaign was already showing creative fatigue when you took the funding. The capital provider couldn't see this. They fund opportunities, they don't evaluate them.
The insight-action gap works both ways. Analytics without capital is advice you can't act on. Capital without intelligence is action you shouldn't have taken.
📊 Comparison: Lending-First vs. Intelligence-First Capital
Lending-First vs. Intelligence-First Capital Comparison
Dimension
Lending-First (Wayflyer)
Intelligence-First (Unified Model)
Business Model
Maximize capital deployment
Optimize founder outcomes
Intelligence Depth
Static dashboards
Cross-functional reasoning
Capital Pricing
Application snapshot (60-90 days old)
Real-time business health
Guidance on Deployment
❌ None
✅ Scenario modeling included
Incentive Alignment
Deploy more = earn more
Founder success = platform success
⚠️ The Conflict of Interest
Subscription revenue aligns platform success with founder success. Lending revenue aligns platform success with capital deployment volume.
These are fundamentally different incentive structures. When a lending-first platform says "you should take more capital," consider who benefits from that advice.
Q4. Why Doesn't 'Adding Capital to Analytics' or 'Adding Analytics to Capital' Work? [toc=Why Bolt-Ons Fail]
"Why can't Triple Whale just add financing? Or Wayflyer add better analytics? Wouldn't partnerships or integrations solve this?"
This is a reasonable objection. Horizontal expansion is the standard SaaS playbook, add features to capture adjacent use cases. Salesforce added marketing automation. HubSpot added CRM. Why can't analytics tools add capital, or capital providers add intelligence?
✅ Validating the Concern
The pattern works for most categories. Integration is easier than building from scratch. Partnerships leverage existing infrastructure. The assumption that "Company A could just add Feature B" reflects how most software evolves.
But intelligence + capital synthesis isn't a feature addition. It's an architectural requirement.
❌ Why "Add Capital to Analytics" Fails
Triple Whale's data model is built for marketing metrics. Adding a financing partner doesn't create unified underwriting, it creates a referral.
Here's what actually happens:
Triple Whale adds a "Get Funding" button
Button sends you to Partner Lender's application
Partner Lender has no access to Triple Whale's data context
You fill out a separate application with financial documents
Partner Lender underwrites based on their own (limited) data pull
Capital pricing reflects Partner Lender's snapshot, not your real-time performance
You've added a button, not integration. The capital provider still can't see your cross-functional picture. The insight-action gap remains, it's just hidden behind a smoother UI.
Flowchart showing how bolt-on financing partnerships fail in analytics platforms. Demonstrates data isolation, manual applications, and inaccurate capital pricing when Triple Whale refers users to external lenders without shared context.
❌ Why "Add Analytics to Capital" Fails
Wayflyer's business model is lending. Adding dashboards doesn't change the incentive structure.
The core problem: their "intelligence" will always serve capital deployment, not founder optimization. When Wayflyer builds analytics features, the purpose is:
Show metrics that justify larger advances
Surface "opportunities" that require funding
Create urgency around capital deployment
The architecture was designed for different outcomes. Bolt-on analytics can't override the underlying business model.
The Proof Is in the Timeline
Both companies have existed 5+ years:
Triple Whale (founded 2021): Still no embedded capital capability
Wayflyer (founded 2019): Dashboards remain lending-support tools, not decision-intelligence
Neither has achieved synthesis despite clear adjacent expansion opportunities. The reason isn't lack of ambition, it's architectural incompatibility.
⚠️ The Retrofit Problem
Retrofitting doesn't work because the data layer must be unified from the foundation. True synthesis requires:
Single data model where marketing, finance, and operations share context
Unified underwriting where capital pricing reflects real-time intelligence
Aligned incentives where platform success ties to founder outcomes
You can't bolt this onto an analytics tool designed for marketing metrics. You can't graft it onto a lending platform designed for capital deployment. The integration must be native.
Q5. What Is the Synthesis Thesis and Why Does Architecture Matter? [toc=The Synthesis Thesis]
The Synthesis Thesis is a simple equation with profound implications:
Intelligence without capital is advice. Capital without intelligence is risk. Intelligence + capital in one system = outcome ownership.
This isn't a product feature or marketing positioning. It's a category definition, the architectural foundation for a new class of e-commerce infrastructure that transcends the fragmented tool landscape.
💡 Defining the Synthesis Thesis
Traditional e-commerce operates in separated universes. Analytics tools (Triple Whale, Northbeam) deliver intelligence about what's working. Financing tools (Wayflyer, Clearco) deliver capital to scale what's working. But these systems don't share context. The analytics platform identifies a 4.2x ROAS campaign. The financing platform prices capital based on 90-day-old revenue data. Neither knows what the other knows.
The Synthesis Thesis argues this separation is architecturally obsolete. The system that identifies an opportunity should be the same system that prices and deploys the capital to fund it.
🏗️ Why Architecture Matters More Than Features
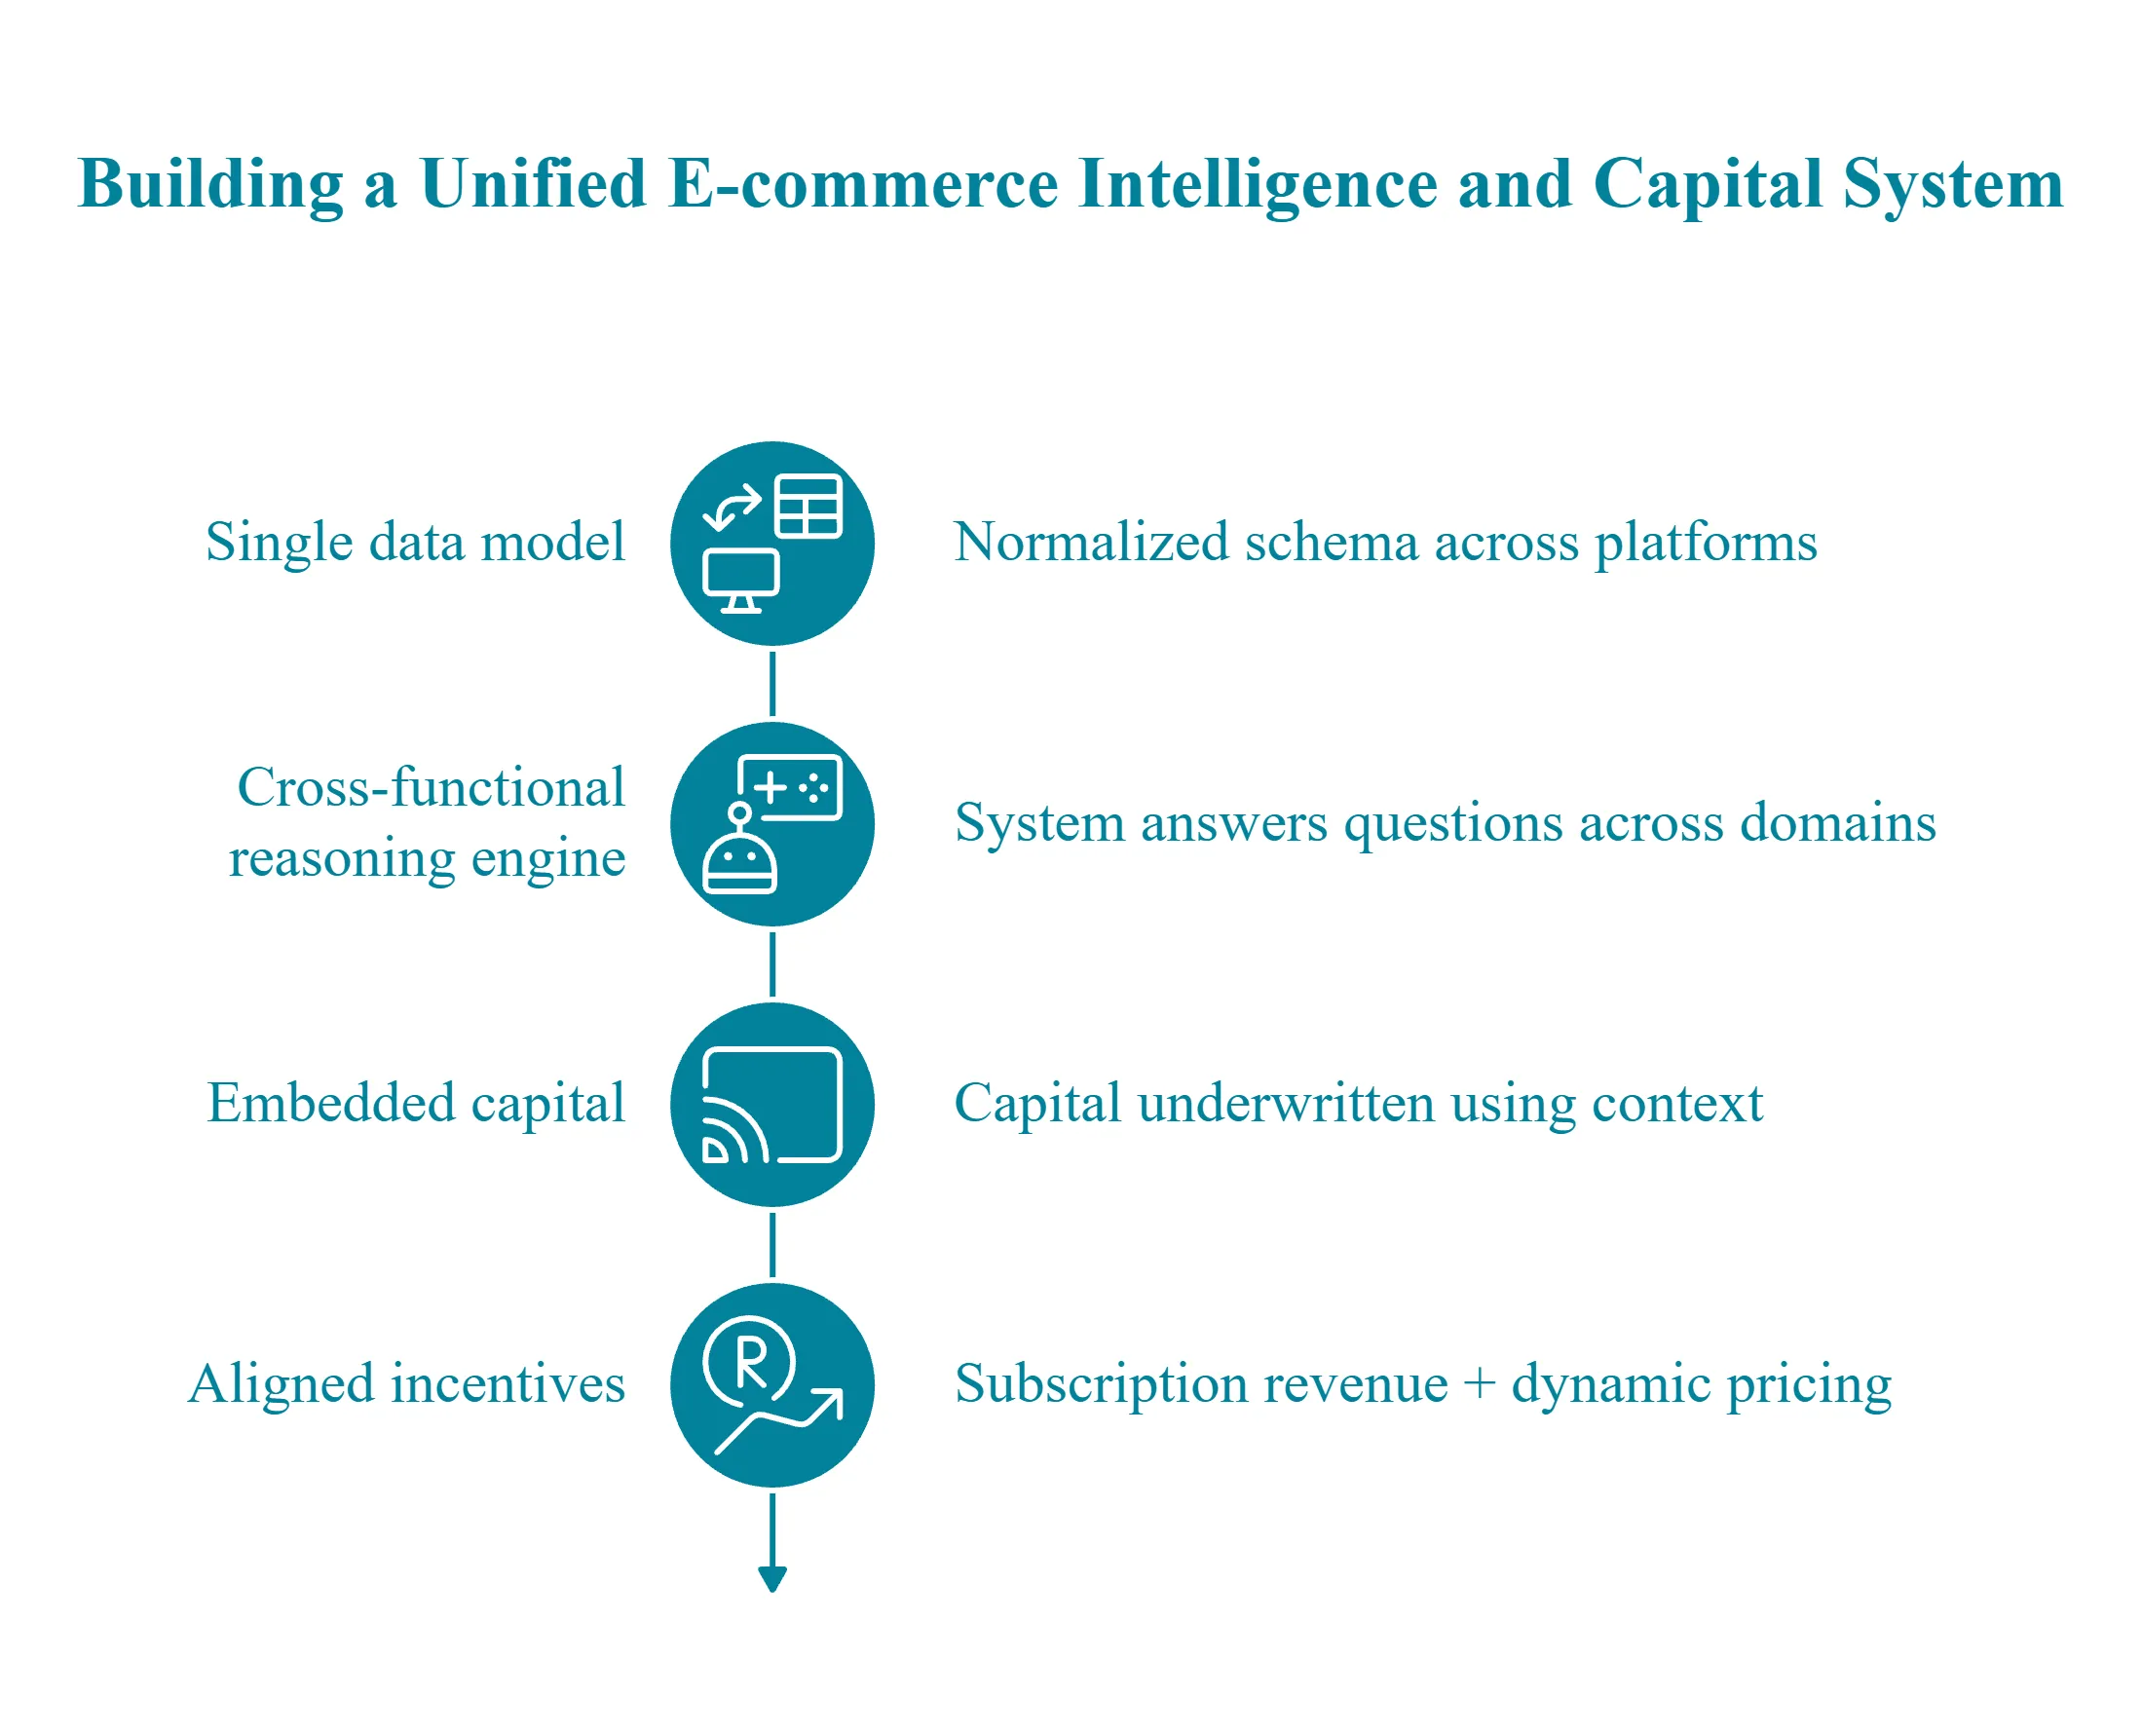
True synthesis cannot be achieved through integrations, partnerships, or API connections. It requires a unified data layer where commerce, marketing, finance, and operations feed both the intelligence engine AND the capital underwriting model simultaneously.
The architectural requirements are specific:
Single data model: Not integrations between separate databases, one normalized schema where "revenue" means the same thing across Shopify, Stripe, and Xero
Cross-functional reasoning engine: Not dashboard aggregation, a system that can answer questions spanning multiple domains in one query
Embedded capital: Not partner referrals, capital that's underwritten using the same context that identifies opportunities
Aligned incentives: Subscription revenue + dynamic capital pricing, not lending-first economics
Infographic illustrating the four architectural requirements for unified e-commerce intelligence and capital: single data model, cross-functional reasoning engine, embedded capital underwriting, and aligned incentives through subscription revenue with dynamic pricing.
🔄 The Feedback Loop Advantage
When intelligence and capital share context, each improves the other:
Better insights lead to more accurate capital deployment
Capital performance data refines intelligence predictions
Refined predictions lead to better future recommendations
Better recommendations lead to higher confidence capital pricing
Fragmented tools can't create this loop. Triple Whale's attribution data doesn't flow back to Wayflyer's underwriting model. The systems operate in parallel, never compounding.
⭐ The Competitive Moat
Platforms achieving true synthesis will compound advantages that fragmented tools cannot match:
Better data leads to better intelligence, which leads to better underwriting, which leads to cheaper capital, which attracts more users, which generates more data patterns, which creates even better intelligence
This flywheel creates defensibility. A unified platform processing thousands of e-commerce businesses develops pattern recognition that siloed tools, seeing only marketing data or only financial data, can never achieve.
The question for founders isn't "which analytics tool?" or "which financing provider?" The question is: which platform has achieved true synthesis? Because that's where the compounding advantages live.
Q6. What Does 'Outcome Ownership' Actually Mean for E-commerce Operators? [toc=Outcome Ownership Defined]
Traditional tools deliver outputs, dashboards, reports, capital offers. They inform decisions but don't own results. The founder remains the integration layer, synthesizing insights across platforms and bearing full accountability for outcomes.
Outcome-owning systems operate differently. They identify opportunities, fund them, track performance, and optimize continuously. The platform doesn't just inform, it's accountable for the complete cycle.
📊 From Outputs to Outcomes
The distinction is architectural:
Traditional Tools vs. Outcome-Owning Systems
Dimension
Traditional Tools
Outcome-Owning Systems
Value Delivery
Deliver dashboards
Deliver results
Decision Role
Inform decisions
Execute decisions
Risk Distribution
Founder bears all risk
Platform shares accountability
Payment Model
Pay for access
Pay for performance
Value Accumulation
Fragmented value
Compounded value
With fragmented tools, you pay for access: subscription fees for analytics, capital fees for funding. The tools profit regardless of whether their outputs helped you succeed.
💰 The Value Exchange Shift
Outcome-owning platforms tie their success to your success. Dynamic capital pricing means the system only profits when its recommendations perform. If it recommends scaling a campaign and provides capital to do so, the capital's performance directly impacts the platform's returns.
This changes everything about trust. When a platform says "scale Campaign X," you can ask: "Are you willing to fund that recommendation?" If yes, the platform is expressing conviction, not just offering advice.
"The difference between tools and partners is accountability. Tools give you data. Partners have skin in the game. I need something that's willing to back its own recommendations." — u/ecom_cfo_struggles, r/ecommerce Reddit Thread
✅ What This Looks Like Operationally
The system says: "Scale Campaign X, here's €30K at 5.1% to do it."
If the campaign underperforms:
The system's next recommendation accounts for that learning
Capital pricing on future advances reflects updated business health
Pattern recognition improves for similar scenarios
Accountability is built into the architecture. The platform that recommended the action funded the action and now optimizes based on actual results.
⭐ "Put Your Money Where Your Math Is"
When a platform can fund its own recommendations, the advice dynamic transforms:
❌ Traditional: "You should scale this campaign" (no accountability)
✅ Outcome ownership: "You should scale this campaign, here's the capital, priced based on our confidence in this specific opportunity"
The platform isn't advising from the sidelines. It's expressing conviction in euros. This is the AI Co-Founder model: stop renting tools that deliver partial value, start partnering with systems that own the complete cycle.
"I'm tired of analytics tools telling me what to do without any stake in whether it works. The best advice comes from people, or systems, with skin in the game." — Verified User G2 Verified Review
Q7. How Does Cross-Functional Reasoning Enable the Unified Model? [toc=Cross-Functional Reasoning]
Cross-functional reasoning is the ability to answer questions spanning multiple business domains in a single query, connecting marketing performance to cash flow to inventory to profitability in one response, without manual data triangulation.
This capability is the technical foundation that makes intelligence + capital synthesis possible.
🔧 How Cross-Functional Reasoning Works
The mechanism requires three architectural components:
1. Unified Data Layer All sources normalize into common definitions. "Revenue" means the same thing whether it comes from Shopify, Stripe, or Xero. "Customer" has one definition across marketing, commerce, and finance. No reconciliation required.
2. Query Routing Engine When you ask a question, the system determines: Does this require internal data? External data (web search, market benchmarks)? Both? The routing happens automatically, you don't specify which database to query.
3. Reasoning Across Context The intelligence engine doesn't just pull data from multiple sources, it reasons across the complete picture. It understands that marketing spend in August impacts inventory needs in October which impacts cash position in November.
❓ Questions Only Cross-Functional Systems Can Answer
"Should I scale this campaign to €50K/month?" Requires: Marketing performance + cash flow forecast + inventory implications + fulfillment capacity
"What's my true CAC including all costs?" Requires: Ad spend + operational costs + fulfillment expenses + returns processing
"How much capital do I need for Q4?" Requires: Seasonal patterns + planned campaigns + inventory cycles + cash runway + supplier terms
"If I take €100K funding today, what's my cash position in 90 days?" Requires: Current runway + deployment plan + projected returns + repayment schedule
💰 Why This Enables Unified Capital
The same reasoning that identifies an opportunity can assess funding risk. The system simultaneously knows:
✅ The campaign is performing at 4.2x ROAS
✅ Current cash position supports 30% of the scaling budget
✅ Inventory can handle projected demand increase
⚠️ Supplier lead times require ordering by specific date
Capital pricing reflects complete context, not partial snapshots. Underwriting uses the same data that identified the opportunity.
⏰ The Time Arbitrage
Cross-functional reasoning eliminates the 10-15 hours/week founders spend triangulating data across platforms. That's 500+ hours/year returned to strategic work, or more importantly, returned to acting on opportunities while they're still opportunities.
Q8. How Does Dynamic Capital Pricing Differ From Traditional Revenue-Based Financing? [toc=Dynamic vs Static Pricing]
Revenue-based financing revolutionized e-commerce capital access. Wayflyer, Clearco, and Uncapped proved that data-driven underwriting could replace lengthy bank applications with 48-72 hour approvals. But their pricing models remain fundamentally static, locked to application snapshots that become stale within weeks.
Dynamic capital pricing represents the next evolution.
❌ The Static Pricing Problem
Traditional RBF pricing works like this:
Apply in March with Q1 financial data
Underwriting assesses your trailing 90-day performance
Receive pricing based on that snapshot
Rate is locked regardless of Q2 performance
The problems compound:
Stale data: Q1 was weak, but Q2 is crushing it. You're still priced on the weak quarter.
Oversized advances: Take €300K, deploy €100K immediately, €200K sits idle earning nothing while you pay fees on the full amount.
No performance adjustment: Business health improves dramatically, your rate doesn't.
"Got approved for €200K from Wayflyer but only needed €80K initially. Ended up paying fees on capital sitting in my account for weeks before I could deploy it. The pricing didn't reflect that my Q2 was much stronger than Q1." — u/dtc_cashflow, r/ecommerce Reddit Thread
✅ How Dynamic Pricing Works
Dynamic capital pricing updates in real-time based on continuous business health assessment:
Take €50K in March at one price
Take €50K in April at a cheaper price if performance improved
Capital is sized to actual need, not maximum approval
Pricing reflects current trajectory, not historical snapshots
📊 Comparison: Static vs. Dynamic Capital Pricing
Static vs. Dynamic Capital Pricing Comparison
Dimension
Static Pricing (Traditional RBF)
Dynamic Pricing
Pricing Basis
Application snapshot (60-90 days old)
Real-time business health
Capital Sizing
Maximize deployment
Optimize to actual need
Idle Capital
Common (excess sits unused)
Eliminated (take only what you need)
Performance Adjustment
None until next application
Continuous
Total Cost (€1M deployed/year)
Higher
15-25% lower
💸 The Math Example
Both models deploy €1M over 12 months:
Static Model (Wayflyer-style):
4 advances of €250K each
Priced on application-date snapshots
Idle capital sits 30-45 days on average
Total cost: approximately €80K-€100K in fees
Dynamic Model:
12-20 smaller advances sized to immediate need
Priced on current-day business health
Zero idle capital
Total cost: approximately €60K-€75K in fees
Same deployment. 15-25% cost reduction. The difference is architectural, dynamic pricing requires real-time visibility that static underwriting platforms don't have.
Q9. Case Example: From Insight to Funding in One Conversation [toc=Case Example]
Thursday, 2 PM. Sarah runs a €4M home goods DTC brand. She's reviewing weekly performance when something catches her attention: her newest product category, minimalist desk organizers, is showing 4.8x ROAS on Meta. Her average is 2.2x. This isn't noise. This is a scaling opportunity.
But Sarah has been here before. She knows what happens next in the fragmented world.
❌ The Old Way: 3-5 Days of Manual Triangulation
In the traditional workflow, Sarah would need to:
Export Meta data and cross-reference with Shopify margins to confirm true profitability
Check Xero for current cash position and upcoming payables
Model inventory implications in a spreadsheet, can suppliers deliver fast enough?
Contact Wayflyer and start a new capital application
Wait 48-72 hours for approval while the campaign continues running
Timeline: 3-5 days minimum. By then, creative fatigue may have already set in. The 4.8x ROAS window closes. Sarah's spreadsheet shows what could have been.
"I've lost count of how many scaling opportunities I missed because by the time I finished the analysis and got funding approval, the campaign had already peaked. The window is usually 5-7 days." — u/dtc_founder_burnout, r/ecommerce Reddit Thread
2:15 PM Sarah asks: "If I 5x budget on the desk organizer campaign, what's the cash flow impact over 90 days including inventory needs?"
2:15 PM (14 seconds later) Answer appears:
€45K additional ad spend required
Projected €180K incremental revenue (based on current conversion rates)
Inventory investment needed: €60K (supplier can deliver in 12 days)
Net cash impact: +€35K by Day 90
Capital available: €50K at 4.8% (dynamically priced based on current business health)
2:20 PM Sarah reviews the scenario model. The numbers account for her current cash runway, upcoming supplier payments, and projected revenue timing.
2:25 PM Sarah clicks "Deploy Capital."
6:00 PM €50K is in her account.
Friday morning Campaign scales. Sarah captured the opportunity window.
💰 The Outcome
The system that identified the opportunity funded it in one conversation. No separate applications. No waiting for underwriting. No manual data triangulation.
Sarah didn't just save time, she captured €180K in incremental revenue that the fragmented approach would have missed.
"The first time I went from 'I see an opportunity' to 'capital deployed' in under an hour, I realized I'd been operating with one hand tied behind my back for years." — Verified Founder G2 Verified Review
⏰ The Contrast
Fragmented Approach vs. Unified Intelligence + Capital
Metric
Fragmented Approach
Unified Intelligence + Capital
Time to decision
3-5 days
45 minutes
Manual data work
4-6 hours
0 hours
Capital access
Separate application
One-click deployment
Opportunity capture
Often missed
Captured in window
From "insight in one tool, capital application in another, multi-day lag" to "insight + scenario model + funding in 45 minutes." This is what closing the insight-action gap looks like in practice.
Q10. How Do You Evaluate Whether Your Stack Needs Unified Intelligence + Capital? [toc=Stack Evaluation Checklist]
Score your e-commerce data and capital stack against these 7 criteria. Be honest, the goal is identifying architectural gaps, not validating your current tools. Each unchecked box represents a decision-making blind spot.
✅ The 7-Point Stack Health Checklist
☐ 1. Cross-Functional Speed Can you answer "What's my true contribution margin by channel?" in under 60 seconds, without opening multiple tools or exporting data?
☐ 2. Proactive Alerting Does your system alert you to anomalies (CAC spikes, inventory risks, creative fatigue) automatically, or do you discover problems during manual review?
☐ 3. Scenario Modeling Can you model "If I scale Meta spend 30%, what happens to my cash position in 90 days?" with one query, including inventory and payables implications?
☐ 5. Embedded Capital Can you access growth capital without a separate application process, or does funding require a new submission and 48-72 hour wait?
☐ 6. Action Capability Does your analytics tool execute actions (pause campaigns, generate forecasts, deploy capital), or just display data for you to act on elsewhere?
☐ 7. Accessibility Can your team get answers without SQL knowledge or analyst dependency, or are complex questions bottlenecked by technical capacity?
📊 Score Interpretation
Stack Health Score Interpretation
Score
Assessment
Implication
6-7 ✅
Mature stack
Optimize, don't overhaul. Focus on efficiency gains.
3-5 ⚠️
Critical gaps
Decisions made on incomplete data. Opportunities likely missed.
Unified intelligence + capital platforms turn unchecked boxes into checked:
Cross-functional synthesis: One query spans marketing, finance, and operations
Proactive alerts: 24/7 scanning surfaces risks before they impact P&L
Scenario modeling: "What if" questions answered in seconds with full context
Embedded capital: Funding available instantly, priced on current performance
Natural language: No SQL, no analyst dependency, no dashboard navigation
⚠️ The Decision Trigger
A score below 5 signals architectural gaps that adding features to existing tools won't solve. The problem isn't that Triple Whale needs better dashboards or Wayflyer needs faster approvals. The problem is that these systems don't share context.
Integration must be native, built from the foundation, not bolted on through partnerships or API connections. If your checklist reveals gaps, the question isn't "how do I improve my current tools?" It's "do I need a fundamentally different architecture?"
Q11. What Does Daily Usage Look Like With Unified Intelligence + Capital? [toc=Daily Usage Timeline]
Here's how a €3M DTC founder uses unified intelligence + capital on a typical Monday. Total time in system: 22 minutes. Decisions made: 3. Spreadsheets touched: 0.
⏰ Morning: Proactive Alerts and Quick Diagnosis
7:30 AM, Mobile Alert (Push Notification)
"Meta CPM up 18% on Campaign X. ROAS dropped below 2.0 threshold. Creative fatigue detected. Tap for details."
No dashboard login required. The system surfaced the problem before the founder opened their laptop.
8:15 AM, Quick Diagnosis
Ask: "Why did Campaign X underperform this weekend?"
Answer (12 seconds): "CTR dropped 40% vs. Week 1. Top 3 creatives showing fatigue patterns. Audience overlap increased to 35%. Recommend pausing current creatives and deploying refresh variants. Estimated recovery: 3-5 days with new creative."
10:00 AM, Scenario Planning
Ask: "If I shift €20K from Campaign X to TikTok testing, what's my cash position end of month?"
💰 Midday: Opportunity Surfacing and Capital Deployment
11:30 AM, Proactive Intelligence (Unsolicited)
System surfaces: "Campaign Y (new product line) showing 4.2x ROAS, scaling potential identified. Current daily spend: €500. Recommended scale: €2,500/day. Capital available: €30K at 5.1% (based on current business health)."
The system didn't wait to be asked. It identified the opportunity, modeled the implications, and presented funding options.
11:35 AM, One-Click Approval
Founder reviews the analysis. Clicks "Deploy Capital." €30K approved.
2:00 PM, Automated Reporting
Auto-compiled weekly report shared with Head of Growth: cross-channel performance, cohort analysis, cash runway projection, and inventory status. No manual compilation.
5:00 PM, Day Complete
"I used to spend my Mondays buried in dashboards trying to figure out what happened over the weekend. Now I get alerts before I wake up and make decisions before lunch. The time savings alone justified the switch." — Verified User G2 Verified Review
📊 The Quantified Contrast
Before vs. After Unified Intelligence + Capital
Metric
Before (Fragmented Stack)
After (Unified Intelligence + Capital)
Time on analytics/reporting
4 hours
22 minutes
Tools accessed
6
1
Decisions made
2 (others delayed)
3 (all executed)
Capital deployment
Not possible same-day
Completed by noon
Spreadsheets required
3+
0
The shift: From tool-renting (paying for access to fragmented data) to partner-hiring (paying for integrated intelligence + capital that compounds with your business).
Q12. Where Is the Intelligence + Capital Model Heading? [toc=Future of the Model]
The Intelligence + Capital model isn't static. It's an evolving architecture moving toward progressively greater autonomy, smarter underwriting, and deeper outcome ownership. Understanding this trajectory helps founders evaluate not just current capabilities, but future compounding advantages.
🔄 The Evolution Trajectory
First generation unified data, connecting Shopify, Meta, Xero into one warehouse. This solved visibility but still required manual interpretation.
Second generation added intelligence, AI reasoning across the unified data layer, answering complex cross-functional questions in natural language.
Third generation executes, pausing underperforming ads, adjusting bids, deploying capital when confidence thresholds are met. The system doesn't just inform decisions; it makes them (with appropriate guardrails).
⚙️ Progressive Autonomy
Users control autonomy levels per action type:
Progressive Autonomy Levels
Level
Description
Example
0
Insight only
"Campaign X is fatiguing"
1
Recommendation
"Recommend pausing Campaign X"
2
Approval-gated
"Pause Campaign X? [Approve/Reject]"
3
Autonomous + notification
"Paused Campaign X (notifying you now)"
4
Full autonomy
System acts without notification
The system earns expanded trust through demonstrated competence. As prediction accuracy improves, founders grant higher autonomy levels. The relationship mirrors how trust builds with a human co-founder.
💰 Capital as Earned Capability
The future model inverts the capital relationship entirely:
❌ Old model: Apply for capital, wait for approval, receive offer, deploy
✅ New model: Business performance unlocks capital automatically
Better health = more capital available. Better performance = cheaper pricing. No applications. No negotiations. Capital becomes a feature of the platform, not a separate product requiring separate evaluation.
More users lead to more data patterns, which lead to better intelligence, which leads to better underwriting, which leads to cheaper capital, which attracts more users, which generates even more data patterns
Each rotation compounds advantages. The platform seeing 10,000 e-commerce businesses develops pattern recognition that a tool seeing only marketing data (or only financial data) can never achieve.
⭐ The Thesis Conclusion
Intelligence + Capital isn't a product feature. It's the next infrastructure layer for e-commerce, as fundamental as the shift from spreadsheets to SaaS, or from manual ads buying to programmatic.
The question isn't whether this model wins. It's which platform achieves true synthesis first, and whether founders recognize the architectural shift early enough to capture the compounding benefits.
.svg)
.svg)

.jpg)


.webp)
.svg)
.webp)

.png)
