Shopify Analytics: The Complete 2026 Guide to Understanding Your Store Data
12
mins read
In this article
TL;DR
Shopify Analytics provides server-side revenue tracking (99%+ accuracy) across five report categories: Sales, Customers, Marketing, Finance, and Behavior dashboards.
Native analytics has four architectural blind spots: no automatic profit calculation, last-touch attribution only, backward-looking reports, and siloed from financial platforms.
Scaling brands (€1M+ revenue) face 10-15 hours weekly manual work correlating Shopify data with Meta/Google ad spend and accounting systems for true profitability.
Seven common interpretation mistakes (ignoring discounts, timezone mismatches, treating sessions as visitors) cost brands €23K-€65K annually in suboptimal decisions.
We built Luca AI to eliminate analytics fragmentation - automatically calculating contribution margin, multi-touch attribution, predictive modeling, and offering instant capital for identified opportunities.
Q1. What Is Shopify Analytics and How Does the Dashboard Work? [toc=Shopify Analytics Dashboard]
Shopify Analytics is the built-in data intelligence suite embedded directly into every Shopify store's admin panel. Whether you're on the Basic plan or Shopify Plus, you get access to a centralized hub designed to track store performance, customer behavior, and sales trends - no third-party installation required.
The platform is organized around three core components, each serving a distinct function in your analytics workflow:
Overview Dashboard - A customizable snapshot displaying your store's vital signs: Total Sales, Online Store Sessions, Conversion Rate, Average Order Value (AOV), Returning Customer Rate, and Total Orders
Live View - A real-time geographic map showing active visitors, open carts, and recent orders as they happen
How the Overview Dashboard Works in Practice
The Overview Dashboard functions as your daily pulse check. When you navigate to Analytics > Dashboard in Shopify Admin, you see key metric cards with sparkline trend lines and percentage-change indicators comparing your selected date range to a prior period (e.g., "Last 30 days vs. Previous 30 days").
With the Shopify Editions Winter 2025 updates, the dashboard became significantly more flexible. Merchants can now customize analytics using the metrics and dimensions they choose, with more personalized reporting rolling out across all plans. Shopify also added bundle performance metrics to the new analytics and made the admin 25% faster on initial page load. ShopifyQL now allows direct, real-time querying from within any report - a meaningful upgrade for data-fluent operators.
Live View: Real-Time Monitoring
Live View is most valuable during high-traffic moments - product launches, flash sales, or Black Friday - where you need instant visibility into traffic surges and active cart behavior. It displays a geographic visitor map, current visitors by page, and recent order activity in real time.
⚠️ However, Live View has notable limitations: it offers no historical data storage, no conversion attribution, and no ability to segment or filter the real-time feed. It's a monitoring tool, not an analysis tool.
Common Dashboard Mistakes to Avoid
Even experienced merchants misuse the dashboard in ways that quietly distort their data perspective:
Using the "Today" view for decisions - Data is incomplete until the day ends; partial-day metrics look artificially low
Forgetting timezone settings - A misaligned timezone creates discrepancies with ad platforms and payment processors
Not comparing to previous periods - Absolute numbers without context are meaningless; always benchmark against a comparison window
Where Shopify Analytics Stops and Cross-Functional Intelligence Begins
Shopify Analytics provides a strong foundation for understanding your commerce data. But as revenue scales past €1M, founders consistently discover the same gap: the dashboard shows what happened inside Shopify, but can't connect that data to marketing spend, cash flow, or inventory positioning. This is exactly why e-commerce founders are drowning in data without getting actionable answers.
Luca AI extends native Shopify data by unifying it with Meta Ads, Google Ads, Stripe, Xero, and 20+ additional sources into one conversational intelligence layer - replacing dashboard navigation with plain-language questions like "What's my true contribution margin by channel this month?" This is the core of the AI Co-Founder for e-commerce approach.
Q2. What Reports Are Available in Shopify Analytics (and Which Plan Do You Need)? [toc=Reports and Plan Requirements]
Shopify organizes its reporting into 10+ distinct categories, each designed to answer specific operational questions about your store. Understanding what's available - and what's locked behind higher plan tiers - is critical for knowing whether your current setup can support data-driven decision-making at your growth stage.
The Complete Shopify Report Categories
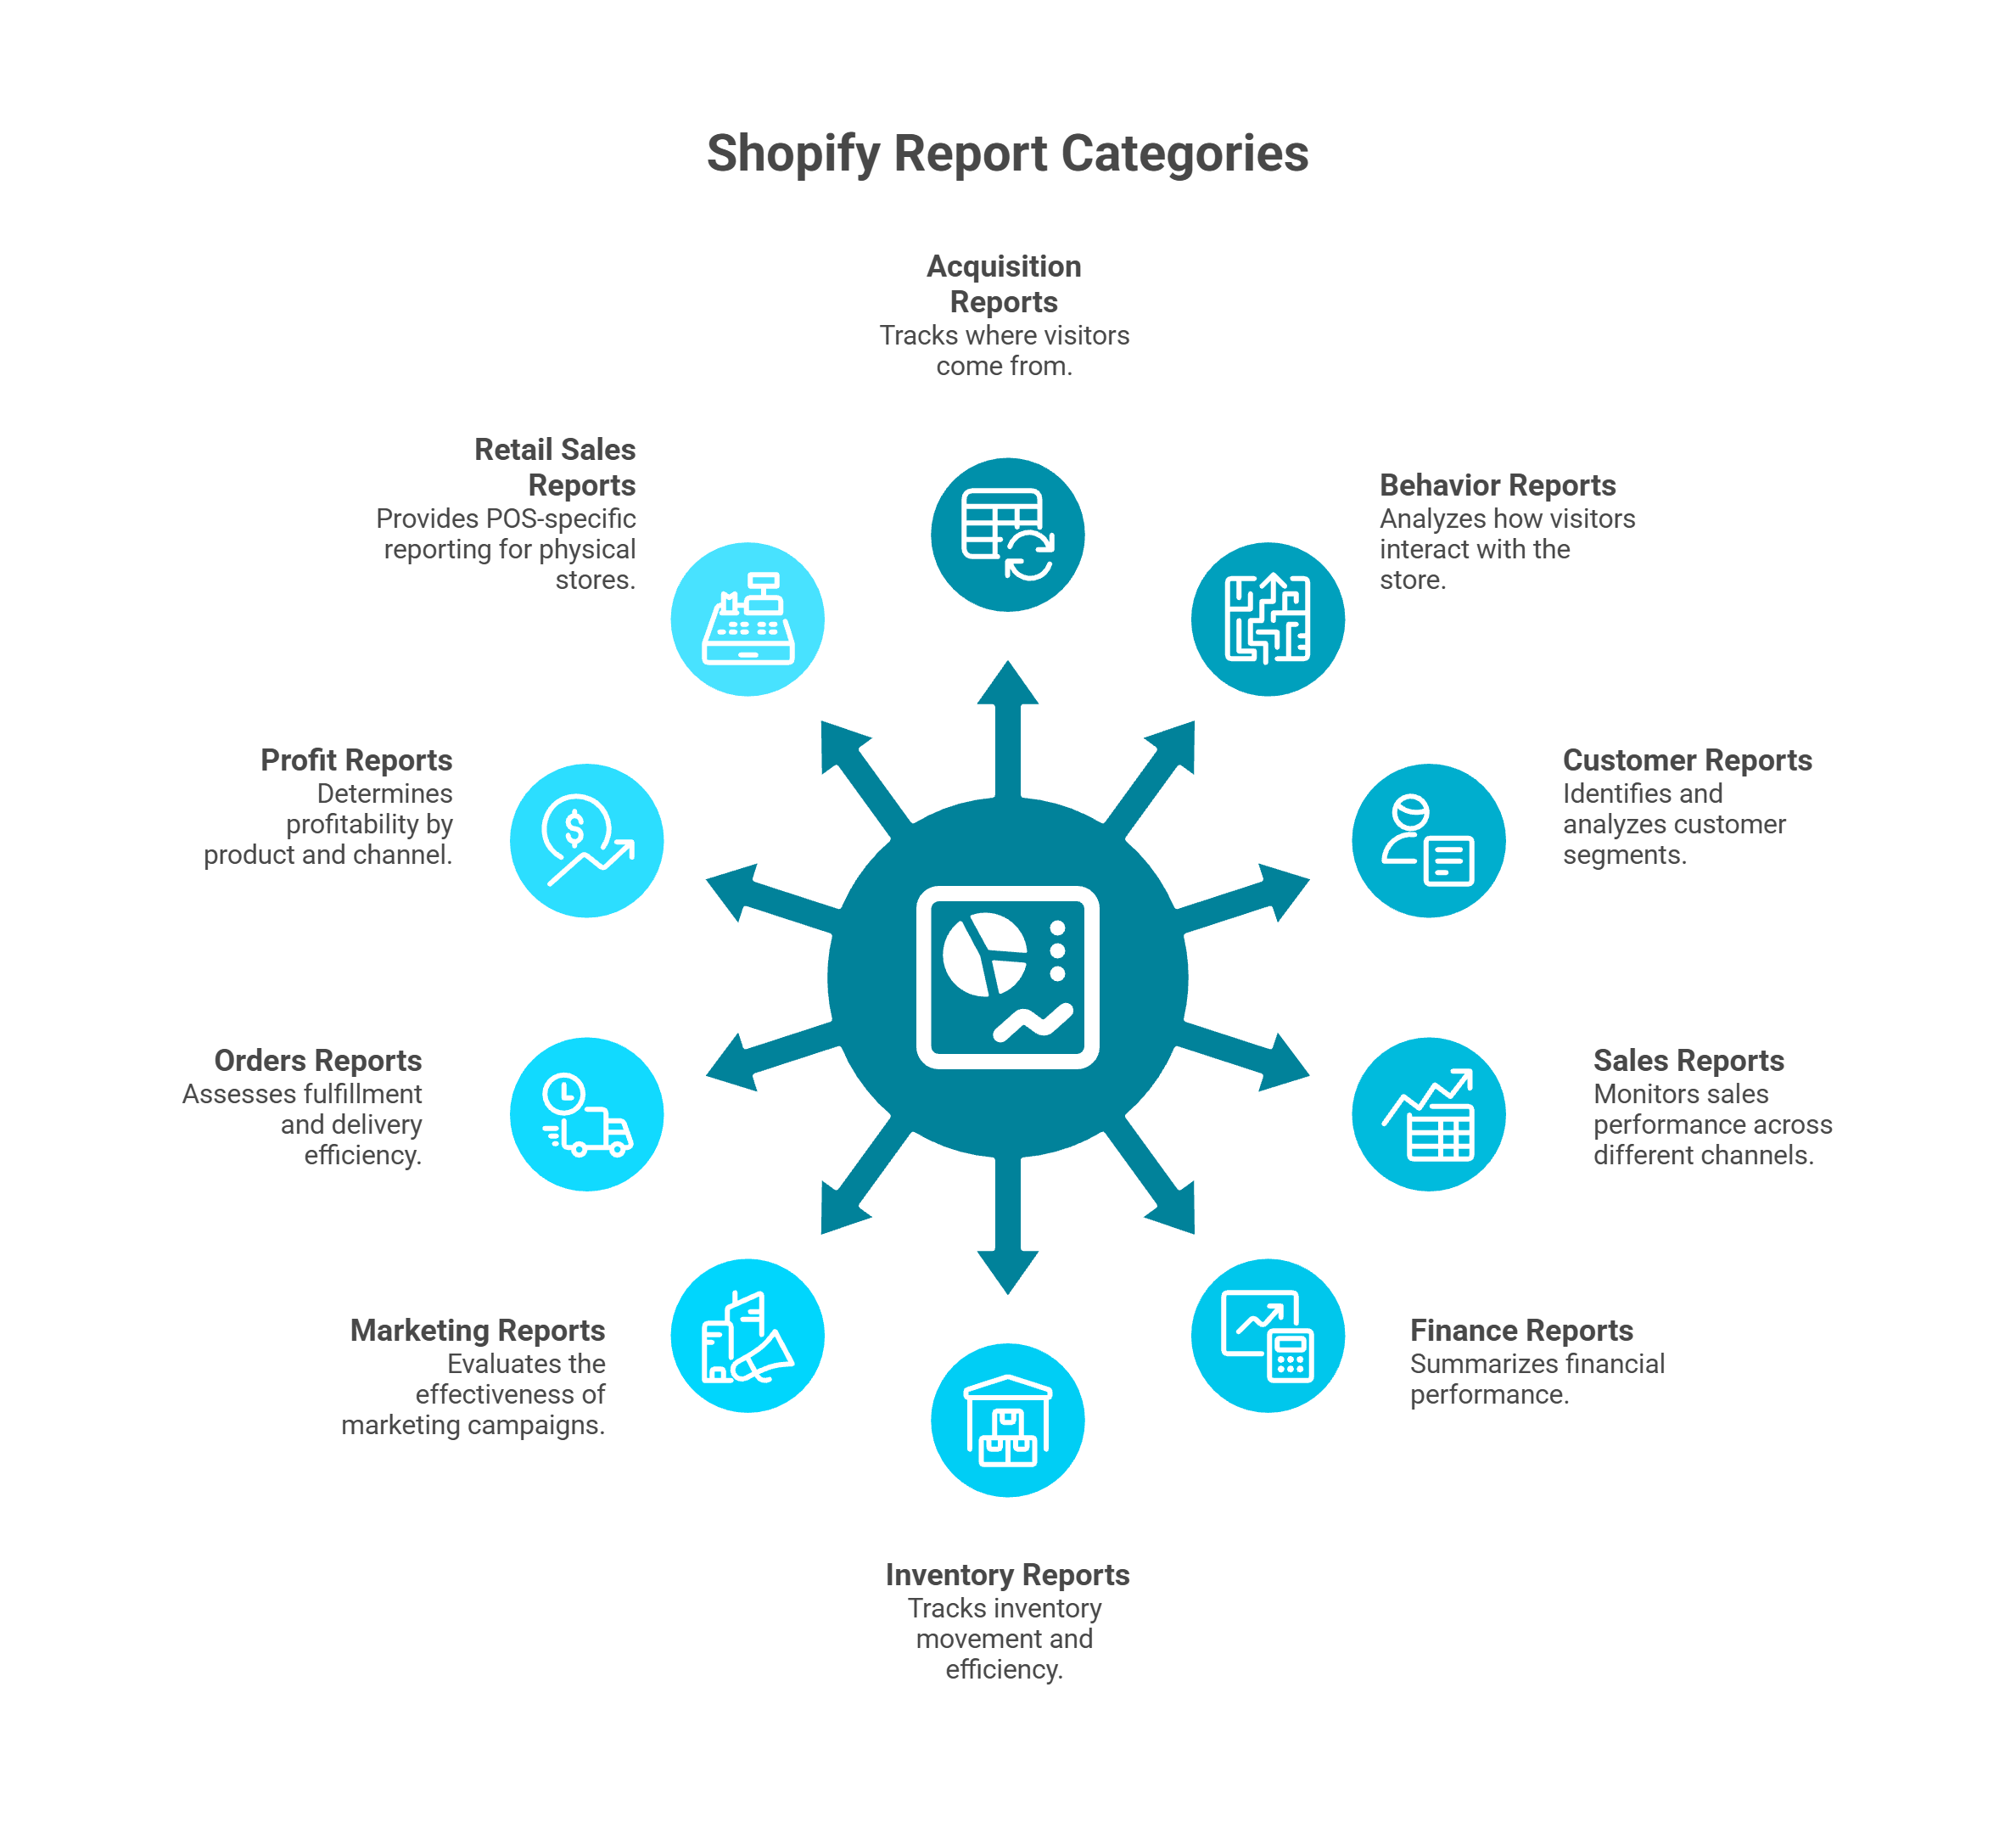
Hub-and-spoke diagram showing all ten Shopify store analytics report categories, from acquisition and behavior reports to profit, marketing, inventory, and retail sales reporting capabilities.
Acquisition Reports - Sessions by referrer, source/medium, and landing page. Answers: Where are my visitors coming from?
Behavior Reports - Online store conversion funnel, top landing pages, top exit pages, top product searches. Answers: How are visitors interacting with my store?
Customer Reports - New vs. returning customers, predicted spend tiers, at-risk customers, customer cohort analysis. Answers: Who are my best customers and who's about to churn?
Sales Reports - Sales over time, by product, by channel, by discount code, by billing city/region. Answers: What's driving my revenue? Explore how to get deeper into sales performance analysis.
Finance Reports - Gross sales, net sales, taxes, payments by provider, gift card balances. Answers: What's my financial summary?
Inventory Reports - Month-end inventory snapshot, average inventory sold per day, sell-through rate, ABC analysis. Answers: How fast is my inventory moving?
Marketing Reports - Sessions attributed to marketing campaigns, UTM-tagged traffic breakdown. Answers: Which marketing efforts are working?
Orders Reports - Fulfillment times, shipping times, delivery times, returns and refunds. Answers: How efficient is my fulfillment?
Profit Reports - Gross profit by product, by SKU, by channel. Answers: What's actually profitable after COGS?
Retail Sales Reports - POS-specific reporting for physical retail locations
Plan-Based Report Availability
Not all reports are available on every plan. This is where many merchants hit an unexpected wall:
The jump from Basic to Shopify plan is where most merchants feel the gating most acutely. On Basic, you're restricted to pre-built reports with limited filters - you can see sales by product, but you can't build a custom view combining product performance with discount impact or customer segment.
ShopifyQL Notebooks: Power for the Technical
Available exclusively on Shopify Plus ($2,300+/mo), ShopifyQL Notebooks enable SQL-like querying directly against your Shopify data. The Winter 2025 Editions update made ShopifyQL accessible from within any report view, allowing real-time data querying for more dynamic and customizable reporting.
The limitation: ShopifyQL requires technical skill. Non-technical founders and Heads of Growth - the people who most need cross-functional answers - typically can't use it without analyst support.
How Luca AI Removes Plan-Based Gating
Luca AI connects directly to Shopify's data layer via API and works with any Shopify plan. More importantly, it enriches your Shopify reports with dimensions Shopify can never include - regardless of plan tier: marketing spend by channel, COGS from Xero or QuickBooks, cash flow from banking integrations, and ad platform performance from Meta and Google Ads. This is what full financial management visibility looks like. Ask "Show me profit margin by product and channel, including ad spend" and get an answer in seconds - no plan upgrade, no ShopifyQL, no analyst required.
Q3. Which Shopify Metrics Should You Track at Each Growth Stage? [toc=Metrics by Growth Stage]
Most Shopify store owners track too many metrics and act on too few. The KPIs that matter shift dramatically as you scale - a $20K/month store needs survival metrics, while a $500K/month brand needs cross-functional intelligence that Shopify Analytics alone can't provide.
Here are the essential metrics organized by growth stage, with benchmarks to contextualize your own performance.
🏁 Tier 1: $0-$50K/Month - Survival Metrics
At this stage, focus is everything. Track only what directly reveals whether your store is viable:
Online Store Conversion Rate - Benchmark: 1.4-1.8% average; top 20% of stores hit 3.2%+; top 10% exceed 4.7%. If you're below 1.0%, fix your product pages and checkout before spending on traffic
Average Order Value (AOV) - Low-ticket items ($10-$50) typically convert at 2.5-4.0%; high-ticket ($500+) below 1.0%. Your AOV determines how much you can afford to spend acquiring customers
Traffic Sources - Know where your visitors come from. Shopify's Acquisition reports show sessions by referrer and source/medium - essential for identifying your most efficient channel before scaling spend
📈 Tier 2: $50K-$500K/Month - Efficiency Metrics
You've proven the model works. Now you need to understand why it works - and where money leaks:
Customer Acquisition Cost (CAC) - ⚠️ Shopify doesn't calculate this natively. You need to manually divide ad spend (from Meta/Google) by new customers acquired. Most merchants estimate incorrectly by using platform-reported ROAS instead
Returning Customer Rate - Benchmark: 20-30% is healthy for DTC brands. Below 15% signals a retention problem that will make scaling unprofitable
Cart Abandonment Rate - Benchmark: ~70% is the industry average. Shopify's Behavior reports show the conversion funnel, but can't tell you why people abandon
Gross Profit Margin - Shopify's Profit reports show gross profit by product and channel, but only if you've entered accurate COGS data per variant
💰 Tier 3: $500K+/Month - Scaling Metrics
This is where Shopify Analytics hits its structural ceiling. The metrics that matter at scale require cross-functional data:
Customer Lifetime Value (LTV) - Requires cohort analysis combining purchase history with acquisition source and cost. Shopify's Customer reports offer basic cohort views, but can't connect them to marketing spend
Contribution Margin by Channel - The metric that actually tells you which channels are profitable after all costs. Requires blending Shopify revenue + ad spend from Meta/Google + COGS from your accounting system. No native Shopify report can produce this. Understanding your unit economics at this level is non-negotiable.
Cohort Analysis (90-Day LTV) - Which customer cohort from which campaign produces the most value over time? This demands marketing attribution data merged with Shopify purchase history
Cash Conversion Cycle - How quickly does a dollar spent on inventory return as revenue? This spans Shopify, accounting, and banking data - entirely outside Shopify's visibility. Learn more about how to forecast cash flow for e-commerce.
Why Tier 3 Metrics Break Native Analytics
The reason $500K+ brands can't rely on Shopify Analytics alone is architectural: Shopify sees commerce data. It doesn't see your ad spend, your accounting ledger, or your bank balance. Calculating contribution margin by channel - the single most important metric for scaling profitably - requires data from at least three separate platforms.
Luca AI calculates these cross-functional metrics automatically by connecting Shopify, Meta, Google Ads, Stripe, and Xero into a single reasoning layer. Its marketing analysis and automation capabilities mean you can ask "What's my contribution margin by channel including all costs?" and get a real-time answer. For brands where the analytics point to a scaling opportunity, Luca can also surface dynamically-priced capital to fund it - connecting the insight directly to the resource.
Q4. Shopify Analytics vs. Google Analytics 4: Which One Do You Actually Need? [toc=Shopify vs GA4]
Most Shopify merchants use both Shopify Analytics and Google Analytics 4 - and most are confused by the different numbers each platform reports. This isn't a bug. It's the result of fundamentally different data collection architectures that serve different analytical purposes.
Understanding why they differ - and what each does best - is the key to building a reliable analytics foundation.
The Core Architectural Difference
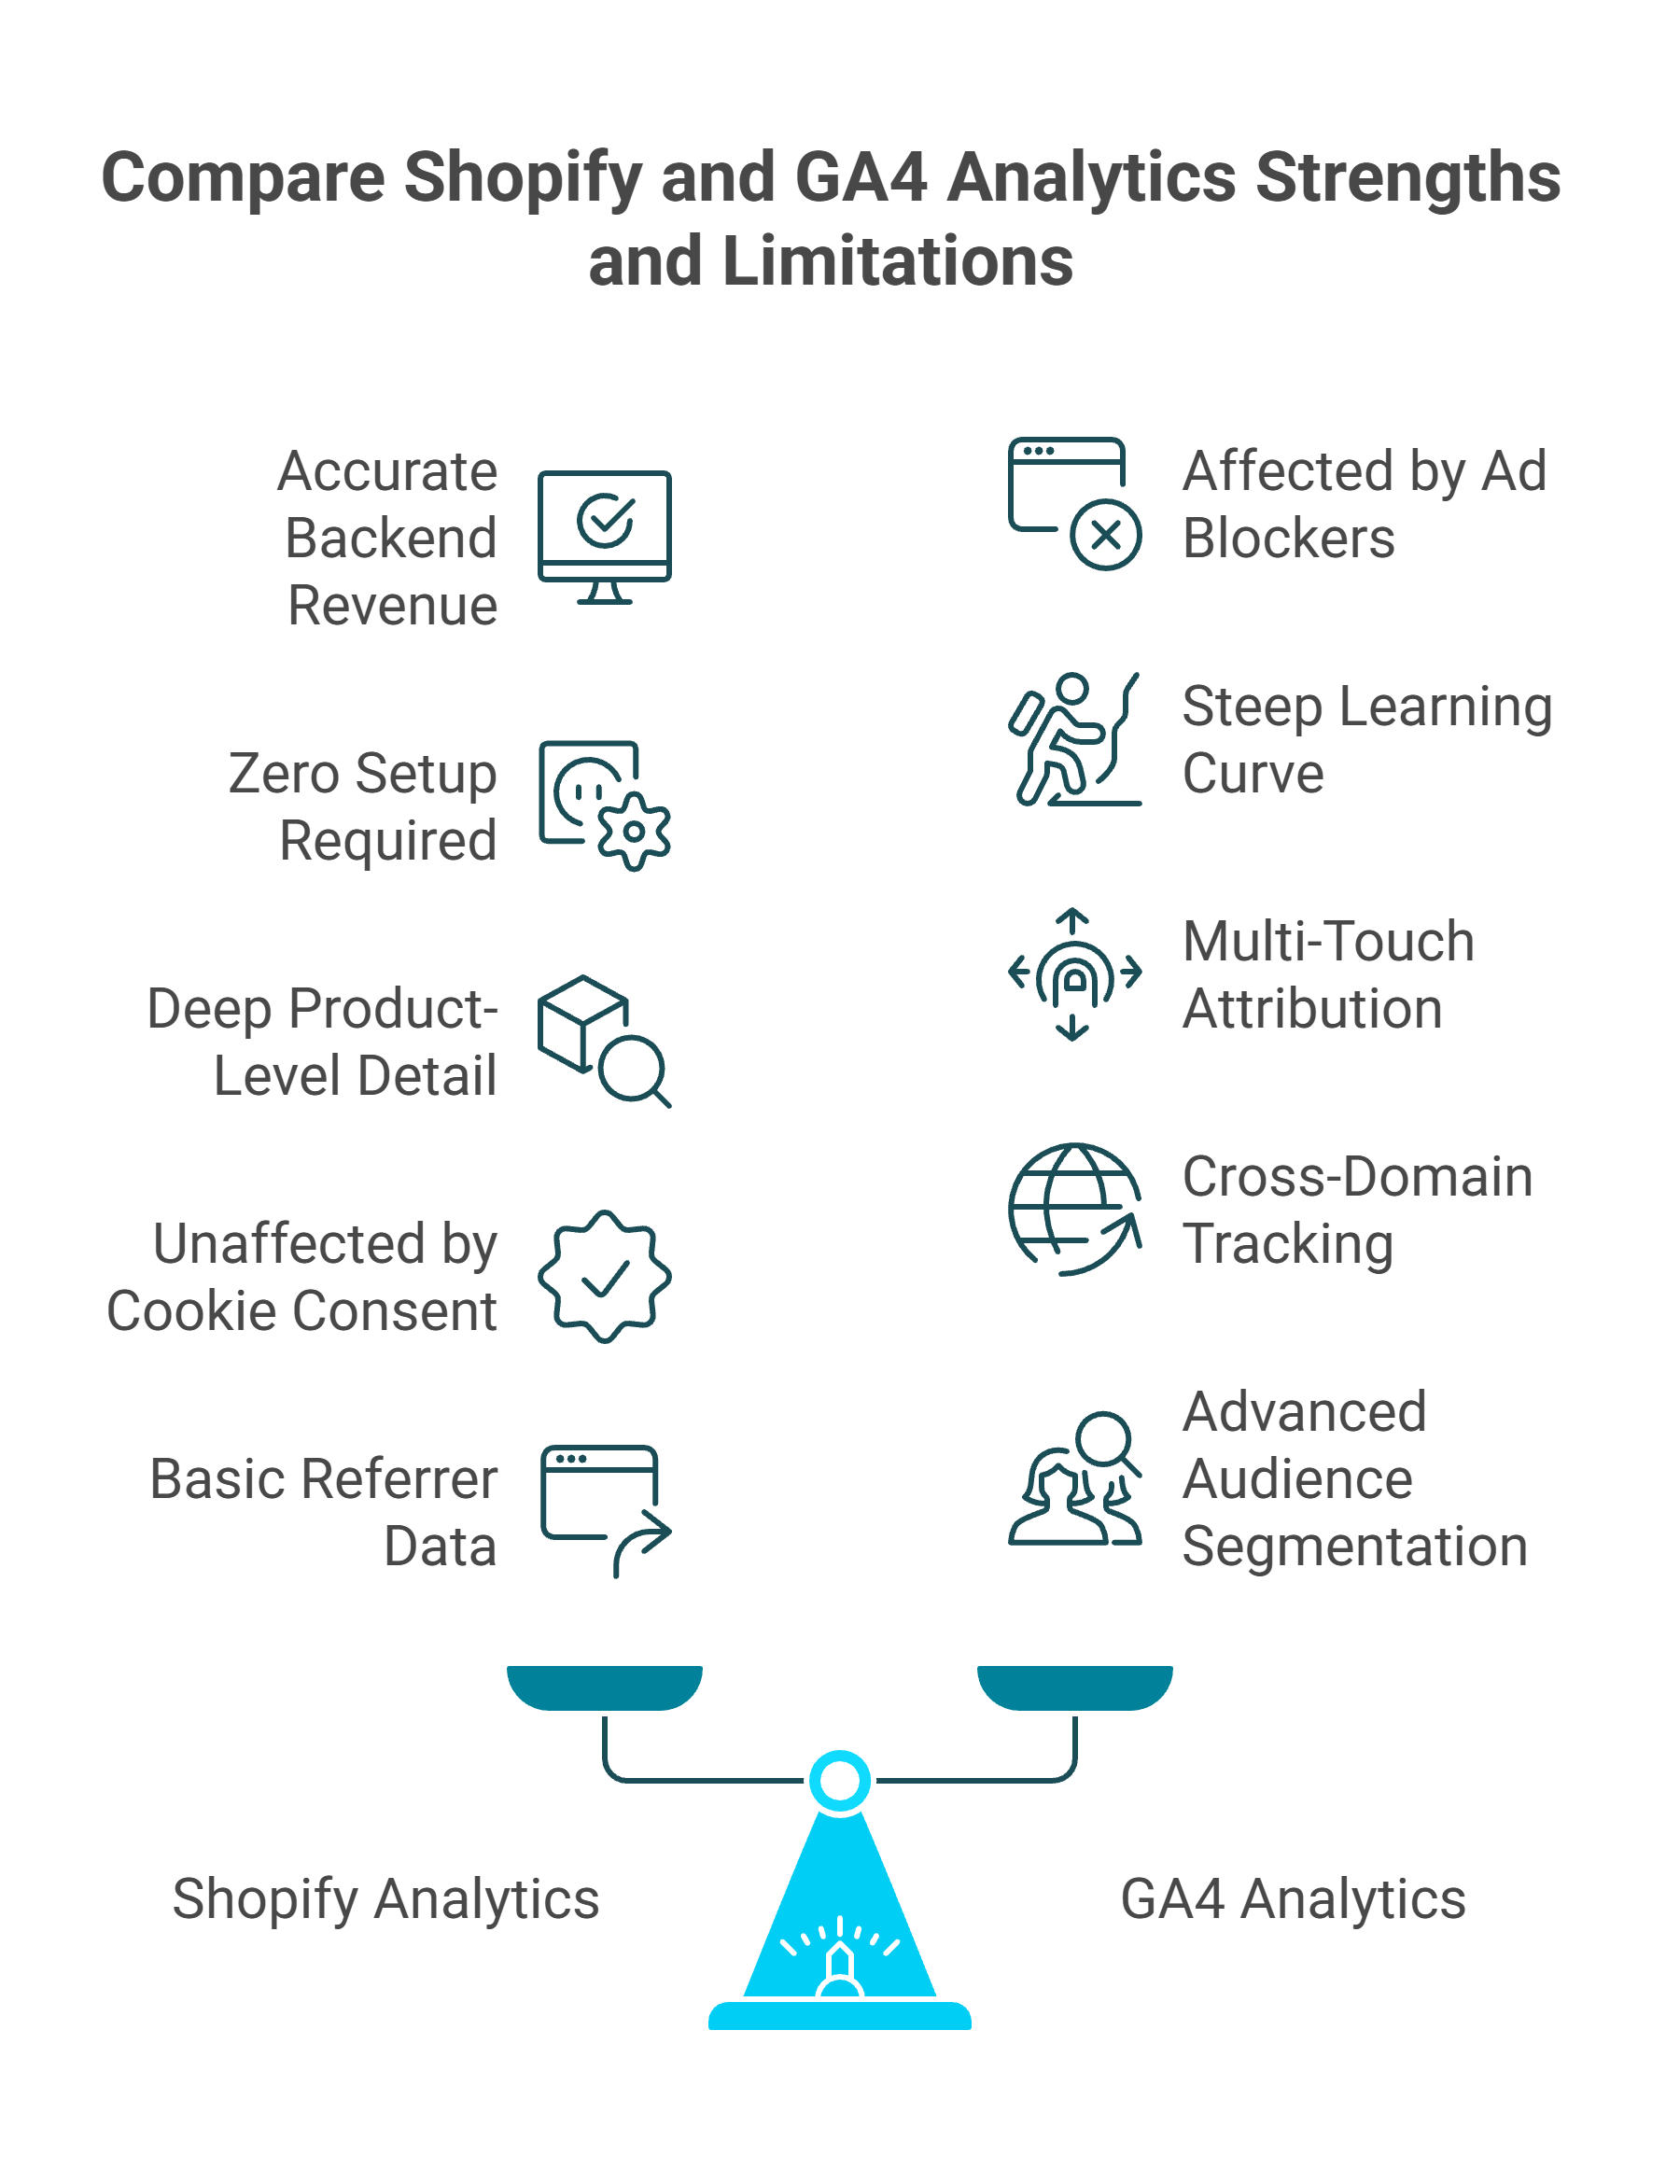
Infographic comparing Shopify Analytics and GA4 analytics on a balance scale, highlighting strengths like backend revenue accuracy and cookie immunity against GA4 features like cross-domain tracking and audience segmentation.
Shopify Analytics tracks server-side confirmed transactions. When a customer completes a purchase, Shopify's backend records the order regardless of what's happening in the customer's browser. This makes Shopify's revenue data highly accurate and immune to ad blockers.
GA4 tracks browser-side user behavior via JavaScript tags. It captures the full user journey - page views, scroll depth, add-to-carts, checkout initiation - but depends on the tracking script successfully loading in the visitor's browser. Ad blockers, privacy browsers, and cookie consent rejection can prevent GA4 from firing entirely.
The result: most merchants see a 10-20% discrepancy between GA4 and Shopify transaction data. For stores with significant EU traffic or iOS users, the gap can be even larger.
✅ Shopify Analytics Strengths
Accurate backend revenue - server-confirmed, unaffected by ad blockers
Zero setup required - works immediately on every plan
Deep product-level detail - sales by product, variant, collection, and channel
Unaffected by cookie consent - tracks transactions regardless of browser consent status
❌ Shopify Analytics Limitations
Last-click attribution only - no multi-touch journey visibility
No cross-domain tracking - can't follow users across subdomains or external sites
No audience segmentation - limited ability to build and analyze user segments
No marketing attribution beyond basic referrer data
✅ GA4 Strengths
Multi-touch attribution modeling - data-driven attribution across touchpoints
Advanced audience segmentation - custom audiences based on behavior patterns
Cross-device and cross-domain tracking - follows users across sessions and devices
Event-based flexible model - track any custom interaction
❌ GA4 Limitations
Affected by ad blockers - 15-30% data loss depending on audience
Steep learning curve - 20-40 hours for basic daily competency, 40-80+ hours for advanced use
Data sampling at scale - large datasets get sampled, reducing accuracy
Requires proper implementation - many Shopify stores have broken GA4 setups with missing purchase events, incorrect currencies, or duplicate tags
"The free version is not reliable - Google even says so themselves in their privacy policy. Sessions are a vague statistic that do not help define the quality/quantity of your web traffic." - Verified User in Marketing and Advertising, G2 Verified Review
"It is becoming very opaque, it doesn't have real-time, the sampling is increasingly wild, and now it applies a threshold. If you don't pay for BigQuery, you're really tied hand and foot." - Verified User in Retail, G2 Verified Review
Side-by-Side Comparison
Shopify Analytics vs Google Analytics 4 vs Luca AI
Criteria
Shopify Analytics
Google Analytics 4
Luca AI
Data Collection
Server-side (backend)
Browser-side (JavaScript)
Unified: server + browser + API
Attribution Model
Last-click only
Data-driven multi-touch
Cross-platform synthesis
Revenue Accuracy
✅ High (confirmed orders)
⚠️ 10-20% underreporting
✅ Reconciled across sources
Marketing Attribution
❌ Basic referrer only
✅ Multi-touch
✅ Full-stack (ads + finance + commerce)
Setup Complexity
None
Medium-High (20-40 hrs)
Low (10 min integration)
Ad Blocker Impact
None
15-30% data loss
None (API-based)
Financial Context
❌ None
❌ None
✅ Xero, Stripe, banking
Who Should Use What
Use Shopify Analytics for confirmed revenue tracking and product performance - it's your source of truth for what sold. Use GA4 for understanding user behavior, traffic patterns, and multi-touch attribution - it's your source of truth for how people shop. Use both together for the fullest native picture.
Use Luca AI if you need both data sources unified into a single conversational interface - plus the marketing spend, financial data, and cash flow context that neither Shopify nor GA4 can provide. Explore the full list of best AI tools for Shopify owners to understand how Luca fits into the broader landscape. When your analytics reveal a scaling opportunity, Luca can also surface instant, dynamically-priced capital to fund it - the only platform that bridges the insight-to-action-to-capital gap. Learn more about the intelligence-capital thesis behind this approach.
"Almost all of the super popular, easy-to-use, out-of-the-box reports now have to be manually created. The rows aren't even clickable anymore so the default views don't dive into other views, and that is so sad." - Verified User in Computer Software, G2 Verified Review
Q5. How Do You Set Up Google Analytics 4 on Shopify? [toc=GA4 Setup Guide]
Connecting GA4 to your Shopify store takes under 15 minutes using the native integration - no code edits required. Here's the step-by-step process, plus the critical verification steps most merchants skip.
Step 1: Create Your GA4 Property
Log into Google Analytics, click Admin > + Create Property, and enter your store details. Select your timezone (match it to your Shopify timezone to avoid reporting discrepancies), choose your currency, and optimize for online sales.
Next, create a Web Data Stream under your new property:
Go to Admin > Data Streams > Add Stream > Web
Enter your Shopify store URL (your custom domain, not yourstore.myshopify.com)
Copy the Measurement ID (starts with G-XXXXXXX)
Step 2: Connect GA4 to Shopify via the Google & YouTube App
Since 2023, Shopify offers an official Google & YouTube app that eliminates manual code injection:
In Shopify Admin, go to Settings > Apps > Shopify App Store
Search for "Google & YouTube" and click Add App
Connect your Google account and select your GA4 property from the dropdown
Activate customer events to enable automatic tracking of page_view, view_item, add_to_cart, begin_checkout, and purchase events
The entire installation takes 10-15 minutes with no theme file edits.
Step 3: Verify Your Setup
⚠️ This is where most merchants fail. Installing GA4 without verifying leads to weeks of broken data:
Open GA4's Realtime Report - visit your store in a separate browser and confirm you see your own session appear
Use DebugView (Admin > DebugView) to check that key e-commerce events fire correctly: page_view, view_item, add_to_cart, begin_checkout, purchase
Wait 24-48 hours, then check Reports > Monetization > Ecommerce Purchases to confirm revenue data flows correctly
The 3 Most Common Setup Mistakes
Duplicate tags - Installing GA4 via both the Google & YouTube app and a manual gtag.js snippet inflates every metric by ~2x. Check your theme's <head> section for redundant tracking code
Currency mismatch - If your GA4 property is set to USD but Shopify reports in EUR, revenue figures won't align. Set both platforms to the same currency during setup
Missing Consent Mode v2 - For EU-based stores, Google now requires Consent Mode v2 for data modeling and audience building. Without it, you lose conversion modeling entirely. Implement via a CMP (Consent Management Platform) that supports Google's consent API, ensuring a single default state (denied) fires before any tags load
The Advanced Alternative: Google Tag Manager
For stores needing custom event tracking, server-side tagging, or complex consent orchestration, Google Tag Manager (GTM) provides full control. GTM lets you configure custom e-commerce events, add Meta CAPI, and manage consent flows from a single container. The trade-off: GTM requires developer resources and ongoing maintenance.
Luca AI sidesteps this entire complexity. We connect to both Shopify and GA4 via API in under 10 minutes - no tag configuration, no GTM setup, no consent mode troubleshooting - and automatically unify both data sources into a single intelligence layer, eliminating the discrepancies that plague manual implementations.
Q6. Why Do Shopify Analytics Numbers Never Match Your Other Platforms? [toc=Data Discrepancy Causes]
It's Monday morning. Shopify says you did €47,000 in weekend revenue. GA4 says €38,000. Meta Ads Manager claims it drove €52,000 in attributed sales. Three platforms, three numbers, zero confidence in which is right.
You spend the next two hours in spreadsheets trying to reconcile - and still aren't sure which number to base your scaling decisions on. This scenario plays out every week in thousands of Shopify stores, and it's not because any single platform is "wrong."
The 5 Root Causes of Data Discrepancies
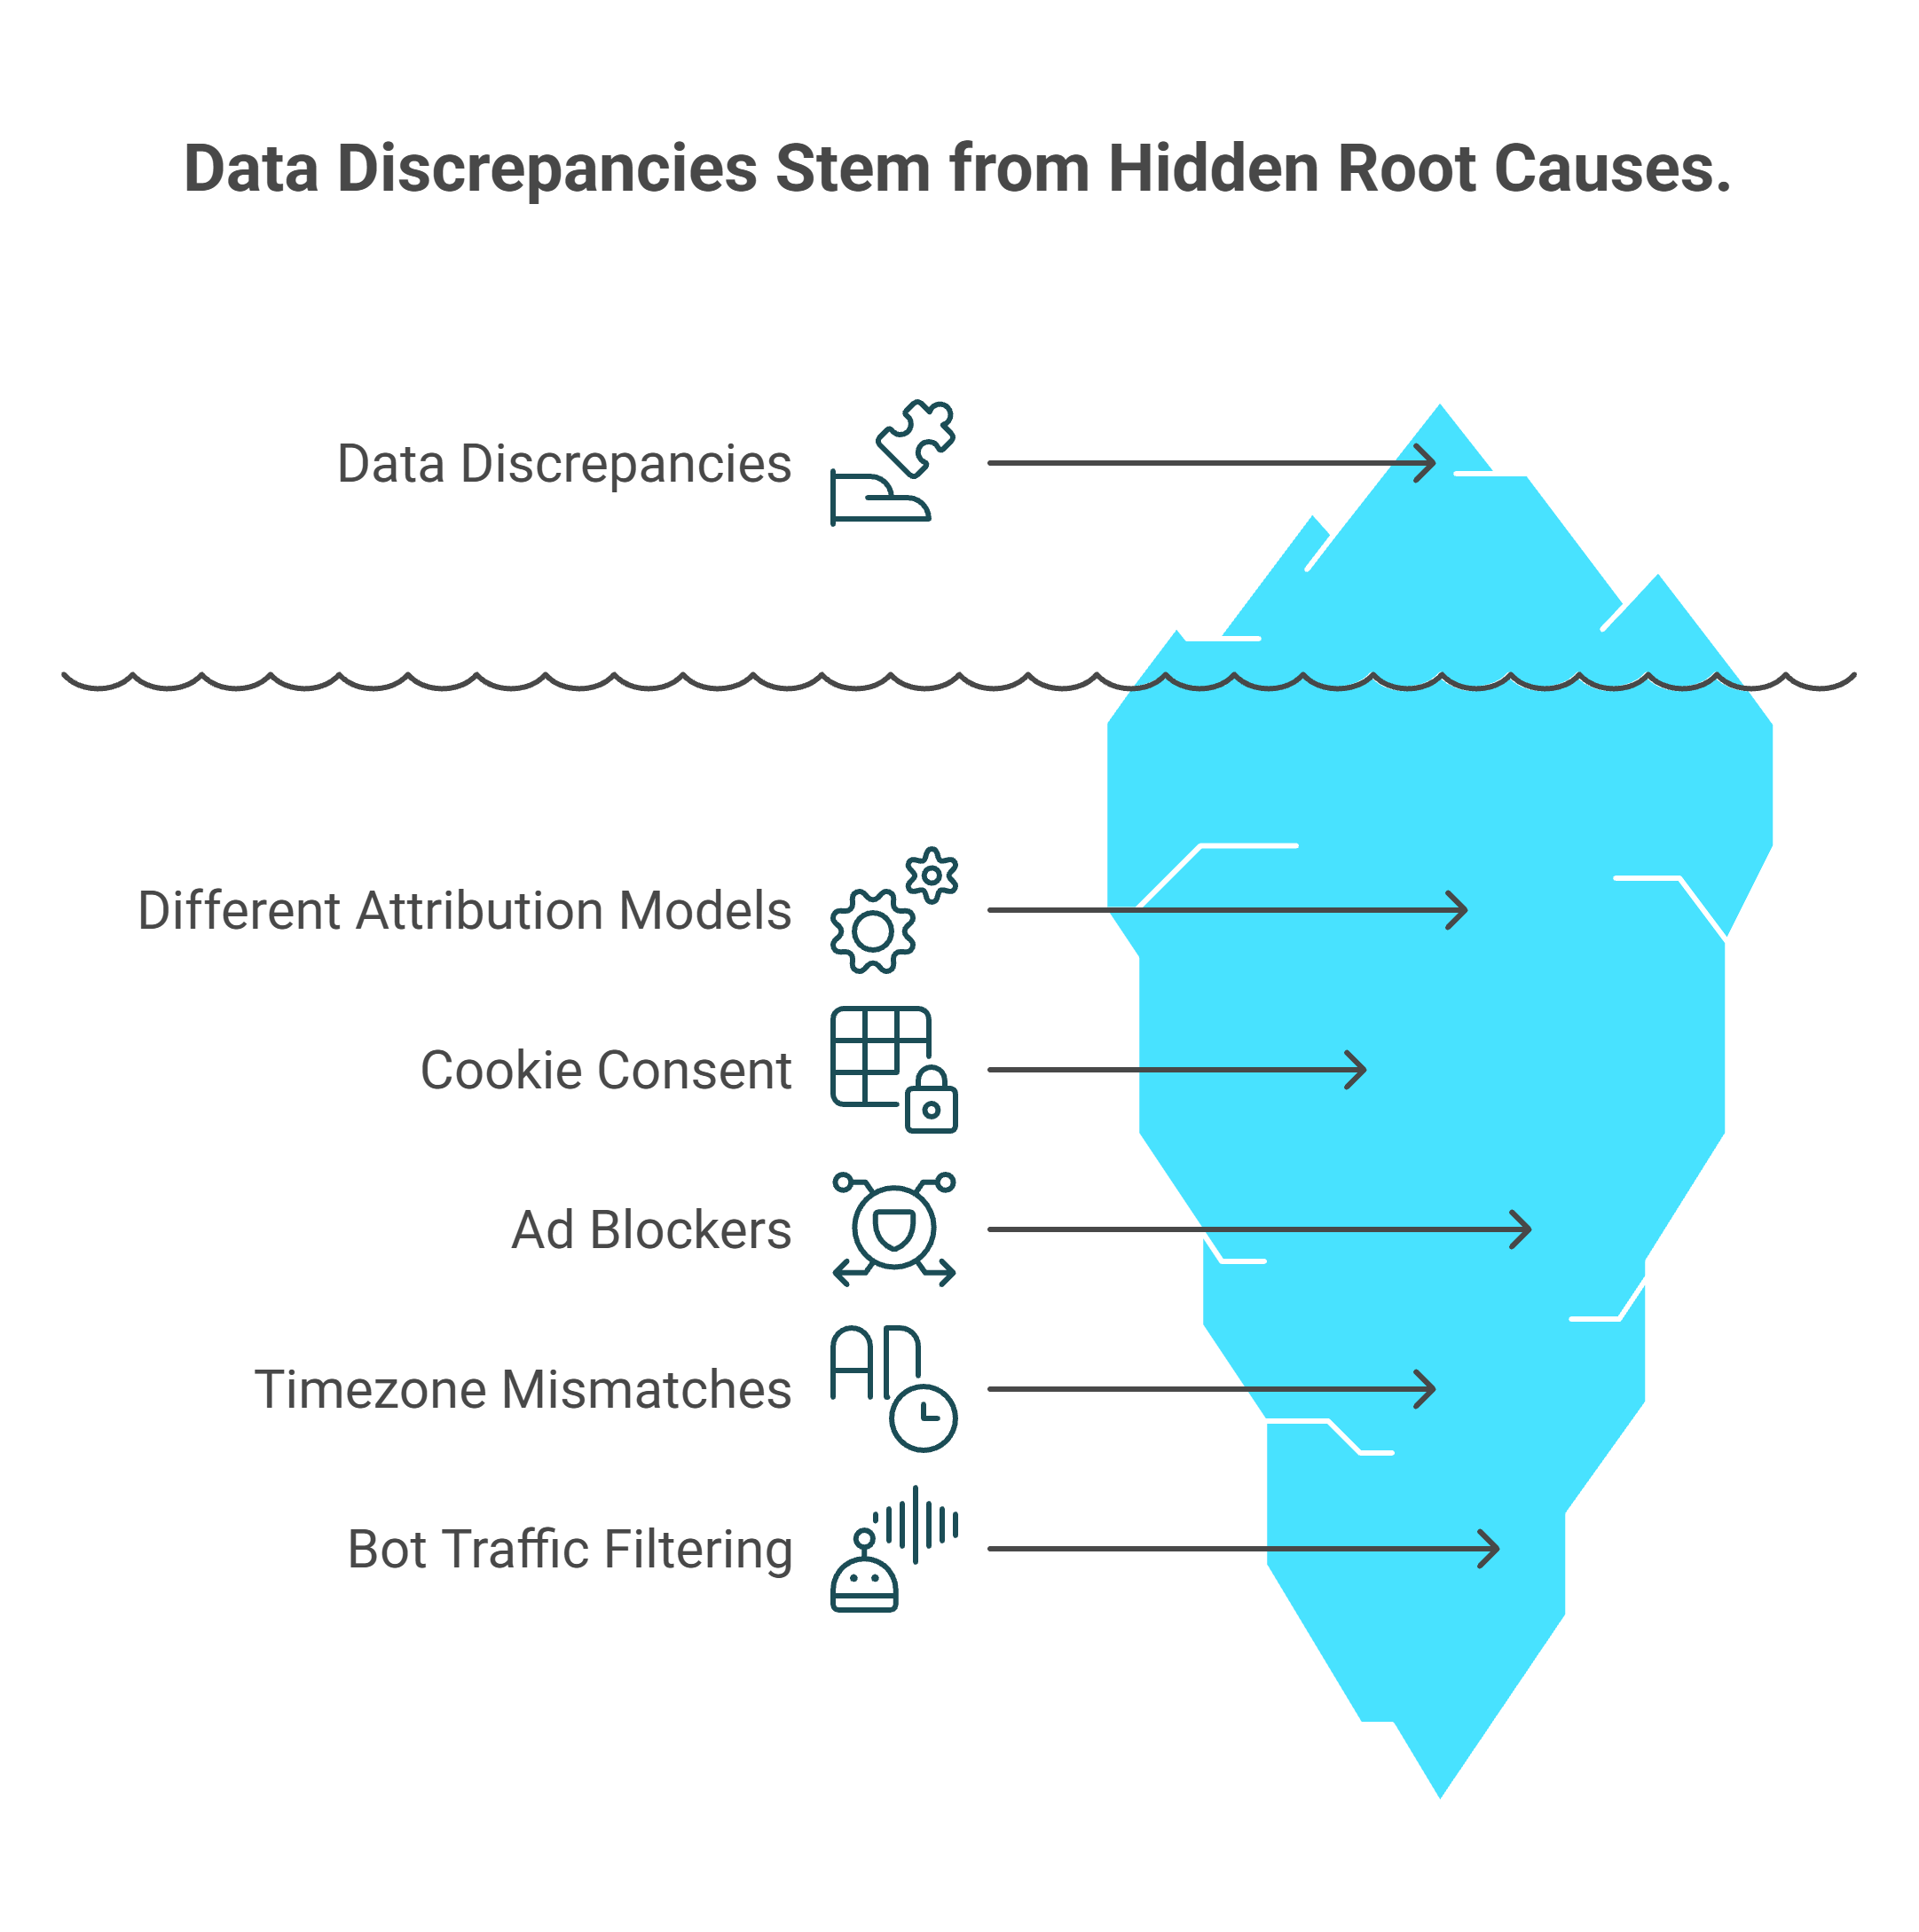
Iceberg visualization revealing five hidden causes behind Shopify analytics data discrepancies: different attribution models, cookie consent, ad blockers, timezone mismatches, and bot traffic filtering differences.
The numbers don't match because each platform measures differently by design:
Different attribution models - Shopify uses last-click, server-side attribution (the final touchpoint before purchase). GA4 uses data-driven, browser-side attribution across multiple touchpoints. Meta uses a 7-day click / 1-day view self-attribution window that counts conversions across any exposure
Cookie consent and privacy regulations - EU stores running Consent Mode lose 20-40% of browser-side tracking when users reject cookies. Shopify's server-side data is unaffected; GA4's browser-based data shrinks
Ad blockers - 15-30% of visitors use ad blockers that prevent JavaScript-based analytics from firing. GA4 never sees these sessions. Shopify captures their purchases regardless
Timezone and reporting window mismatches - Shopify may report in UTC, GA4 in your local timezone, and Meta in your ad account timezone. A purchase at 11:45 PM can land on different calendar days across platforms
Bot traffic filtering - Shopify filters known bots server-side. GA4 filters differently. Bot traffic can inflate session counts by up to 40%, distorting conversion rates
⚠️ The Hidden Costs Most Founders Underestimate
Data discrepancies aren't just an annoyance - they compound into real operational damage:
~5 hours/week spent on manual reconciliation across spreadsheets
Eroded trust in data leading to delayed decisions - you don't scale the winning campaign because the numbers "don't feel right"
Misallocated marketing budget based on Meta's self-reported ROAS - one clothing brand spent $15,000 on TikTok ads because platform data showed strong ROAS, when most conversions were actually driven by email campaigns
Team friction between marketing ("Meta says we're crushing it") and finance ("our bank account says otherwise")
"I run a small ecommerce store and I'm trying to improve conversions. I've been looking at analytics... honestly - hard to tell which ones are actually good." - r/ShopifyeCommerce Reddit Thread
How Luca AI Eliminates Reconciliation Entirely
The architectural fix isn't better spreadsheets - it's eliminating the need for manual reconciliation. Luca AI ingests server-side Shopify data, GA4 behavioral data, and ad platform spend data through direct API connections, normalizing and reconciling automatically.
✅ Ask "Why does my Meta revenue not match Shopify?" and get a specific diagnosis - not a dashboard you need to interpret. ✅ Cross-platform data unification happens continuously, not during your Monday morning spreadsheet session. ❌ Traditional tools show you three conflicting numbers and leave you as the manual integration layer.
From 5 hours of weekly reconciliation to a 10-second answer. See how Luca thinks to understand the cross-functional reasoning behind unified data reconciliation.
Q7. What Are the Real Strengths and Limitations of Shopify Analytics in 2026? [toc=Strengths and Limitations]
Shopify Analytics has improved significantly. The question isn't whether it's good - it's whether it's good enough for your growth stage. Here's an honest assessment of where Shopify's native analytics deliver genuine value and where they structurally fall short for scaling DTC brands.
✅ What Shopify Analytics Does Well in 2026
Credit where it's due - Shopify has invested heavily in its analytics experience:
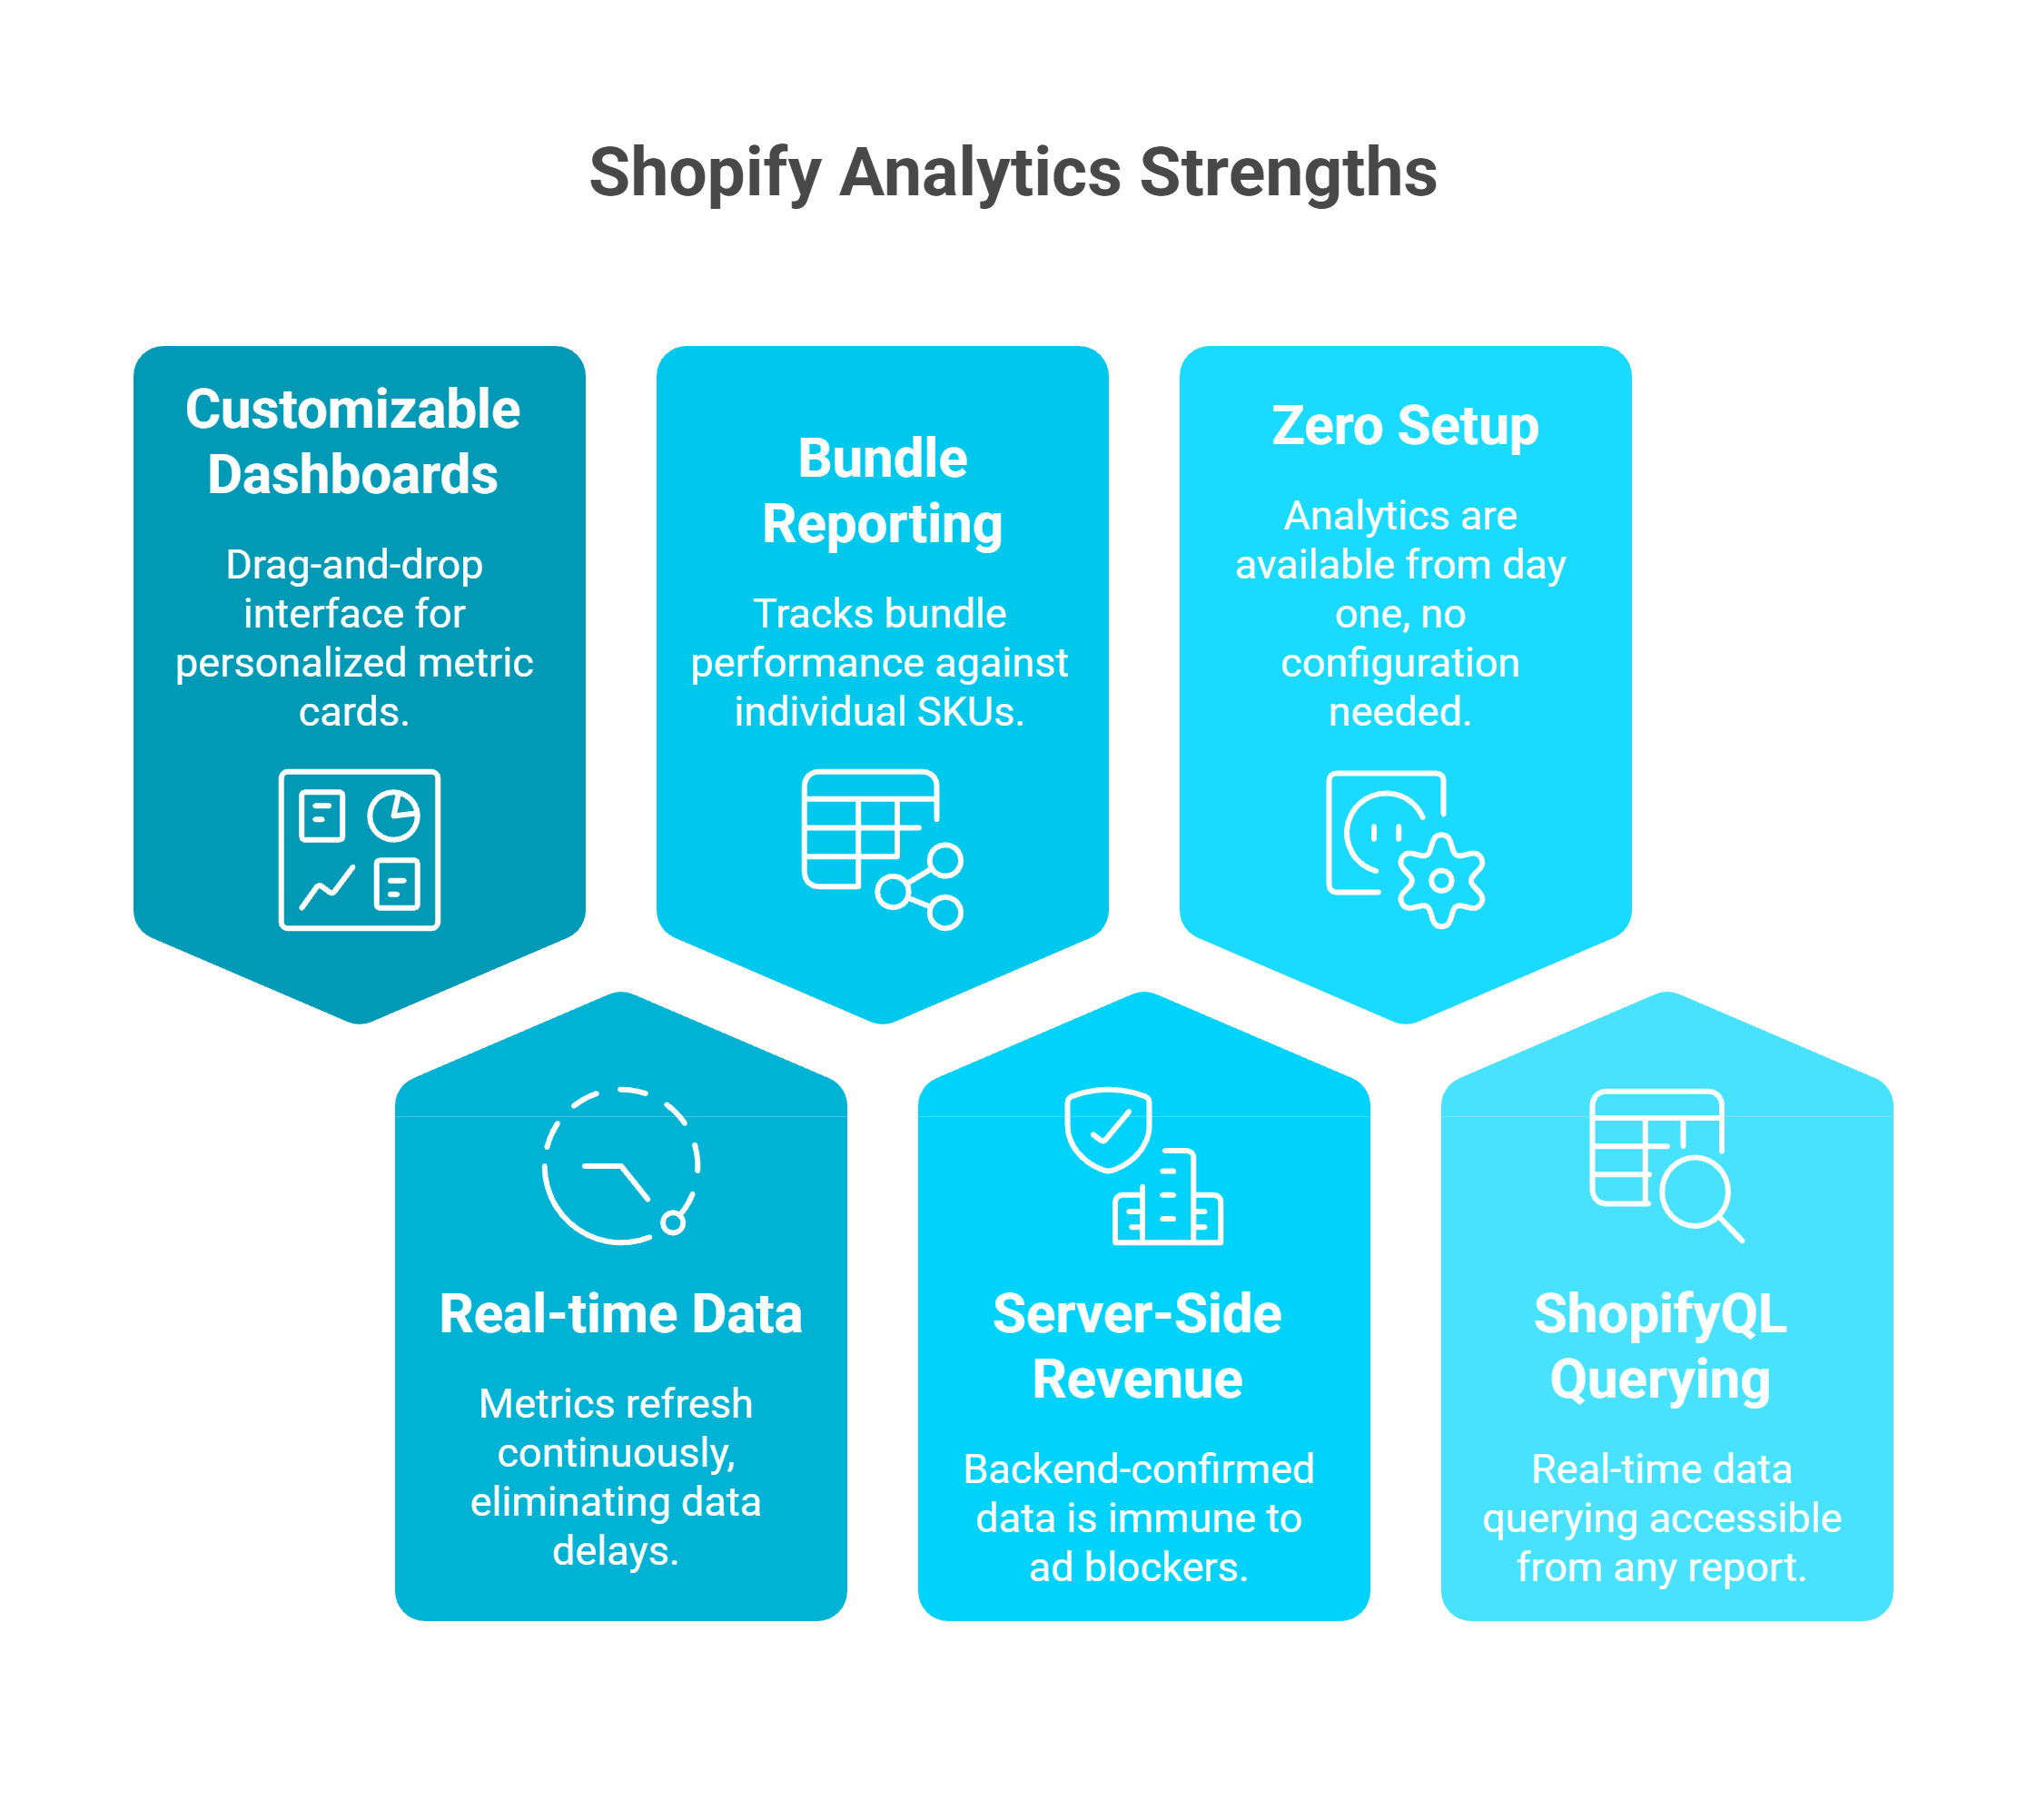
Honeycomb-style infographic showcasing six Shopify advanced analytics strengths: customizable dashboards, bundle reporting, zero setup, real-time data refresh, server-side revenue, and ShopifyQL querying capabilities.
Customizable drag-and-drop dashboards - The Winter 2025 Editions update introduced fully personalized metric cards that merchants can add, resize, reorder, and remove
Real-time data updates - Dashboard metrics now refresh continuously, eliminating the 12-24 hour data delays that plagued earlier versions
Bundle performance reporting - New bundle analytics track how product bundles perform relative to individual SKUs
Server-side revenue accuracy - Shopify's backend-confirmed transaction data remains immune to ad blockers and cookie consent, making it the most reliable revenue source for any Shopify store
Zero setup required - Every store gets analytics from day one. No tags, no configuration, no developer time
ShopifyQL real-time querying - Now accessible from within any report, allowing direct data querying on Plus plans
For stores under €500K revenue with straightforward, single-channel operations, Shopify Analytics may genuinely be sufficient.
❌ 6 Persistent Gaps the 2026 Updates Haven't Addressed
Despite the improvements, the core architectural limitations remain:
Shopify Analytics Persistent Gaps in 2026
Gap
Impact
No ad spend or ROAS integration
Cannot show true marketing efficiency - you must manually pull spend from Meta/Google
Last-click attribution only
Ignores multi-touch customer journeys - the email, the retargeting ad, the organic search that all contributed before the final click
No predictive analytics
Zero demand forecasting, no cohort modeling, no cash flow projections
Advanced reports gated by plan
Custom reports require Shopify plan ($105+/mo); ShopifyQL requires Plus ($2,300+/mo)
No financial system integration
Cannot connect Xero, QuickBooks, or banking - true profitability is invisible
No action layer
Displays data but cannot execute - can't pause ads, reorder inventory, or deploy capital
"Sidekick straight up lied to me at one point. I spent AGES following its instructions before eventually talking to a real agent who told me what I was trying to do wasn't possible." -u/ntyelac, r/shopify Reddit Thread
"It has potential, but so far it can't do much. Often it comes up with broken advice that does not work which it also admits when you challenge it. Very ChatGPT like." - u/ntmt42a, r/shopify Reddit Thread
The Fundamental Architecture Problem
The issue isn't that Shopify Analytics is bad - it's that it was never designed to be a cross-functional business intelligence layer. It's a commerce reporting tool inside a commerce platform. When you need answers spanning marketing + finance + operations, you become the manual integration layer - exporting CSVs, switching between 8-12 dashboards, and spending 10-15 hours per week triangulating insights that should be automatic. Read more about how AI can actually help you run your e-commerce business beyond what native dashboards offer.
How Luca AI Fills the Structural Gaps
Luca AI was designed from the ground up for cross-functional synthesis across 20+ data sources. Our unified context layer connects Shopify + Meta + Google Ads + Xero + Stripe + banking data into a single reasoning engine. Instead of navigating dashboards, you ask questions in plain English. Instead of waiting for anomalies to hit your P&L, proactive intelligence surfaces risks (CAC spikes, inventory shortfalls, creative fatigue) before they compound. Explore the full range of Luca AI use cases to see how this works across marketing, finance, and operations.
While Shopify Analytics in 2026 tells you your conversion rate dropped, Luca AI tells you why, connects it to your recent Meta campaign changes, models the revenue impact over 90 days, and offers dynamically-priced capital to fund the fix. That's the intelligence-capital thesis in action.
Q8. What Shopify Analytics Mistakes Are Quietly Costing You Revenue? [toc=Common Analytics Mistakes]
Most Shopify store owners have access to analytics - but few use them correctly. These seven common mistakes silently erode revenue, misguide marketing spend, and delay scaling decisions. Here's what to stop doing immediately.
💸 The 7 Mistakes Costing You Money
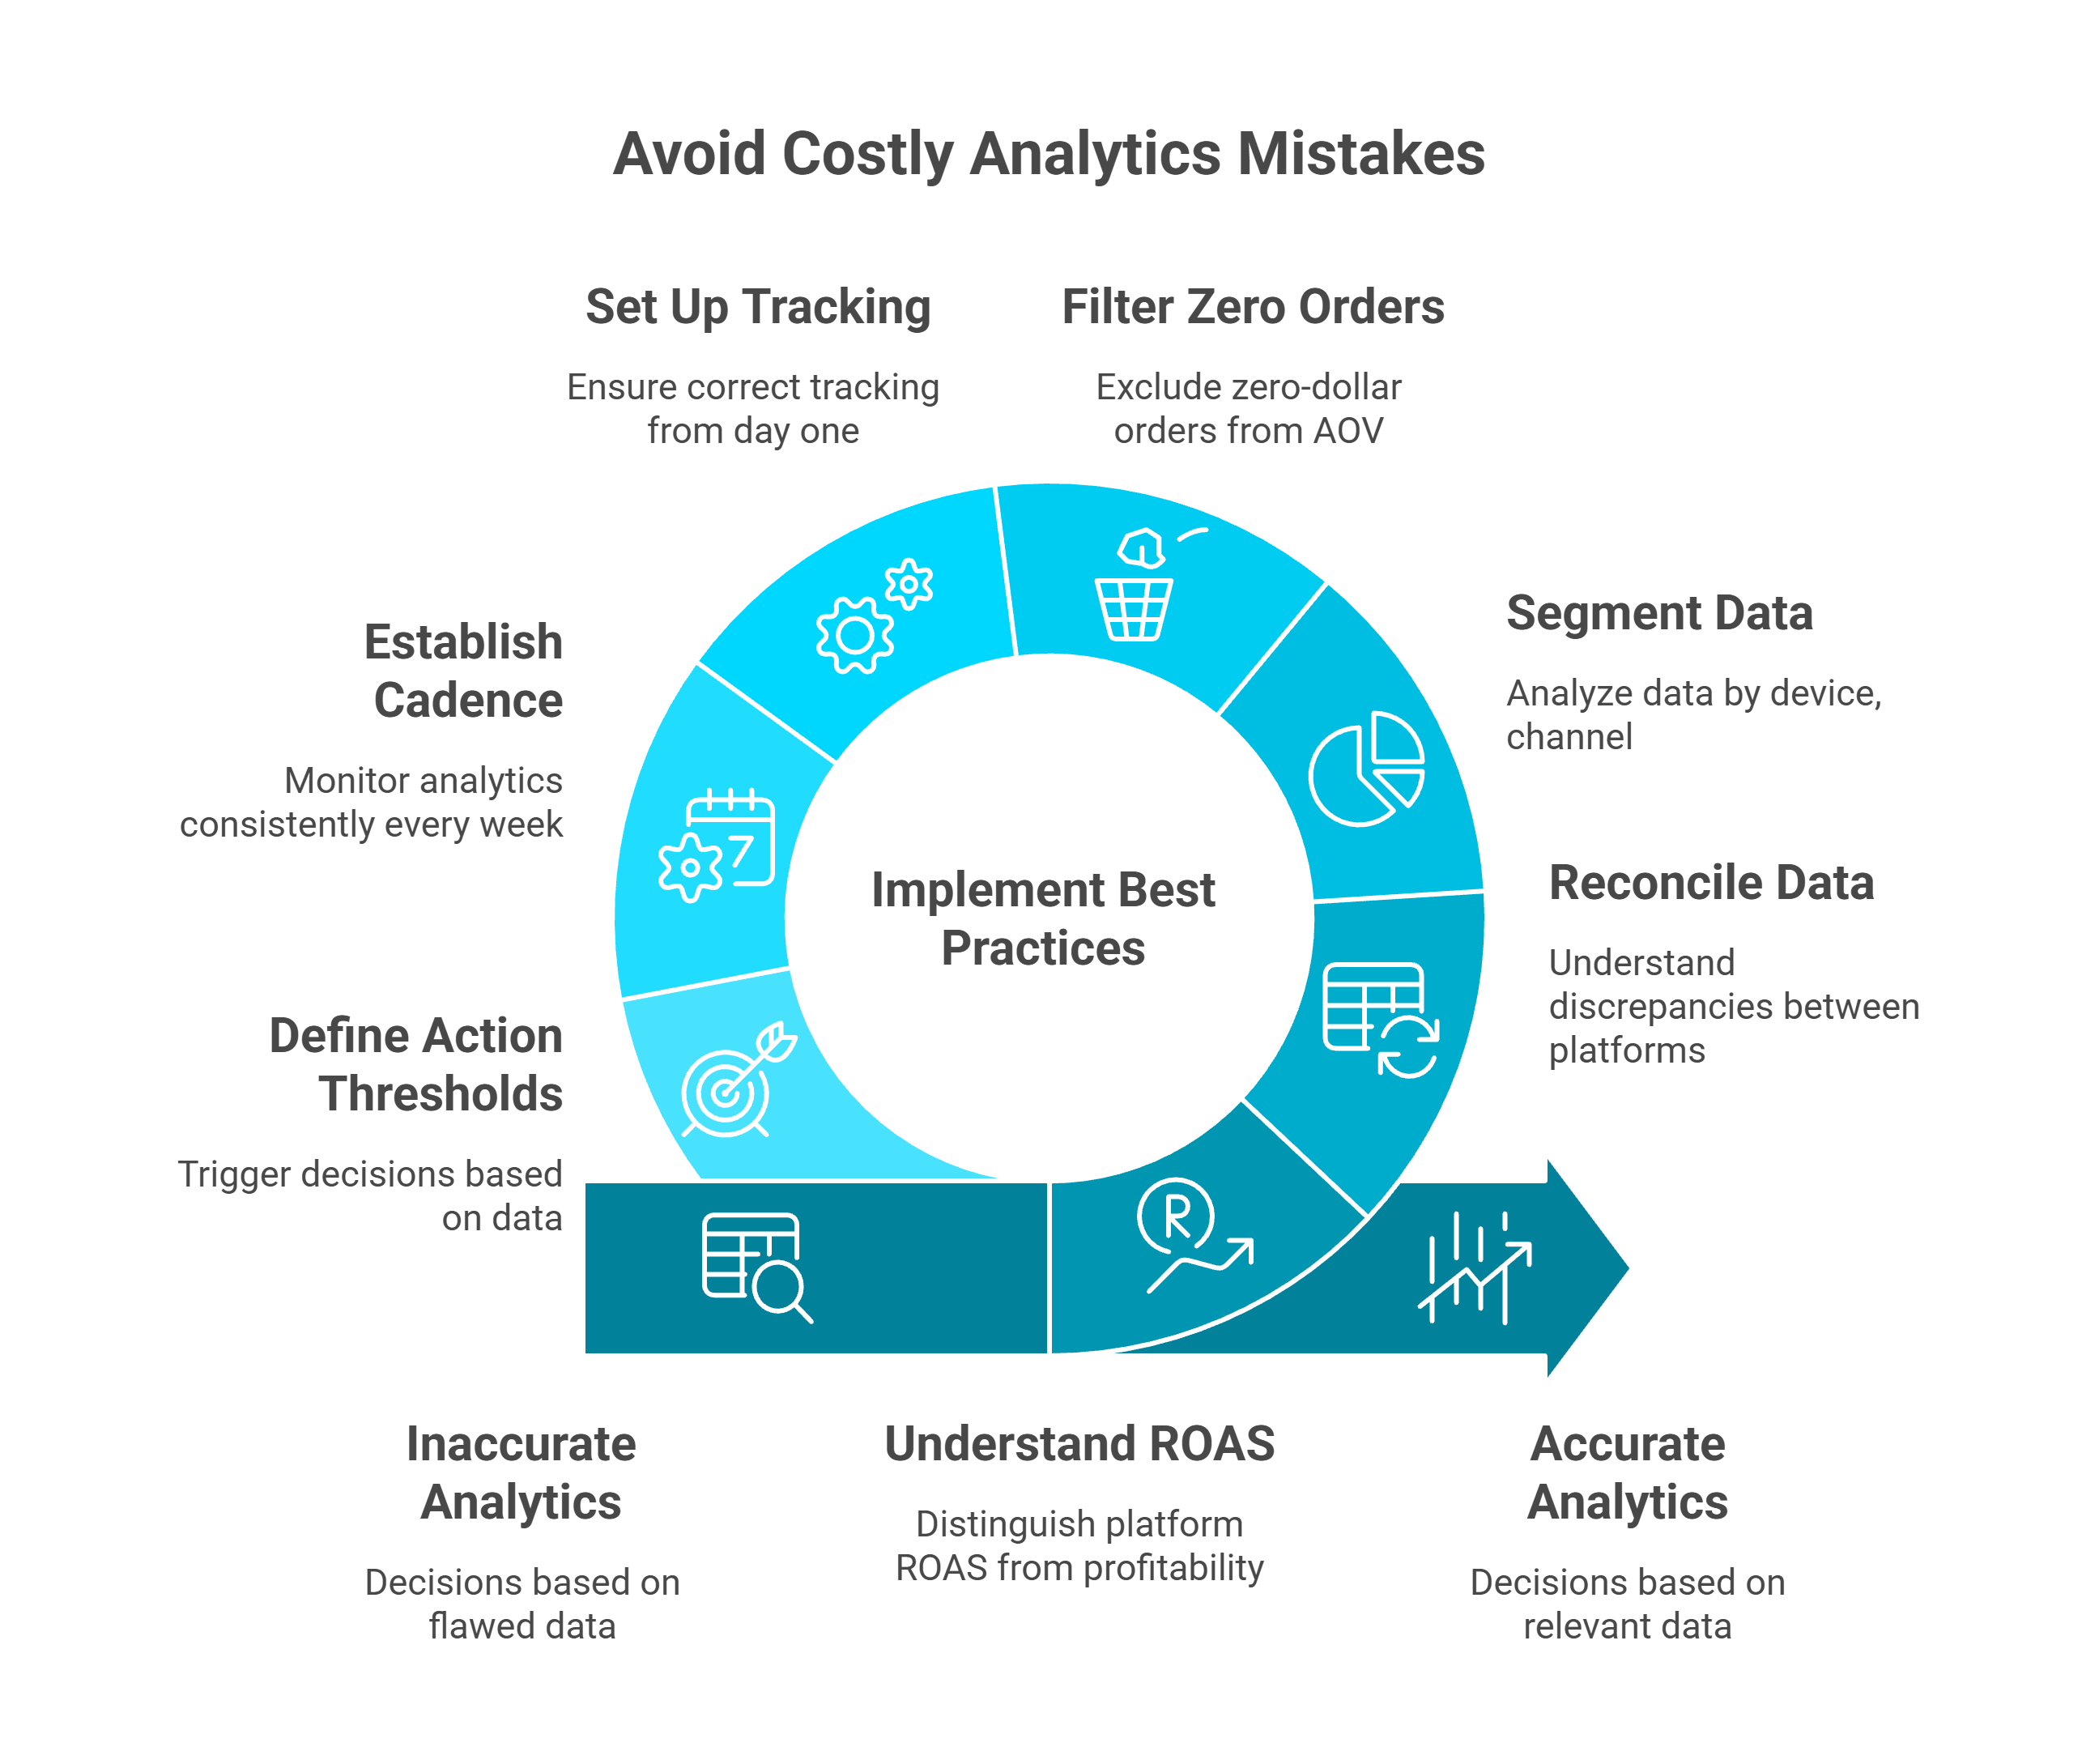
Circular infographic illustrating seven Shopify analytics best practices including setting up tracking correctly, filtering zero-dollar orders, segmenting data, reconciling discrepancies, and defining action thresholds.
1. Trusting platform-reported ROAS as actual profitability Meta self-attributes sales using a 7-day click / 1-day view window that counts conversions your email campaigns or organic traffic actually closed. One clothing brand spent $15,000 scaling TikTok ads based on platform ROAS - when most sales actually came from email. Understanding the difference between declining platform ROAS vs. true profitability is critical.
2. Ignoring data discrepancies between Shopify and GA4 When Shopify says €47K and GA4 says €38K, most merchants assume one platform "must be wrong" instead of understanding why they differ architecturally. This leads to decisions based on whichever number feels more comfortable - not whichever is more relevant.
3. Failing to segment data Relying on store-wide averages hides critical extremes. Your overall conversion rate might be 2.5%, but desktop could be converting at 4% while mobile lags at 1.2%. Without segmentation, you optimize for the average and miss the mobile problem entirely.
4. Including zero-dollar orders in AOV calculations Samples, warranties, replacements, and 100%-discount orders inflate your real Average Order Value. Shopify includes these by default unless you explicitly filter them out.
5. Not setting up tracking correctly from day one Duplicate GA4 tags, missing Consent Mode v2, and broken e-commerce events often go undetected for weeks. By the time you discover the issue, you've lost months of reliable data.
"I moved my content-for-header without being fully aware what it does, and it broke my analytics. It's been moved back but my analytics haven't turned back on... Support is directing me to utilize an expert." - r/shopify Reddit Thread
6. Checking analytics sporadically instead of establishing a weekly cadence Trends are invisible without consistent monitoring. A gradual CAC increase of 3% per week compounds to 40%+ over a quarter - but it only becomes visible if you're comparing the same metrics on the same schedule every week.
7. Treating analytics as a spectator sport Reviewing dashboards without defining action thresholds means data never triggers decisions. Without pre-set rules like "If ROAS drops below 2.0, pause the campaign immediately" or "If cart abandonment exceeds 75%, trigger an exit-intent discount", analytics becomes passive entertainment.
"Our experience with Triple Whale has been extremely frustrating and almost categorically terrible. The integrations are inconsistent, building with the AI tool Moby is very buggy and crashes more than half the time... we end up reverting back to direct data sources like Meta, Shopify, Recharge, etc." - Matt Huttner, Trustpilot Verified Review
✅ How Luca AI Eliminates These Mistakes by Design
Luca AI doesn't fix analytics mistakes through better discipline - it eliminates them through better architecture:
✅ Proactive alerts replace sporadic checking - Luca monitors your business 24/7 and surfaces anomalies (CAC spikes, margin erosion, creative fatigue) before they compound
✅ Cross-platform unification eliminates discrepancy confusion - one reconciled data model across Shopify, GA4, Meta, and Google Ads
✅ True contribution margin replaces platform-reported ROAS - blending Shopify revenue + ad spend + COGS from Xero for the number that actually matters. This is what tracking e-commerce unit economics should look like.
✅ Built-in action thresholds replace passive dashboard viewing - Luca can autonomously flag underperforming campaigns and recommend pausing when confidence is high
Q9. How Does Shopify Analytics Compare to Third-Party Tools Like Triple Whale, Northbeam, and Polar Analytics? [toc=Third-Party Tool Comparison]
If Shopify Analytics is free and built in, why do thousands of merchants pay $100-$500+/month for third-party analytics tools? The answer lies in what Shopify can't do: cross-platform attribution, ad spend integration, and blended performance views that unify commerce and marketing data.
Here's how the most popular third-party Shopify analytics tools compare to native analytics and to each other.
Triple Whale
Triple Whale is the most widely adopted third-party analytics tool in the Shopify ecosystem, known for its "Triple Pixel" first-party tracking and the "Summary" dashboard that blends Shopify, Meta, Google, TikTok, and Klaviyo data.
What it does well:
First-party pixel tracking that reduces reliance on platform-reported attribution
Blended ROAS and MER (Marketing Efficiency Ratio) views across channels
Creative performance analytics for ad-level optimization
AI assistant "Moby" for natural language querying
Where merchants report friction:
Pricing starts at $100/mo and scales to $500+/mo for full features
Attribution accuracy depends heavily on pixel implementation quality
Data discrepancies with Shopify backend remain common
12-month contracts with limited flexibility
"Our experience with Triple Whale has been extremely frustrating and almost categorically terrible. The integrations are inconsistent, building with the AI tool Moby is very buggy and crashes more than half the time... we end up reverting back to direct data sources like Meta, Shopify, Recharge, etc." - Matt Huttner, Trustpilot Verified Review
"Broken Integrations. Fake Attribution for External Marketplaces. We've been stuck in months of pointless back and forth with Triple Whale because their integration simply does not work." - XTRA FUEL, Trustpilot Verified Review
Northbeam focuses on multi-touch attribution using machine learning models that attempt to reconstruct the full customer journey across channels and devices.
What it does well:
Advanced multi-touch attribution modeling (MTA)
Cross-device journey reconstruction
Customizable attribution windows
Strong integration with Meta, Google, TikTok, and Snapchat
Where merchants report friction:
Premium pricing ($1,000+/mo for meaningful functionality)
Requires 3-month upfront commitment with no trial
Steep learning curve for non-technical users
Attribution models are "black box" with limited transparency into methodology
"A good company would be able to offer you a trial, knowing you would stay. Northbeam tries to make you pay 3 months up front. Their argument: it takes time to see accurate data. My concern is actually regarding how I will see the data in the platform. Very little empathy and understanding from these guys." - Tobias Teigen, Trustpilot Verified Review
Polar Analytics
Polar Analytics positions itself as a "central command center" for DTC brands, aggregating data from Shopify, ad platforms, email tools, and subscription platforms into unified dashboards with pre-built report templates.
What it does well:
Clean, pre-built dashboard templates for common DTC metrics
Strong multi-platform data aggregation (Shopify, Meta, Google, Klaviyo, Recharge)
Cohort analysis and LTV reporting
Accessible UI for non-technical users
Where merchants report friction:
Pricing discrepancies between app store listing and actual sales quotes
Missing basic features like year-over-year line chart comparisons
Multi-store inventory reporting issues that take months to resolve
Limited support responsiveness for complex configurations
"Not impressed compared to price point. I believe this is a great product, and solves many problems for brands with more complex reporting. However, from the get go there were some discrepancy in the pricing... They have not basic features in place like a line chart Year on Year comparison of revenue etc." - Maja, Trustpilot Verified Review
Side-by-Side Comparison
Third-Party Shopify Analytics Tools Comparison
Feature
Shopify Analytics
Triple Whale
Northbeam
Polar Analytics
Luca AI
Starting Price
Free (included)
$100/mo
$1,000+/mo
$300+/mo
See pricing
Attribution Model
Last-click only
First-party pixel + blended
Multi-touch ML
Platform-reported
Cross-platform synthesis
Ad Spend Integration
❌
✅
✅
✅
✅
Financial Data (COGS, P&L)
❌
❌
❌
❌
✅ (Xero, Stripe, banking)
Conversational AI
❌
Moby (limited)
❌
❌
✅ Full natural language
Embedded Capital
❌
❌
❌
❌
✅
Setup Complexity
None
Medium (pixel install)
High
Medium
Low (10 min API)
Why Luca AI Approaches the Problem Differently
Every tool in this comparison - including Shopify Analytics - is a dashboard. You still navigate, filter, interpret, and manually connect dots across screens. Luca AI replaces the dashboard paradigm entirely with a conversational intelligence layer that synthesizes commerce, marketing, and financial data into direct answers.
More critically, none of the tools above include financial system integration. Triple Whale can show you blended ROAS. Northbeam can model multi-touch attribution. Polar can aggregate channel data. But none of them can tell you your true contribution margin by channel after COGS, shipping, and payment processing fees - because none connect to Xero, QuickBooks, or your banking data.
Luca AI does. And when the data reveals a scaling opportunity, Luca can surface dynamically-priced capital to fund it - the only platform in the ecosystem that bridges insight, action, and capital. Explore the full list of best e-commerce analytics tools to see how the landscape is evolving.
Q10. How Do You Build a Weekly Shopify Analytics Review Cadence? [toc=Weekly Analytics Cadence]
The difference between merchants who scale profitably and those who plateau isn't access to data - it's having a repeatable system for acting on it. A structured weekly analytics cadence transforms Shopify Analytics from a passive dashboard into an active decision-making engine.
Here's the exact framework used by 7-figure DTC brands to review their Shopify data without drowning in metrics.
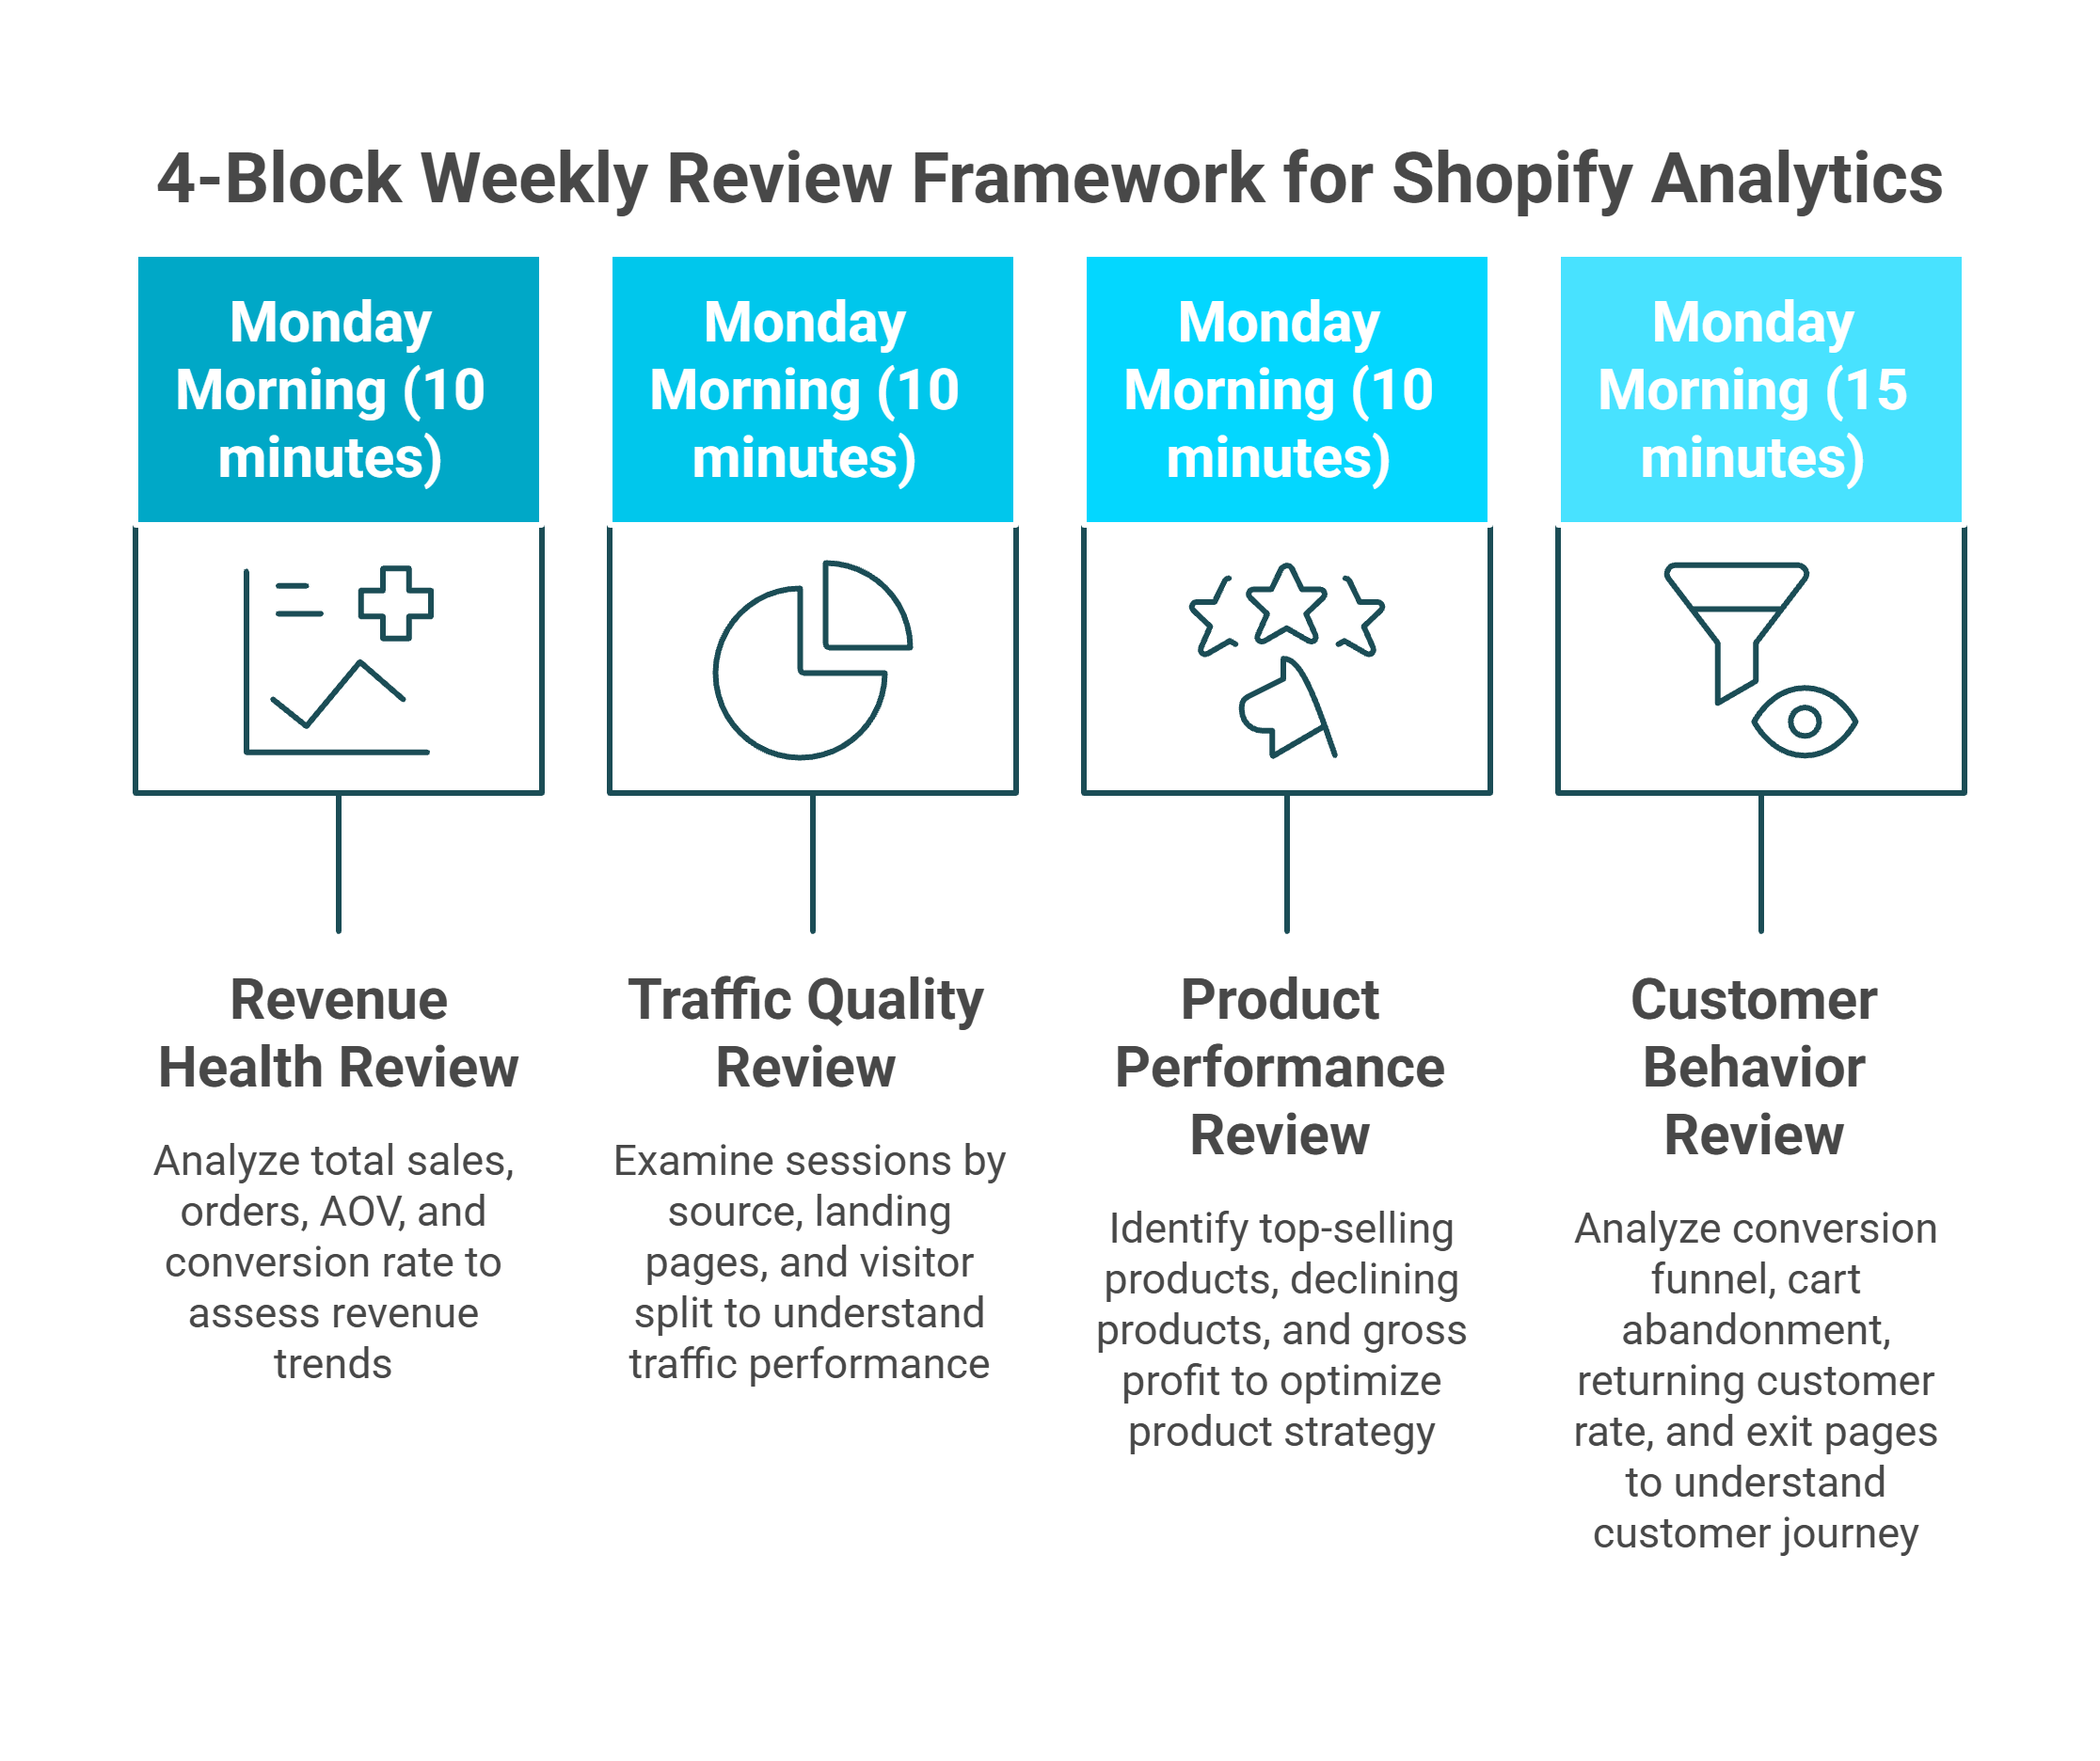
The 4-Block Weekly Review Framework
Block this as a 45-minute recurring calendar event every Monday morning. Each block has a specific focus, defined metrics, and a clear decision output.
Visual framework breaking a 45-minute Monday morning Shopify analytics review into four blocks: revenue health, traffic quality, product performance, and customer behavior analysis with time allocations.
🔵 Block 1: Revenue Health (10 minutes)
Where to look: Analytics > Dashboard, set to "Last 7 days vs. Previous 7 days"
Metrics to check:
Total Sales (and % change from prior week)
Total Orders
Average Order Value (AOV)
Online Store Conversion Rate
Decision output: Is revenue trending up, flat, or declining? If declining, is it a traffic problem (sessions down) or a conversion problem (sessions stable, CVR dropping)?
🟢 Block 2: Traffic Quality (10 minutes)
Where to look: Analytics > Reports > Acquisition
Metrics to check:
Sessions by source/medium (organic, paid, direct, email, social)
Top landing pages by session volume
New vs. returning visitor split
Decision output: Which traffic sources grew or shrank? Is paid traffic delivering proportionate revenue, or is it inflating sessions without converting? Are you becoming over-reliant on a single channel?
🟡 Block 3: Product Performance (10 minutes)
Where to look: Analytics > Reports > Sales by Product
Metrics to check:
Top 10 products by revenue
Top 10 products by units sold
Products with declining sales vs. prior period
Gross profit by product (if COGS entered)
Decision output: Which products are carrying the business? Which are declining? Should you increase ad spend on winners or investigate why losers are underperforming?
🔴 Block 4: Customer Behavior (15 minutes)
Where to look: Analytics > Reports > Behavior + Customer Reports
Decision output: Where are customers dropping off in the funnel? Is the cart-to-checkout drop worsening? Are you retaining customers or running a leaky bucket? This is where understanding your sales performance at a granular level becomes critical.
The 3 Rules That Make This Cadence Work
Same time, same day, every week - Consistency eliminates recency bias and reveals trends that sporadic checking misses
Compare to prior period, always - Never look at absolute numbers without context. A 2.1% conversion rate means nothing without knowing if it was 2.5% last week
End with one action item - Every review must produce at least one specific decision: pause a campaign, restock a product, fix a page, test a price. Analytics without action is entertainment
Where This Cadence Hits a Wall
The 4-Block framework works well for stores under $500K/month using Shopify Analytics alone. But it has structural limits:
It takes 45-60 minutes of manual dashboard navigation every week
It can't include ad spend data (Meta, Google) because Shopify doesn't have it
It can't show true profitability because financial data lives in Xero or QuickBooks
It doesn't flag anomalies proactively - you only see problems when you look
This is exactly why founders are drowning in data without getting the clarity they need to act.
How Luca AI Replaces Manual Cadence With Proactive Intelligence
Luca AI automates this entire review by continuously monitoring your Shopify, Meta, Google, Stripe, and Xero data. Instead of spending 45 minutes navigating dashboards, you ask: "Give me my weekly performance summary including marketing efficiency and margin by channel." You get the full cross-functional picture in seconds.
Even better: Luca surfaces anomalies before your Monday review. If CAC spiked on Thursday, you know Friday morning - not the following Monday. That's the difference between reactive cadence and proactive intelligence. Discover how Luca thinks to understand the reasoning architecture behind real-time anomaly detection.
Q11. Can Shopify Analytics Handle Multi-Store, International, or B2B Reporting? [toc=Multi-Store and B2B Limits]
As Shopify merchants expand into multi-store operations, international markets, or B2B wholesale channels, their reporting needs outgrow what native analytics was designed for. Shopify Analytics was built for single-store, single-currency, DTC operations - and that architectural assumption creates real blind spots at scale.
Multi-Store Reporting
Many brands operate multiple Shopify stores - separate stores for different regions (US, EU, APAC), brands, or channels (DTC vs. wholesale). Shopify Analytics treats each store as an entirely independent data silo.
What this means in practice:
No consolidated dashboard across stores
No way to compare performance between stores natively
Inventory reporting is per-store only - you can't see total inventory across locations within analytics
Customer data doesn't merge - a customer who buys from your US and EU stores appears as two separate people
The workaround most merchants use: manual CSV exports from each store, merged in Google Sheets or Excel. This is time-consuming, error-prone, and always out of date by the time the spreadsheet is complete.
International and Multi-Currency Reporting
Shopify supports multi-currency selling through Shopify Markets, but analytics reporting has significant gaps:
Revenue is reported in your store's base currency, with conversions calculated at the time of order - but exchange rate fluctuations between order date and payout date aren't reflected
You can't filter reports by customer currency to understand regional purchasing behavior
Tax reporting varies by jurisdiction and doesn't integrate with local accounting requirements
Shopify Markets analytics show basic performance by region, but can't connect that to ad spend or marketing costs per market
For EU merchants dealing with VAT across multiple countries, the gap between Shopify's reporting and actual financial management requirements is substantial. Being able to calculate working capital across international operations demands data Shopify simply doesn't surface.
B2B and Wholesale Reporting
Shopify's B2B features (introduced in 2023 and expanded through 2025) allow wholesale pricing, company accounts, and net payment terms. But B2B analytics remain limited:
No dedicated B2B dashboard separating wholesale from DTC performance
No reporting on payment term utilization (e.g., what percentage of B2B orders use Net 30 vs. Net 60)
No accounts receivable aging report - critical for managing B2B cash flow
Limited ability to analyze B2B customer profitability including volume discounts and custom pricing
How Luca AI Solves Cross-Entity Reporting
Luca AI connects to multiple Shopify stores, multiple ad accounts, and multiple financial systems simultaneously. Ask "Show me total revenue across all stores this month, broken down by region and channel" and get a unified answer in seconds - no CSV exports, no spreadsheet merging, no stale data.
For international operations, Luca normalizes multi-currency data and connects it to regional ad spend and local accounting systems. For B2B, Luca integrates Shopify's wholesale data with Xero or QuickBooks to surface accounts receivable aging, payment term analysis, and true customer profitability by segment.
This cross-entity visibility is what allows scaling brands to make decisions based on the full picture - not the fragmented view each individual platform provides. Explore all Luca AI use cases to see how unified intelligence works across every function.
Q12. How Does Luca AI Extend Shopify Analytics Into a Full Business Intelligence Layer? [toc=Luca AI Intelligence Layer]
Throughout this guide, we've identified the structural boundaries of Shopify Analytics: no ad spend integration, no financial system connectivity, last-click attribution only, plan-gated reporting, no predictive capabilities, and no action layer. These aren't bugs - they're the natural limits of a commerce platform's built-in reporting.
Luca AI was purpose-built to fill exactly these gaps - not by replacing Shopify Analytics, but by extending it into a full cross-functional business intelligence layer that connects commerce, marketing, finance, and capital into a single reasoning engine.
What Luca AI Connects That Shopify Can't
The Conversational Interface: Ask, Don't Navigate
The fundamental difference between Luca AI and every dashboard tool - including Shopify Analytics, Triple Whale, Northbeam, and Polar - is the interaction model. Dashboards require you to navigate, filter, interpret, and connect dots across screens. Luca requires you to ask a question.
Example queries Luca AI can answer that no Shopify report can:
"What's my true contribution margin by channel including ad spend and COGS?"
"Which products are profitable after all costs, and which are losing money?"
"How much can I increase Meta spend before CAC exceeds my LTV threshold?"
"What's my 90-day cash flow forecast based on current inventory and sales velocity?"
"Show me customer cohort LTV by acquisition channel for the last 6 months"
Luca AI doesn't wait for you to ask. It continuously monitors your connected data sources and surfaces insights proactively:
🚨 Anomaly detection - "Your Meta CPA increased 23% over the last 3 days. Here's which ad sets are driving the spike."
📉 Trend alerts - "Returning customer rate has declined for 4 consecutive weeks. This will impact Q2 revenue by an estimated 12% if the trend continues."
💡 Opportunity identification - "Product X has a 68% gross margin and is converting at 2x your store average, but receives only 4% of ad spend. Reallocating budget here could improve blended ROAS by 15-20%."
This shifts analytics from a reactive weekly review to a continuous intelligence feed - the agentic AI for ecommerce founders approach that eliminates the gap between data and action.
The Intelligence-to-Capital Bridge
The most unique capability Luca AI brings to the Shopify ecosystem is embedded capital. When your data reveals a scaling opportunity - a high-performing product, an efficient ad channel, a seasonal demand spike - Luca can surface dynamically-priced growth capital in real time. Read the full intelligence-capital thesis to understand why this bridge matters.
No other analytics tool connects insight to funding. Triple Whale can show you a winning campaign. Northbeam can model its attribution. But neither can fund the scale-up. Luca AI can - and the capital is priced based on actual business performance, not credit scores or blanket interest rates.
Getting Started
Luca AI integrates with any Shopify plan in under 10 minutes via direct API connection. No pixel installation, no theme edits, no developer required. Connect your Shopify store, your ad accounts, and your accounting system - and start asking questions immediately.
Can Shopify Analytics calculate true profit after ad spend and fees?
No, Shopify Analytics cannot automatically calculate true contribution margin because it doesn't integrate with your ad platforms or payment processors by default.
What Shopify Shows:
Gross sales revenue
COGS (if manually entered per product)
Basic discount impact
Refund adjustments
What's Missing:
Meta and Google ad spend (lives in separate platforms)
Payment processing fees from Stripe or PayPal
Shipping costs from fulfillment apps
Multi-platform correlation for true profit per channel
Manual Workaround: You must export data from Shopify, Meta Ads Manager, Google Ads, Stripe, and your accounting software, then manually calculate: Revenue - COGS - Ad Spend - Payment Fees - Shipping - Discounts = True Profit. For €1M+ brands, this manual process consumes 10-15 hours weekly.
Automated Solution: We built Luca AI specifically to solve this fragmentation - automatically integrating Shopify sales data with Meta/Google ad spend, Xero/QuickBooks COGS, and Stripe fees to deliver real-time contribution margin by product, channel, and campaign without spreadsheet pivots.
What Shopify Analytics features require the Advanced plan ($399/month)?
Professional Reports - the advanced analytics features - are only available on Advanced Shopify ($399/month) or Shopify Plus ($2,000+/month).
Available on All Plans ($39-$105/month):
Standard reports (Sales, Customers, Marketing, Finance, Behavior)
Dashboard overview with real-time metrics
Custom date ranges and basic filtering
Manual CSV/Excel exports
90 days to 2 years data retention
Requires Advanced Plan ($399+/month):
Custom report builder (combining multiple data dimensions)
Decision Framework: If you need automated reporting sent to your team weekly, custom multi-dimensional analysis (e.g., "Sales by Product by Traffic Source by Discount Code"), or advanced customer segmentation, the Advanced plan is required.
Alternative Approach: Rather than upgrading solely for Professional Reports, many €1M+ brands deploy unified intelligence platforms that provide conversational analytics across Shopify, Meta, Google Ads, and financial systems - delivering deeper insights than Professional Reports at comparable or lower cost.
Why do my Shopify sales numbers differ from Google Analytics by 10-20%?
This variance is normal and expected due to five fundamental architectural differences between platforms.
Root Causes of Discrepancy:
Tracking Method: Shopify uses server-side tracking (captures 100% of transactions at checkout), while GA4 uses client-side JavaScript (blocked by 15-25% of users via ad blockers, privacy tools, disabled JavaScript).
Attribution Windows: Shopify defaults to 30-day click / 1-day view attribution; GA4 uses data-driven attribution with 90-day lookback - crediting the same sale to different timeframes.
Which to Trust: Use Shopify as your revenue source of truth for financial reporting, P&L statements, and tax calculations. Use GA4 for pre-purchase behavior analysis and user journey mapping.
Unified Solution: We designed Luca AI to automatically reconcile both platforms, using Shopify for accurate revenue calculations and GA4 for behavioral insights - selecting the right source for each query type without you needing to remember data governance rules.
How can I track which marketing campaigns are actually profitable in Shopify?
Shopify's native attribution shows which campaigns drive revenue, but not which campaigns are profitable after accounting for their costs.
What Shopify Analytics Provides:
Analytics > Marketing > Sales by Marketing Campaign shows attributed revenue by campaign name (requires UTM parameters)
Last-touch attribution only (credits final touchpoint before purchase)
No integration with ad spend data from Meta, Google, TikTok, or other platforms
The Profitability Gap: To determine true campaign ROI, you need: Campaign Revenue (Shopify) - Campaign Ad Spend (Meta/Google) - Attributed COGS (accounting system) - Payment Fees (Stripe) = Campaign Profit. Shopify cannot perform this calculation because ad spend and fees live in separate, disconnected platforms.
Manual Process:
Export Shopify: Sales by Marketing Campaign
Export Meta Ads Manager: Ad spend by campaign
Export Google Ads: Ad spend by campaign
Export accounting software: COGS per product
Build spreadsheet correlating all four sources
Calculate contribution margin per campaign
Time Investment: 4-8 hours monthly for multi-channel brands managing 10+ campaigns.
Automated Intelligence: We built Luca AI's marketing analysis capabilities to automatically synthesize Shopify revenue, Meta/Google ad spend, and COGS data - delivering instant answers to queries like "Which campaigns in Q4 had >3x ROAS and positive contribution margin?" without manual correlation.
What are the biggest mistakes e-commerce brands make with Shopify Analytics?
Seven data interpretation errors cost scaling brands €23,000-€65,000 annually in suboptimal decisions.
Most Common Mistakes:
1. Not Filtering Test Orders - Internal testing inflates conversion rates and product performance, making failing products appear successful.
2. Ignoring Discount Impact on Margin - A product showing €10K revenue may have only €7K net after 30%-off codes, dramatically reducing profitability.
3. Misunderstanding Last-Touch Attribution - Shopify credits final touchpoints, systematically undervaluing awareness channels (Facebook, display) while overvaluing bottom-funnel (branded search, email). Cutting "underperforming" Facebook spend often crashes revenue 3-7 days later as top-of-funnel dries up.
4. Timezone Mismatches - Comparing Shopify (EST), GA4 (PST), and Meta (UTC) creates artificial 15-20% daily variances and reconciliation nightmares.
5. Treating Sessions as Unique Visitors - Dividing revenue by sessions (not unique visitors) artificially deflates per-customer metrics by 30-40%.
6. Not Segmenting by Sales Channel - Blending online, wholesale, POS, and marketplace sales creates misleading averages that destroy profitability when optimized incorrectly.
7. Ignoring Return Rate Impact - Gross sales of €50K with 25% returns means actual net revenue of €37.5K - restocking based on gross figures creates €3,750+ excess inventory.
Prevention Architecture: We designed Luca AI to eliminate these errors by default - automatically filtering test orders, calculating true margin including all fees, using multi-touch attribution, standardizing timezones, distinguishing sessions from visitors, segmenting channels appropriately, and factoring return rates into all inventory recommendations.
Enjoyed the read? Join our team for a quick 15-minute chat — no pitch, just a real conversation on how we’re rethinking Ecommerce with AI - Luca
Loading Schedule...
Your AI Co-Founder is here.
Here’s why:
Shopify, Meta, Xero - one brain.
"Should I scale?" Answered with real data.
Growth capital. No applications. One click.
Thank you! Your submission has been received! Please book a time slot for the Meeting
Oops! Something went wrong while submitting the form.
.jpg)