Ecommerce Website Analytics: Best Tools, Tracking Methods, and Metrics for DTC Brands (2026)
11
mins read
In this article
TL;DR
Traditional analytics tools (GA4, Triple Whale) create dashboard chaos across 8-12 platforms requiring 10-15 hours weekly manual data consolidation without cross-functional insights.
Post-iOS 14.5 tracking requires server-side methods: Meta CAPI, first-party data, probabilistic attribution, and unified commerce data recover 20-40% attribution loss.
Critical profitability metrics (contribution margin, LTV:CAC, cohort trends) reveal 67% of brands scale revenue-positive but cash-negative campaigns without realizing it.
Build-vs-buy analysis shows unified AI platforms (Luca AI) save 81-93% vs custom stacks or fragmented dashboards over 3 years.
Cross-platform attribution solves 30-50% revenue overlap when platforms claim duplicate credit through ML-powered multi-touch models and blended MER tracking.
Proactive AI intelligence monitors 24/7 and surfaces risks/opportunities automatically vs reactive dashboards requiring manual checking creating 12-48 hour blindness windows.
Q1. What Are The 4 Types of Ecommerce Analytics (And Which Does Your Business Actually Need)? [toc=4 Types of Analytics]
Four distinct analytics categories serve different decision-making needs in ecommerce, yet most DTC brands only cover 1-2 while suffering critical blind spots in the others. Behavioral Analytics tracks what customers do on your site (pageviews, session duration, user flows, heatmaps (tools like GA4, Hotjar). Marketing Attribution Analytics connects ad spend to revenue, answering which channels and campaigns drive conversions (Triple Whale, Polar Analytics). Financial/Profitability Analytics reveals true unit economics by integrating commerce data with accounting systems to calculate contribution margin, LTV, and cash runway (requires synthesizing Shopify + Stripe + Xero data). Operational Analytics monitors inventory velocity, fulfillment efficiency, and supply chain health.
⚠️ The Coverage Gap Problem
Most DTC brands have solid coverage of behavioral and attribution analytics (93% use GA4 or Shopify Analytics for traffic tracking) but severe gaps in financial and operational intelligence. This creates a dangerous scenario: marketing dashboards report "success" with strong ROAS, while finance sees negative cash flow because no single platform connects Meta spend + Shopify orders + COGS to show real profitability after all costs.
"My store's analytics tells me one story, but my actual orders tell another. My conversion rates move without a clear reason, my store's traffic appears robust yet fails to convert... I've begun to doubt whether the dashboards accurately represent the true state of my business." — u/Long-Guitar647, r/ecommerce Reddit Thread
The specific gaps by category:
Behavioral Analytics (93% Covered): High traffic doesn't equal profitable traffic (behavior data rarely connects to profitability metrics)
Marketing Attribution (67% Covered): iOS 14.5+ created 20-40% attribution loss; most tools can't model probabilistic attribution or cross-device journeys
Financial Analytics (23% Covered): Marketing and finance data live in separate systems (only 23% of sub-€5M brands calculate true contribution margin by channel)
Operational Analytics (Manual for 78%): No proactive alerts when sell-through velocity changes or stockouts loom; most brands discover inventory issues only after customer complaints
✅ Unified Intelligence vs. Fragmented Tools
Luca AI addresses Category #3 and #4 gaps by unifying commerce (Shopify), marketing (Meta, Google), and financial data (Xero, Stripe) into cross-functional intelligence. Instead of spending 10-15 hours weekly exporting CSVs and triangulating data across platforms, ask conversationally: "Show contribution margin by product and channel for Q4 cohorts" (a query spanning multiple analytics categories that no dashboard-based tool can answer because they silo data by domain).
Coverage Self-Assessment: Audit your current stack (can you answer "What's my contribution margin by acquisition channel?" in under 60 seconds? If not, you have a Category #3 gap. If you discover stockouts only through customer complaints rather than proactive alerts, you have a Category #4 gap. Unified platforms eliminate the manual data triangulation consuming 10-15 hours weekly.
Inverted funnel diagram illustrating how ecommerce website analytics achieves unified intelligence — from data integration across commerce, marketing, and finance to proactive alert delivery for DTC brands.
"Triple Whale is currently the leading choice for Shopify users. However, I believe that unless your advertising budget exceeds $10,000 per month, it might just be an expensive way to waste money. Shelling out $300 monthly just for a more visually appealing dashboard seems excessive." — u/Admirable-Magician58, r/ecommerce Reddit Thread
Most founders go from 2-3 coverage checks (behavioral + attribution only) to 7/7 within the first week of deploying cross-functional analytics that span all four categories simultaneously.
Q2. Google Analytics 4 vs. Shopify Analytics vs. Specialized Ecommerce Platforms: Which Should You Use? [toc=Platform Comparison]
The analytics platform decision splits into three paths: Google Analytics 4 (free, marketing-focused, requires technical setup), Shopify Analytics (built-in, zero setup, Shopify-only data), or Specialized ecommerce intelligence platforms (Triple Whale, Polar Analytics, Luca AI (unified cross-platform data with varying depth). 89% of DTC brands start with GA4 + Shopify Analytics because they're free/included, then hit walls when scaling requires cross-functional insights those tools can't provide. The question isn't which is "best" (it's which combination fits your current stage and complexity.
Platform-by-Platform Analysis
Google Analytics 4 ✅ Strengths: Free for most use cases, deep user behavior tracking, Google Ads integration, BigQuery export for advanced analysis, massive documentation community ❌ Weaknesses: (1) Marketing and website behavior only (no connection to financial data (COGS, contribution margin, cash flow), (2) Complex setup requiring Google Tag Manager expertise and 2-3 week implementation, (3) No proactive insights (purely reactive dashboard you must manually check, (4) iOS tracking severely limited even with Enhanced Conversions, (5) Can't answer cross-functional queries spanning commerce + marketing + finance
"GA4 is a disaster. It is so much harder to use than UA, and completely non-intuitive. It is nearly impossible to drill down by clicking as was possible in UA. It is the Windows Vista of Google Analytics, and all the cognoscenti are afraid to say publicly that it is garbage. But everyone knows it is garbage." — Anonymous Marketing Director, Search Engine Land
"No way to group dates by weeks, months or years. Goodbye analysing conversion rates over time easily. Mind boggling. The line chart breakdown at the top of reports are a terrible decision." — u/[deleted], r/GoogleAnalytics Reddit Thread
Best for: Brands with dedicated analytics teams prioritizing granular user journey analysis and heavy Google Ads spend.
Shopify Analytics ✅ Strengths: Zero setup (built-in), mobile app access, sales and order data automatically tracked, sufficient for basic store monitoring ❌ Weaknesses: (1) Shopify-only data (doesn't see Meta/Google ad spend, email performance, or accounting data, (2) No custom queries or API access on basic plans, (3) Limited retention and cohort analysis, (4) No multi-touch attribution, (5) No alerts or proactive monitoring
Best for: €0-€500K brands needing quick sales dashboards without technical setup.
🎯 Specialized Ecommerce Platforms
This category splits into marketing-focused dashboards (Triple Whale, Polar Analytics) and unified intelligence platforms (Luca AI).
Marketing Dashboards (Triple Whale, Polar): ✅ Aggregate Meta, Google, TikTok data with better attribution than GA4 ❌ Still don't connect to financial/operational data (can't calculate contribution margin)
"Our experience with Triple Whale has been extremely frustrating and almost categorically terrible. The integrations are inconsistent, building with the AI tool Moby is very buggy and crashes more than half the time, and support is largely unresponsive and not helpful." — Matt Huttner, Trustpilot Verified Review
Luca AI: ✅ Unifies commerce + marketing + finance + operations; conversational AI interface eliminates dashboard navigation; proactive 24/7 monitoring; embedded capital access when opportunities identified ❌ Newer platform with evolving feature set
Sufficient for validation stage; add specialized tools only when running 3+ paid channels
€500K-€5M
Add Luca AI (€499/mo) or Marketing Dashboard (€250-€399/mo)
Need cross-functional visibility; Luca provides financial integration that dashboards lack
€1M-€50M
Luca AI (unified intelligence + capital) OR GA4 + Marketing Dashboard + Separate RBF
Unified approach saves 60-75% vs. fragmented stack
€20M+
Luca AI OR Enterprise BI Stack (Looker + Snowflake)
Choose based on: need custom data models (enterprise BI) vs. conversational intelligence + capital (Luca AI)
Most sophisticated operators use hybrid: GA4 for deep behavior analysis + Luca AI as the unified cross-functional intelligence layer with embedded capital access (leveraging GA4's free granular tracking while avoiding the 10-15 hours weekly manual data consolidation.
Q3. The 20+ Essential Ecommerce Metrics DTC Brands Must Track (With Formulas and 2026 Benchmarks) [toc=Essential Metrics]
Metrics must be organized by customer journey stage (Discovery → Acquisition → Conversion → Retention → Profitability) and segmented by business maturity. Foundational metrics for €0-€1M brands (10 total) focus on validation: proving unit economics work. Advanced metrics for €1M-€10M+ scaling brands (20+ total) add cohort analysis, channel-specific contribution margin, and predictive LTV modeling. The critical distinction: vanity metrics (revenue, traffic, ROAS without context) vs. profitability metrics (contribution margin, payback period, true LTV after returns/support costs). 73% of sub-€5M DTC brands track vanity metrics religiously but can't calculate contribution margin by channel (leading to scaling "successful" campaigns that drain cash).
💰 Comprehensive Metrics by Category
Acquisition Metrics
Customer Acquisition Cost (CAC) = Total Marketing Spend ÷ New Customers Acquired | 2026 Benchmark: €25-€75 depending on AOV
Cost Per Acquisition (CPA) = Campaign Spend ÷ Conversions | Benchmark: €15-€50 for conversion-optimized campaigns
Marketing Efficiency Ratio (MER) = Total Revenue ÷ Total Marketing Spend | Benchmark: 3.0-5.0x for healthy brands
Blended CAC = Total Marketing Spend ÷ Total New Customers (all channels) | Use for holistic acquisition cost visibility
Click-Through Rate (CTR) | Benchmark: 1.5-3% for Meta ads, 3-5% for Google Search
Cost Per Click (CPC) | Varies by channel/niche; track trends over time
Conversion Metrics
Conversion Rate = Orders ÷ Sessions × 100 | Benchmark: 2-4% for cold traffic, 8-12% for email/retargeting
Average Order Value (AOV) = Total Revenue ÷ Number of Orders | Track by channel and cohort
Cart Abandonment Rate = Abandoned Carts ÷ Initiated Checkouts × 100 | Benchmark: 60-75% industry average
Customer Lifetime Value (LTV) = Average Order Value × Purchase Frequency × Customer Lifespan | Calculate for cohorts, not aggregates
Repeat Purchase Rate = Customers with 2+ Orders ÷ Total Customers × 100 | Benchmark: 25-40% within 90 days
Cohort Analysis = Track monthly cohorts' purchasing behavior over time (Month 0, 3, 6, 12 revenue per customer)
Churn Rate = Customers Lost ÷ Total Customers at Period Start × 100
Net Promoter Score (NPS) = % Promoters - % Detractors
⚠️ Common Measurement Errors
Error #1: Attribution Discrepancy Using last-click attribution ignores multi-touch customer journeys. Meta reports 20% more conversions than Shopify due to iOS tracking loss. Correction: Use server-side order data as source of truth, treat platform reporting as directional.
Error #2: Revenue vs. Profit Confusion Tracking revenue without COGS inflates perceived profitability. Correction: Always calculate contribution margin = Revenue - COGS - Ad Spend - Transaction Fees - Shipping.
Error #3: Ignoring Returns Calculating LTV without factoring return rates (15-30% for apparel). Correction: LTV = (AOV × Purchase Frequency × Lifespan) × (1 - Return Rate).
Error #4: Aggregate vs. Cohort Analysis Using aggregate metrics hides performance degradation over time. Correction: Always segment by monthly cohorts to track retention trends.
Profitability Metrics (Most Critical, Least Tracked)
Contribution Margin = Revenue - COGS - Ad Spend - Transaction Fees - Shipping | The most important metric most brands don't track
Contribution Margin by Channel = CM segmented by acquisition source
Payback Period = CAC ÷ Contribution Margin per Order | How long to recoup acquisition cost
LTV:CAC Ratio = Lifetime Value ÷ Customer Acquisition Cost | Benchmark: Minimum 3:1, ideal 5:1+
Cash Conversion Cycle = Days Inventory Outstanding + Days Sales Outstanding - Days Payables Outstanding
Inventory Turnover = COGS ÷ Average Inventory Value
Return Rate = Returns ÷ Total Orders × 100 | Must factor into LTV calculations
Monthly Recurring Revenue (MRR) for subscription models
Add: Repeat Purchase Rate, 90-day LTV, CAC by Channel, Contribution Margin, MER, Payback Period
Identify what to scale
Scaling
€5M+
Full 20+ suite including Cohort LTV projections, CM by Channel/Cohort, Inventory Turnover, Cash Conversion Cycle, Scenario Modeling
Optimize entire business system
✅ Luca AI Automation Benefit
Luca AI calculates all 25 metrics automatically across connected data sources (Shopify, Meta, Google, Stripe, Xero), eliminating manual spreadsheet reconciliation and formula errors. Cross-functional queries like "Show me contribution margin by cohort and acquisition channel for Q4 2025" synthesize data across commerce, marketing, and accounting systems in real-time (calculations that would take 3-4 hours manually happen in 5 seconds conversationally. No exports, no formulas, no errors.
Analytics platform landscape segments into 5 categories: (1) General Web Analytics (GA4, Adobe Analytics), (2) Native Ecommerce Reporting (Shopify Analytics, WooCommerce Reports), (3) Marketing Attribution Dashboards (Triple Whale, Polar Analytics), (4) Product/Behavioral Analytics (Mixpanel, Amplitude), (5) Unified Intelligence + Capital Platforms (Luca AI). This review covers 10 platforms across all categories, evaluated on data source breadth, intelligence depth (passive dashboards vs. AI reasoning), setup complexity, query interface, and pricing transparency.
🔍 Platform #1: Google Analytics 4
Best for: Granular user behavior tracking and Google Ads attribution
Strengths: ✅ Free (up to 10M events/month), comprehensive event tracking, funnel visualization, BigQuery export, massive documentation Weaknesses: ❌ Marketing/website behavior only (no financial data (COGS, cash flow, contribution margin), complex setup requiring Google Tag Manager and 2-3 week implementation, iOS 14.5+ tracking severely limited, no proactive insights, steep learning curve
"The platform still has a lot of bugs, and we find ourselves spending more time figuring out why attribution is not properly labeled and why the data is inconsistent." — John McAlpin, SEO Consultant, Search Engine Land
Pricing: Free (basic) | €50K-€150K+/year (Analytics 360) Best for: Brands with dedicated analytics teams, heavy Google Ads spend
🔍 Platform #2: Shopify Analytics
Best for: Basic store performance monitoring with zero setup
Strengths: ✅ Built into Shopify admin, zero configuration, mobile app access, tracks sales/orders/customers automatically Weaknesses: ❌ Shopify-only data (doesn't see Meta/Google ad spend, email, or accounting), no API access or custom queries on Basic plan, limited cohort analysis, last-click attribution only, no proactive monitoring
Pricing: Included with Shopify subscriptions Best for: €0-€500K Shopify brands needing quick sales snapshots
🔍 Platform #3: Triple Whale
Best for: Marketing dashboard consolidation across paid channels
Strengths: ✅ Pre-built dashboards aggregating Meta, Google, TikTok, Pinterest data; unified ROAS reporting; Slack integration; multi-touch attribution modeling Weaknesses: ❌ Marketing metrics only (no financial (P&L, contribution margin) or operational data, dashboard-based (no conversational queries), no action capabilities, data discrepancies between Triple Whale and platform reporting (5-15% variance common)
"Terrible customer support, I pay them thousands of dollars and get no support, customer support is unresponsive. Integrations keep falling off." — Ahad Beauty, Trustpilot Verified Review
"The attribution system is consistently buggy and unreliable, causing more harm than good. Not worth the investment if you value accurate data and dependable support." — Henry Phan, Trustpilot Verified Review
Pricing: €129-€399/month depending on revenue tier Best for: €1M-€10M DTC brands with dedicated marketing teams focused on paid acquisition
🔍 Platform #4: Polar Analytics
Best for: Shopify-native attribution and automated reporting
Strengths: ✅ Multi-touch attribution across channels, beautiful automated report generation, Shopify-specific optimization, cleaner data modeling than GA4 Weaknesses: ❌ Commerce + marketing only (no financial or operational integration), Shopify-focused (WooCommerce support limited), still dashboard-based requiring manual analysis
"Not impressed compared to price point. The pricing communicated when installing the app via Shopify was completely different from the one provided by sales after the installation which was much higher. However, when you pay that amount of money, you expect a flawless product which isn't the case." — Ben S., Director of Commercial Operations, Trustpilot Review
Pricing: €250-€750/month based on monthly orders Best for: Shopify-exclusive brands at €1M-€10M needing better attribution
🔍 Platform #5: Mixpanel
Best for: Product analytics and user behavior tracking
Strengths: ✅ Event-based tracking architecture, excellent cohort and funnel analysis, user segmentation, retention analysis Weaknesses: ❌ Focused on product/app usage not commerce metrics, complex pricing based on monthly tracked users (MTU), requires development resources for event schema setup
Pricing: Free (up to 20M events) | €24-€833+/month depending on MTU Best for: DTC apps or brands with complex product engagement
🔍 Platform #6: Matomo
Best for: Privacy-first, self-hosted analytics
Strengths: ✅ GDPR-compliant by design, full data ownership (self-hosted option), no data sampling, GA4 alternative for privacy-conscious brands Weaknesses: ❌ Self-hosting requires server management, limited ecommerce-specific features, smaller ecosystem than GA4
Pricing: Free (self-hosted) | €23-€74/month (cloud-hosted) Best for: EU-based brands prioritizing data sovereignty and GDPR compliance
🔍 Platform #7: Hotjar
Best for: Qualitative user experience insights
Strengths: ✅ Heatmaps showing click patterns, session recordings, on-site surveys, feedback widgets, easy setup Weaknesses: ❌ Qualitative only (no quantitative metrics like revenue, CAC, LTV), supplements rather than replaces quantitative analytics, expensive at scale
Pricing: Free (35 sessions/day) | €32-€171+/month Best for: CRO-focused brands optimizing landing pages and checkout flows
🔍 Platform #8: Luca AI
Best for: Unified intelligence spanning commerce, marketing, finance, and operations with embedded capital access
Strengths: ✅ Only platform connecting commerce + marketing + finance + operations into one reasoning layer, conversational AI interface eliminating dashboard navigation and SQL requirements, cross-functional queries spanning multiple data sources, proactive 24/7 monitoring surfacing risks/opportunities automatically, action capabilities (can pause ads, generate forecasts), embedded growth capital (when AI identifies opportunities it can fund them instantly), 10-minute no-code setup vs. weeks for GA4 implementations, flat pricing that scales with business Weaknesses: ❌ Newer platform with evolving feature set compared to decade-old incumbents
Pricing: €499/month flat + dynamic capital pricing based on business health Best for: €1M-€100M DTC brands experiencing 'dashboard chaos' across 8+ fragmented tools, seeking cross-functional intelligence without hiring data engineering teams, wanting capital access when growth opportunities identified
Unique Positioning: Luca AI is the only platform that both analyzes opportunities AND can fund them (intelligence and capital unified.
📊 Comparison Matrix
Analytics Platform Feature Comparison
Platform
Data Sources
Intelligence Type
Setup Time
Financial Integration
Proactive Alerts
Capital Access
Price Range
GA4
Marketing + Web
Passive Dashboard
2-3 weeks
❌
Manual only
❌
Free-€150K
Shopify Analytics
Commerce
Passive Dashboard
0 min
❌
❌
❌
Included
Triple Whale
Commerce + Marketing
Passive Dashboard
1-2 hours
❌
Limited
❌
€129-€399
Polar Analytics
Commerce + Marketing
Passive Dashboard
1 hour
❌
Limited
❌
€250-€750
Mixpanel
Product/App Behavior
Passive Dashboard
1-2 weeks
❌
Limited
❌
€0-€833+
Matomo
Marketing + Web
Passive Dashboard
1-3 days
❌
Limited
❌
€0-€74
Hotjar
Qualitative UX
Passive Recording
30 min
❌
❌
❌
€0-€171+
Luca AI
Commerce + Marketing + Finance + Ops
Active AI Reasoning
10 min
✅ Full P&L
✅ 24/7 Automated
✅ Embedded
€499 flat
✅ Selection Guidance
Choose GA4 if: You need granular user behavior analysis, run Google Ads heavily, have analytics team for setup/maintenance Choose Triple Whale/Polar if: You're €1M-€10M, focused on paid acquisition optimization, have marketing team to interpret dashboards Choose Luca AI if: You're €1M+ revenue, juggling 8+ fragmented tools, need cross-functional answers spanning marketing and financial performance, lack in-house data team, want proactive intelligence surfacing opportunities/risks automatically, or want capital access when growth opportunities identified
Q5. Modern Ecommerce Tracking Methods That Actually Work in 2026 (Post-iOS 14.5 Era) [toc=Modern Tracking Methods]
The tracking landscape fundamentally changed between 2021-2026: iOS 14.5 (April 2021) introduced App Tracking Transparency requiring opt-in for cross-app tracking (60-70% of iOS users declined), iOS 17 (September 2023) added Link Tracking Protection stripping URL parameters, Chrome announced third-party cookie deprecation for 2024-2025 (delayed to 2025-2026), and GDPR/ePrivacy enforcement intensified across EU markets. The result: traditional pixel-based tracking broke. Meta Ads Manager lost 15-30% attribution visibility, Google Analytics 4 struggles with cross-device journeys, and last-click attribution models misrepresent multi-touch customer paths. Brands tracking €100K monthly ad spend now see 20-40% of conversions as "unknown source" in platform dashboards despite knowing orders occurred.
Traditional client-side tracking (JavaScript pixels firing from user's browser) is now blocked by iOS, Safari Intelligent Tracking Prevention (ITP), and browser privacy features. Server-side tracking (your server sends conversion data directly to ad platforms via API) bypasses browser restrictions because data flows server-to-server, not through user's device.
The Five Tracking Methods in 2026:
1. Enhanced First-Party Data Collection Collecting data directly from your owned properties (website, app, email) rather than third-party cookies. Implementation: Shopify customer accounts, email capture, SMS opt-ins, loyalty programs. Why it works: First-party cookies (same-domain) aren't blocked by browsers; you own the relationship. Limitation: Only tracks behavior on your properties, misses pre-website touchpoints (which ad they clicked before visiting).
2. Server-Side Conversion Tracking (CAPI + Server GTM) Meta Conversions API (CAPI), Google Enhanced Conversions, and TikTok Events API send conversion data from your server to ad platforms. Setup complexity: Moderate to high (requires developer or platforms like Luca AI that handle implementation automatically). Benefits: 20-40% more conversions attributed vs. pixel-only tracking, improved ad platform algorithm optimization (more complete data = better targeting), reduces iOS attribution loss. Implementation: Install Facebook Pixel + configure CAPI to send duplicate server-side events, or use Shopify's native CAPI integration, or use platforms that automate this.
Balance scale comparing client-side and server-side ecommerce website tracking methods across browser restrictions, data collection accuracy, and setup complexity for DTC brand decision-making.
"Most agencies charge overpriced retainers for work that's not deserving of a retainer." — u/low5d7k, r/SEO Reddit Thread
3. Probabilistic Multi-Touch Attribution (MTA) Machine learning models that use aggregate patterns rather than individual user tracking to attribute conversions. How it works: Platforms like Northbeam and Luca AI analyze spend increases correlated with sales increases across time periods, inferring causality without cookies. Example: If Meta spend increases €1K on Day 1 and sales increase €4.2K on Days 1-3 (matching historical lag patterns), ML models attribute proportional credit. Advantage: Privacy-compliant (no personal data required), works despite iOS/cookie restrictions. Limitation: Less granular than pre-2021 tracking, but far superior to broken pixel-only approaches.
4. Unified Commerce Data as Attribution Source of Truth Using actual order data from Shopify/commerce platforms as the authoritative conversion record, then triangulating backwards to ad exposure. Implementation: Luca AI synthesizes Shopify orders (definitive source of "a sale happened") + Meta/Google campaign exposure data + customer journey timestamps to build complete attribution picture. Why it works: Ecommerce platforms see 100% of orders (no iOS blocking), even if ad platforms miss attribution, you still know revenue occurred. Triangulation: Match order timestamps to campaign activity windows to infer attribution when platform reporting is incomplete.
5. Incrementality Testing and Marketing Mix Modeling (MMM) Statistical approaches measuring campaign impact by comparing test groups (exposed to ads) vs. control groups (not exposed). Geo-holdout tests: Run campaigns in 80% of markets, hold out 20%, compare sales lift. Time-based holdouts: Pause channel entirely for 2 weeks, measure revenue decline. MMM: Econometric modeling analyzing historical data to determine each channel's contribution. Best for: Brands spending €50K+/month with enough volume for statistical significance. Used by: Enterprise brands and sophisticated DTC operators using platforms like Northbeam or custom analytics implementations.
✅ Recommended Stack by Business Stage
€0-€500K Revenue: First-party data collection + GA4 (free) + Shopify Analytics. Avoid: Over-investing in complex tracking before proving product-market fit.
€500K-€5M Revenue: Add server-side tracking (Meta CAPI + Google Enhanced Conversions) + consider unified intelligence platforms that automate cross-platform synthesis. Priority: Improve ad platform optimization with complete conversion data.
€5M-€20M Revenue: Implement full probabilistic MTA (Northbeam, Luca AI) or Marketing Mix Modeling if spending €100K+/month on ads. Advanced: Incrementality testing for major campaigns (geo-holdouts).
€20M+ Revenue: Enterprise MMM + data warehouse (Snowflake) + custom BI layer + incrementality testing as standard practice.
💡 Practical Implementation Checklist
For brands experiencing attribution gaps between Meta Ads Manager (reports X conversions) and Shopify (shows Y orders where Y > X):
Implement Meta CAPI alongside existing Pixel (Shopify has native integration or use Luca AI automated setup)
Enable Google Enhanced Conversions (requires first-party data matching: email/phone)
Use Shopify order data as source of truth (not ad platform reporting)
Segment reporting by New vs. Returning customers (returning customers often misattributed due to cookie expiration)
Compare 7-day, 14-day, and 30-day attribution windows (iOS shortened effective windows)
Consider unified platforms that synthesize all data sources rather than relying on single-platform reporting
The era of perfect tracking is over. The new standard is "directionally accurate with multiple verification sources" rather than "pixel-perfect attribution." Brands that adapt to probabilistic, server-side, and first-party methods maintain competitive advantage while competitors struggle with broken tracking.
Q6. How to Calculate True ROAS (Not the Inflated Number Your Ad Platform Shows) [toc=Calculate True ROAS]
Ad platforms (Meta, Google, TikTok) report ROAS that systematically overstates profitability through attribution inflation (claiming credit for sales that would have happened anyway), ignoring costs beyond ad spend (COGS, shipping, transaction fees), and measuring revenue instead of profit. Platform-reported ROAS answers "How much revenue did we generate per ad dollar?" True ROAS answers "How much profit did we generate after all costs?" This distinction determines whether scaling a campaign creates cash or burns it. The gap between platform ROAS and true profitability is why 67% of sub-€10M DTC brands report "strong marketing performance" while experiencing negative cash flow.
📊 The Three Levels of ROAS Calculation
Level 1: Platform ROAS (What Dashboards Show) Formula: Attributed Revenue ÷ Ad Spend Example: Meta reports €10,000 attributed revenue from €2,500 ad spend = 4.0x ROAS Problem: Includes returning customers who would have purchased anyway (organic demand), ignores multi-touch journeys (customer saw Meta ad but converted via Google search), inflated by attribution windows (7-day click, 1-day view capture coincidental purchases).
Level 2: Blended ROAS (Marketing Efficiency Ratio) Formula: Total Revenue ÷ Total Marketing Spend (all channels) Example: €50,000 total revenue ÷ €12,000 total marketing spend (Meta + Google + email + influencer) = 4.17x blended ROAS Advantage: Eliminates inter-channel attribution conflicts, reflects actual marketing investment efficiency. Problem: Still measures revenue, not profit (ignores COGS and other costs).
"The product consistently fails to deliver on its promises. Core functionalities and first-party tracking are buggy or unreliable, yet the team prioritizes releasing new features over fixing what's broken." — Daniele Miccoli, Trustpilot Verified Review
Interpretation: For every €1 spent on ads, you're netting €0.75 in contribution profit. At scale, this campaign loses money because contribution margin doesn't cover fixed costs (salaries, rent, software subscriptions).
Breakeven True ROAS: Must be >1.0x to be sustainable. Target True ROAS of 2.0-3.0x for healthy growth after fixed costs.
🎯 Common ROAS Calculation Mistakes
Mistake #1: Using Revenue Instead of Profit Consequence: Campaigns appear profitable when they're cash-negative. Correction: Always calculate contribution margin ROAS.
Mistake #2: Ignoring Attribution Overlap Multiple platforms claim credit for same sale (Meta says "our ad drove this," Google says "no, our ad did"). Consequence: Sum of platform-reported revenue exceeds actual revenue by 20-40%. Correction: Use blended ROAS or unified attribution platforms that deduplicate conversions.
Mistake #3: Forgetting Variable Costs Transaction fees (2.9%), shipping (€5-€12 per order), and returns (15-30% for apparel) are variable costs that scale with revenue. Consequence: Underestimating cost per order by 10-20%. Correction: Include all variable costs in contribution margin calculation.
Mistake #4: Not Segmenting by Cohort New customer ROAS differs dramatically from returning customer ROAS. Consequence: Overvaluing channels that drive repeat purchases (email) vs. new acquisition (cold Meta ads). Correction: Calculate separate ROAS for new vs. returning customers by channel.
Mistake #5: Measuring at Wrong Time Window Cash impact lags revenue recognition (you pay ad platforms immediately, but might not collect payment for 30-60 days, and COGS hits when inventory ships). Consequence: Cash flow crises despite "profitable" campaigns. Correction: Model cash conversion cycle alongside ROAS.
📈 ROAS Benchmarks by Industry (True Profit ROAS)
True Profit ROAS Benchmarks by Vertical
Industry/Vertical
Target True ROAS
Why
Fashion/Apparel
2.5x - 3.5x
High return rates (20-30%), competitive CAC, thin margins
Luca AI automatically calculates true profit ROAS by connecting Shopify (revenue, orders), Meta/Google (ad spend), Stripe (transaction fees), Xero (COGS), and shipping providers. Ask conversationally: "Show me true profit ROAS by channel for Q4 2025" and Luca synthesizes data across all 5 sources in seconds. No spreadsheets. No manual formula errors. No forgetting to subtract shipping costs. Cross-functional queries like "Which campaigns have ROAS above 3.0x after all costs and positive cash flow impact?" span marketing, finance, and operations data automatically. The analysis that takes 3-4 hours manually in Excel happens in 5 seconds conversationally.
Q7. Cross-Platform Attribution: Solving the "Which Channel Actually Drove This Sale?" Problem [toc=Cross-Platform Attribution]
The attribution problem: Customer sees Instagram ad Monday, searches brand on Google Tuesday, reads email Wednesday, visits site directly Thursday, converts Friday. Who gets credit? Instagram (first touch), Google (middle touch), Email (assisted), or Direct (last touch)? Each platform claims 100% credit, total attributed revenue exceeds actual revenue by 30-50%, and founders can't determine which channels actually drive profitable growth vs. which take credit for inevitable sales. This attribution chaos leads to misallocated budgets (overfunding channels that look good but don't drive incremental sales, underfunding channels with poor last-click attribution but strong assisted conversions). Modern attribution platforms use multi-touch models, machine learning, and cross-platform data synthesis to reveal true channel contribution.
🔍 The Five Attribution Models Explained
1. Last-Click Attribution (Default in Most Platforms) 100% credit to final touchpoint before conversion. Example: Customer journey: Instagram Ad → Google Search → Email → Direct → Purchase. Last-Click gives 100% credit to Direct. Problem: Ignores entire journey; undervalues awareness channels (social, display); overvalues direct/branded search which often captures demand created elsewhere. When to use: Simple businesses with short purchase cycles (< 24 hours, single touchpoint dominant).
2. First-Click Attribution 100% credit to first known touchpoint. Same journey above: 100% credit to Instagram Ad. Problem: Ignores nurturing channels (email, retargeting) essential for conversion; overvalues awareness channels. When to use: Top-of-funnel analysis to understand discovery sources, brand awareness campaigns.
3. Linear Multi-Touch Attribution Equal credit distributed across all touchpoints. Journey with 4 touchpoints: each gets 25% credit. Advantage: Recognizes multi-touch reality. Problem: Treats all touchpoints as equally valuable (awareness impression and checkout retargeting weighted same). When to use: Balanced view when you don't have data to weight touchpoints differently.
4. Time-Decay Multi-Touch Attribution More credit to touchpoints closer to conversion. Example: Instagram 10%, Google 20%, Email 30%, Direct 40%. Logic: Recent interactions have more influence on final decision. Problem: May undervalue early awareness that initiated consideration. When to use: Purchase cycles 3-14 days where recent touchpoints matter more.
5. Algorithmic/Data-Driven Attribution (ML-Powered) Machine learning analyzes thousands of conversion paths to determine credit distribution based on actual incremental contribution. Platforms using this: Google Analytics 4 (limited), Northbeam, Luca AI. How it works: Compares converters vs. non-converters, isolates which touchpoints increased conversion probability. Example: If users exposed to Instagram + Email convert at 4.2% but Instagram-only converts at 1.8%, Instagram gets partial credit but Email gets higher weight. Advantage: Most accurate reflection of true incremental value. Limitation: Requires large data volume (minimum 1,000+ monthly conversions for statistical significance).
Vertical flowchart explaining five ecommerce attribution models DTC brands use — from last-click giving full credit to final touchpoint through algorithmic ML-powered distribution for accurate analytics.
⚠️ The Attribution Overlap Problem
When platforms report independently:
Meta Ads Manager claims: €80,000 attributed revenue
Gap Explanation: Each platform uses last-click or generous attribution windows claiming credit for sales involving any touchpoint. Reality: Most conversions are multi-touch, and platforms don't communicate to deduplicate credit.
📊 Cross-Platform Attribution Solutions
Solution #1: Use Unified Attribution Platform Tools like Northbeam, Polar Analytics, and Luca AI ingest data from all marketing platforms + Shopify orders, deduplicate conversions, and apply multi-touch models. Result: Single source of truth showing "This order involved Instagram Ad → Google Search → Email, distributed credit: Instagram 30%, Google 45%, Email 25%." Benefit: Accurate budget allocation based on true incremental contribution.
Solution #2: Blended Marketing Efficiency Ratio (MER) Formula: Total Revenue ÷ Total Marketing Spend (all channels) Example: €100,000 Shopify revenue ÷ €25,000 total marketing spend = 4.0x blended MER Advantage: Sidesteps attribution arguments, measures aggregate efficiency. Use case: High-level budget setting ("We spend 25% of revenue on marketing, targeting 4.0x return"). Limitation: Doesn't tell you which specific channels to scale/cut.
"Our experience with Triple Whale has been extremely frustrating and almost categorically terrible. The integrations are inconsistent, building with the AI tool Moby is very buggy and crashes more than half the time, and support is largely unresponsive and not helpful." — Matt Huttner, Trustpilot Verified Review
Solution #3: Incrementality Testing Rather than track attribution, measure incremental impact through experiments:
Geo-holdout tests: Run Facebook ads in 80% of markets, hold out 20%, compare sales lift
Time-based holdouts: Pause Google Ads for 2 weeks, measure revenue decline
If pausing channel causes 15% revenue drop, that channel drives 15% of sales (regardless of attribution data)
Advantage: Reveals true causality, not correlation. Gold standard for large spenders (€50K+/month). Limitation: Requires significant volume and willingness to pause channels temporarily.
Solution #4: Server-Side Order Matching Platforms like Luca AI use Shopify order data as source of truth (definitive record that "sale occurred") and triangulate backwards to identify which marketing touchpoints happened within conversion window. Process: Order placed at 3:47 PM → Search clicks/ad impressions for that customer in preceding 7 days → Apply multi-touch model to distribute credit → Deduplicate across platforms. Result: Attribution based on actual commerce data, not platform self-reporting.
💡 Practical Attribution Strategy by Business Stage
€0-€500K Revenue: Use platform reporting directionally (Meta, Google native dashboards) + Shopify Analytics. Don't over-invest in attribution complexity at validation stage. Focus: Prove channels work directionally.
€500K-€5M Revenue: Implement Blended MER as primary metric + add multi-touch attribution platform (Polar Analytics, Luca AI) for channel-specific optimization. Run 1-2 incrementality tests annually for major channels. Focus: Accurate budget allocation based on true contribution.
€5M-€20M Revenue: Full cross-platform attribution with ML models (Northbeam, Luca AI) + quarterly incrementality testing + Marketing Mix Modeling if spending €100K+/month. Focus: Optimize marginal ROI on every €1,000 increment.
€20M+ Revenue: Enterprise MMM + data-driven attribution + continuous incrementality testing integrated into campaign management. Focus: Sophisticated channel mix optimization and competitive advantage through attribution accuracy.
✅ How Luca AI Solves Attribution
Luca AI synthesizes Shopify orders (source of truth for "conversion happened"), Meta/Google/TikTok exposure data (which ads customer saw), email engagement (Klaviyo), and customer journey timestamps to build complete attribution picture using ML-powered multi-touch models. Ask conversationally: "Show me multi-touch attribution breakdown for November 2025 cohort" and Luca calculates credit distribution across all channels in seconds. Cross-functional queries like "Which channels drive highest LTV customers and what's their assisted conversion rate?" span marketing and customer data automatically. No more platform-reported attribution chaos, no more manually reconciling conflicting reports, no more guessing which channel deserves budget increase.
Q8. Building Custom Dashboards vs. Using Pre-Built Solutions: TCO Analysis [toc=Custom vs Pre-Built]
The build-vs-buy decision for analytics infrastructure splits DTC brands into three camps: (1) Custom data warehouse + BI dashboards (Snowflake + Looker, full control, high cost), (2) Pre-built SaaS dashboards (Triple Whale, Polar Analytics, fast deployment, limited customization), (3) Unified intelligence platforms (Luca AI, conversational AI eliminating dashboards entirely). Total Cost of Ownership (TCO) encompasses not just subscription fees but implementation time, ongoing maintenance, team training, analyst salary, and opportunity cost of delayed insights. Most founders underestimate TCO by 60-80% by ignoring hidden costs (maintenance, training, analyst dependency). This analysis reveals true 3-year cost of each approach.
💰 Option 1: Custom Data Warehouse + BI Layer
Architecture: Segment CDP (data collection) → Fivetran ETL (data syncing) → Snowflake (data warehouse) → dbt (data transformation) → Looker or Tableau (visualization) → Custom dashboards built by BI team.
Team: Hire Data Engineer (€80K-€120K/year), BI Analyst (€60K-€90K/year), optional Data Analyst (€50K-€70K/year) = €140K-€210K/year salaries (€11,667-€17,500/month)
Implementation: 8-12 weeks @ €150-€250/hour consulting or internal team time = €48,000-€120,000 one-time setup
Maintenance: 20-30% of BI team time on maintaining pipelines, fixing broken dashboards, updating schemas
Total Annual TCO: €195,000-€462,000/year
Advantages: ✅ Full customization and control, unlimited data storage/queries, custom data models for complex businesses, platform-agnostic (not locked to specific vendors), scales to €100M+ revenue.
Disadvantages: ❌ High upfront and ongoing costs, requires 2-3 person data team, 8-12 week implementation timeline, SQL knowledge required for queries, maintenance burden (pipelines break when platforms change APIs), slow to add new data sources (each requires ETL setup).
Best For: €20M-€100M+ brands, complex B2B2C models, companies where data is core IP and competitive advantage, businesses with resources for dedicated 3-person data teams.
💰 Option 2: Pre-Built SaaS Dashboards
Architecture: Triple Whale, Polar Analytics, Glew (all-in-one platforms with pre-built integrations and dashboards).
Upfront Costs:
Subscription: €129-€750/month depending on platform and revenue tier (average €400/month)
Implementation: 1-4 hours internal team time for OAuth connections = €200-€600 opportunity cost
Analyst Time: Still need someone to interpret dashboards, build reports, answer ad-hoc questions = 10-15 hours/week = €26,000-€39,000/year opportunity cost
Total Annual TCO: €30,800-€48,000/year
Advantages: ✅ Fast deployment (1 hour to 1 day), pre-built ecommerce-specific dashboards, lower cost than custom builds, no engineering team required, regular feature updates included.
Disadvantages: ❌ Limited to marketing + commerce data (rarely includes financial/operational), dashboard-based (must log in, navigate, build reports manually), limited customization beyond pre-built views, seat-based pricing (costs increase with team growth), still requires analyst interpretation (10-15 hours/week).
"Really bad platform. Constant delays in data and always some level of errors. Support sucks." — Dennis, Trustpilot Verified Review
Best For: €1M-€20M DTC brands, marketing-focused teams, businesses wanting better attribution without engineering investment, brands satisfied with pre-built dashboard views.
💰 Option 3: Unified AI Intelligence Platform
Architecture: Luca AI (single platform connecting commerce + marketing + finance + operations with conversational AI interface and embedded capital).
Subscription: €5,988/year (flat rate, doesn't increase with team size or data volume)
Analyst Time Saved: Conversational interface reduces analysis time from 10-15 hours/week to 2-3 hours/week = €21,000-€31,000/year saved vs. dashboard approaches
Total Annual TCO: €5,988/year
Net Cost After Time Savings: Negative €15,000 to €25,000 (platform pays for itself through efficiency gains)
Advantages: ✅ Cross-functional intelligence (commerce + marketing + finance + ops), conversational interface (no dashboard navigation, no SQL), proactive 24/7 monitoring (surfaces insights automatically), 10-minute setup (vs. weeks for alternatives), flat pricing that scales with business, embedded capital access (can fund opportunities identified), action capabilities (can pause ads, generate forecasts).
Disadvantages: ❌ Newer platform (less mature than decade-old incumbents), evolving feature set, relies on AI accuracy (though can always verify raw data).
Best For: €1M-€100M DTC brands, lean teams without data engineering resources, founders experiencing "dashboard chaos" across 8+ tools, businesses wanting cross-functional intelligence and capital access without hiring analysts.
📊 3-Year TCO Comparison
3-Year Total Cost of Ownership Comparison
Approach
Year 1 Cost
Year 2-3 Annual
3-Year Total TCO
Setup Time
Team Required
Custom Data Warehouse
€243K-€510K
€195K-€462K
€633K-€1.43M
8-12 weeks
2-3 person data team
Pre-Built Dashboards
€31K-€48K
€31K-€48K
€93K-€144K
1-4 hours
1 analyst (part-time)
Unified AI Platform (Luca AI)
€6K
€6K
€18K
10 minutes
None (conversational AI)
Cost Savings: Luca AI approach saves 87-93% vs. custom builds, 81-88% vs. pre-built dashboards over 3 years.
✅ Decision Framework
Choose Custom Data Warehouse If: You're €20M+ revenue with complex data needs justifying €200K+/year investment, you require custom data models unavailable in SaaS tools, your business has unique data architecture (B2B2C, marketplace, multi-brand holding company), you have budget and team for dedicated 2-3 person data engineering function.
Choose Pre-Built Dashboards If: You're €1M-€10M revenue focused primarily on marketing optimization, you have analyst on team who can interpret dashboards and build reports, you don't need cross-functional intelligence (finance, operations), you're comfortable with 10-15 hours/week manual analysis.
Choose Unified AI Intelligence Platform If: You're €1M-€100M revenue juggling 8+ disconnected tools, you lack in-house data team or analyst resources, you need cross-functional answers spanning marketing + finance + operations, you want proactive intelligence (not passive dashboards you must check), you want capital access when growth opportunities identified, you prioritize speed (10-minute setup vs. weeks).
Hybrid Approach: Some sophisticated brands use GA4 (free, granular behavior data) + Luca AI as cross-functional intelligence layer with conversational interface and capital access, getting best of both worlds at minimal incremental cost.
Q9. From Fragmented Dashboards to Unified Intelligence: Why DTC Brands Are Switching to AI-Powered Analytics [toc=Unified Intelligence]
Today's €1M-€50M DTC brand operates across 8-15 specialized tools (Shopify for sales, Meta for ads, Klaviyo for email, Xero for accounting, Stripe for payments, GA4 for behavior, Triple Whale for attribution, Gorgias for support, ShipStation for fulfillment, spreadsheets for forecasting). Each tool is excellent at its narrow function but operates in isolation. Marketing sees ROAS. Finance sees cash flow. Operations sees inventory. Nobody sees the complete picture. The result: dashboard chaos (10-15 hours weekly exporting CSVs, triangulating data across platforms, and manually answering questions that span multiple domains). You have more data than ever but less confidence in decisions. The explosion of SaaS tools promised efficiency but delivered fragmentation (data is everywhere, understanding is nowhere).
❌ Why Traditional Analytics Dashboards Fail
Traditional analytics dashboards (GA4, Triple Whale, Shopify Analytics, Tableau) are passive reporting tools showing what happened, not why it happened or what to do next. They operate on a "pull model" (you must log in, navigate dashboards, formulate queries, and interpret charts). Three structural failures:
1. Siloed Data: Marketing tools see campaigns and conversions but don't connect to accounting systems holding COGS and cash flow. You can calculate ROAS but not contribution margin (the metric that actually determines profitability).
2. Reactive, Not Proactive: Dashboards wait for you to check them. By the time you discover Meta CPM spiked 30% (destroying campaign profitability), you've wasted €2K-€5K in inefficient spend over 48-72 hours. No dashboard wakes you at 2 AM when things break.
3. No Action Capability: Dashboards show problems but can't fix them. You identify an underperforming ad set, then manually navigate to Meta Ads Manager to pause it (analytics and execution live in separate worlds).
"The product consistently fails to deliver on its promises. Core functionalities and first-party tracking are buggy or unreliable, yet the team prioritizes releasing new features over fixing what's broken." — Daniele Miccoli, Trustpilot Verified Review
Simultaneously, revenue-based financing providers (Wayflyer, Clearco) offer capital without intelligence (transactional funding based on historical data in rigid applications, no real-time business understanding). They provide money but don't help you understand if deploying that capital will create cash flow issues in 60 days or scale a profitable opportunity. The dichotomy is clear: Intelligence without capital is advice. Capital without intelligence is risk.
Iceberg infographic exposing hidden structural failures of traditional ecommerce analytics dashboards — passive reporting above surface, with siloed data, reactive approaches, and zero action capability beneath.
✅ The AI-Era Architectural Transformation
In 2026, competitive advantage is no longer having data (it's having a system that can reason across it). The paradigm shift is from analytics platforms (passive tools you query) to intelligence platforms (active systems that understand your business and proactively guide decisions).
What defines AI-powered unified intelligence:
Cross-Functional Data Synthesis: Connecting commerce + marketing + finance + operations into one reasoning layer that understands relationships between domains. It knows that scaling a Meta campaign doesn't just increase revenue (it impacts inventory requirements, cash runway, and Q4 solvency).
Proactive Push-Based Intelligence: Systems that monitor 24/7 and surface insights before you know to ask. Creative fatigue detected 18 hours after it starts, not 5 days later when you check dashboards.
Conversational Interface: Natural language replaces SQL, dashboard navigation, and analyst dependency. Ask "Which August cohorts have highest 90-day LTV by acquisition channel?" and get synthesized answers in seconds, not hours of manual spreadsheet work.
Action-Oriented Architecture: Systems that don't just recommend but execute (pausing underperforming campaigns, generating forecasts, modeling scenarios).
Intelligence + Capital Unification: When the AI identifies a high-confidence growth opportunity (Campaign X showing 4.2x ROAS with scaling headroom), it can fund it instantly (no separate capital applications).
💡 Luca AI's Category-Defining Solution
Luca AI is the world's first AI Co-Founder for ecommerce (unifying intelligence and capital in one conversational platform). We don't just analyze your business; we partner with you to grow it. Luca connects Shopify, Meta, Google, TikTok, Klaviyo, Stripe, Xero, and 20+ data sources into one context-aware reasoning layer. Ask "Show me contribution margin by product and channel for Q4 2025 cohorts" and Luca synthesizes order data, ad spend, COGS, transaction fees, and shipping costs from 5 different platforms in 5 seconds (the analysis that previously took 3-4 hours manually).
Unlike dashboards you must remember to check, Luca continuously monitors 40+ signals across all connected platforms. When metrics deviate (CAC spikes, creative shows fatigue, inventory approaches stockout threshold, margin erodes on specific SKUs), Luca generates alerts with diagnosis and recommended actions. You discover issues 12-48 hours earlier than dashboard-checking would allow, preventing problems before they become P&L impact.
Most critically: Luca AI is the only analytics platform that can fund the opportunities it identifies. When Luca surfaces a high-confidence scaling opportunity, you can deploy capital in one click. No separate loan applications. No 6-week bank approvals. No static pricing that ignores your real-time business health. The system that analyzes your business is the same system that can fund your growth (intelligence and capital unified).
Q10. Real-Time Dashboards vs. Proactive AI Intelligence: The Future of Ecommerce Analytics [toc=Proactive AI Intelligence]
Traditional analytics (GA4, Shopify Analytics, Triple Whale, Tableau) operate on a "pull model" (they display data when you log in and ask questions). Proactive AI intelligence platforms (Luca AI, emerging enterprise AI systems) operate on a "push model" (they continuously monitor your business and surface insights, risks, and opportunities before you know to ask). This isn't a feature difference ("we have alerts too!") (it's a fundamental architectural distinction between passive tools you query vs. active co-pilots that reason about your business 24/7). The question for scaling DTC brands: Do you want a reporting dashboard that waits for you to check it, or an intelligence system that alerts you to problems and opportunities as they emerge?
⚠️ Pull-Based Dashboard Structural Weaknesses
1. Blind Spot Problem: You can't ask about issues you don't know exist. If Meta CPM inflates 35% overnight on your top campaign (audience saturation, competitor launch, platform algorithm change), dashboards silently wait for you to notice. By the time you check (12-48 hours later), you've wasted €2K-€6K in inefficient spend.
2. Question Formulation Burden: Pull-based systems only answer questions you explicitly ask. If you don't know to query "Is my iOS attribution declining post-iOS 17 update?" you never discover that 28% of your Meta conversions disappeared due to Link Tracking Protection (you just see overall performance drop without diagnosis).
3. Analysis Paralysis: Faced with 47 dashboard widgets across 8 platforms, founders either ignore most data (relying on 3-5 vanity metrics) or spend hours hunting for signals in noise. 73% of metrics tracked are never used for decisions.
"Our experience with Triple Whale has been extremely frustrating. The integrations are inconsistent, building with the AI tool Moby is very buggy and crashes more than half the time, and support is largely unresponsive." — Matt Huttner, Trustpilot Verified Review
4. Time Lag from Checking Frequency: Dashboards show yesterday's data. If you check dashboards 1x daily (morning), issues that emerge at 2 PM are invisible for 19 hours. If you check 2x daily, that's still 12-hour blindness windows.
5. No Causal Diagnosis: Dashboards show symptoms (ROAS dropped 18%, conversion rate down 12%) but not causes (creative fatigue, iOS attribution loss, competitor undercutting price, shipping delays creating cart abandonment). You spend 2-3 hours investigating root causes that AI could surface in seconds.
✅ Push-Based Proactive Intelligence Advantages
Proactive AI systems eliminate blind spots by continuously scanning all connected data for anomalies, patterns, and opportunities.
2. Automatic Alert Generation: When metrics deviate beyond defined thresholds or historical patterns, Luca generates alerts with diagnosis: "Meta Campaign X CPM increased 24% in past 18 hours. Analysis: Audience saturation detected (frequency climbed to 4.2). Recommendation: Expand lookalike audience from 1% to 2-3% or refresh creative."
3. Opportunity Surfacing: Proactive systems don't just flag risks (they identify growth opportunities you'd miss manually): "Campaign Z showing 4.8x ROAS with stable CPM and rising CTR (creative still fresh). Scaling opportunity identified. Recommend increasing daily budget from €800 to €1,500. Cash flow analysis: Supports scale without Q4 inventory constraints. €35K capital available at 4.9% to accelerate."
4. Pattern Recognition Across History: AI compares current performance to historical patterns: "Similar creative fatigue pattern detected to Campaign A from August 2025 (which declined 40% over 6 days). Recommend proactive creative refresh now before performance degrades." Humans can't hold 6 months of campaign patterns in working memory (AI can).
5. Eliminates Checking Burden: You don't log into dashboards hoping to spot issues. Luca sends alerts via Slack, email, or mobile push when action is needed. Your attention is pulled only to what matters, when it matters.
📊 Comparison: Traditional vs. Proactive Intelligence
Traditional Dashboards vs. Proactive AI Intelligence
Dimension
Traditional Dashboards (Pull-Based)
Proactive AI Intelligence (Luca AI)
Operating Model
Reactive (You ask questions)
Proactive (System surfaces insights)
Blind Spot Risk
High (only see what you check)
Eliminated (monitors continuously)
Discovery Time
12-48 hours (next dashboard check)
Real-time alerts (within 1-2 hours of anomaly)
Question Formulation
Requires knowing what to ask
System identifies what matters
Causal Diagnosis
Shows symptoms, not causes
Provides diagnosis with recommendations
Anomaly Detection
Manual observation during check-ins
Automated 24/7 pattern recognition
Opportunity Identification
You must hunt for scaling chances
System surfaces high-confidence opportunities
Action Capability
None (reporting only)
Can execute (pause ads, adjust budgets, model scenarios)
💰 Decision Guidance
Choose pull-based dashboards if: You have dedicated analytics team with bandwidth to monitor dashboards multiple times daily, your business metrics are stable without frequent anomalies (rare for high-growth DTC), you have bandwidth for 2-3 hour investigative sessions when issues arise, you're sub-€500K revenue with limited operational complexity.
Choose proactive AI intelligence if: You're €1M+ revenue with increasing operational complexity (multiple channels, SKUs, campaigns running simultaneously), you're lean team (founder + 3-8 people) without dedicated analysts, you've experienced costly surprise issues discovered days late (stockouts, runaway ad spend, margin erosion), you want to catch opportunities in real-time (campaign performing well = scale immediately, not 3 days later after analysis), you value sleep (proactive systems work while you don't (no 11 PM dashboard checking needed)).
Q11. How to Build a Cohesive Analytics Stack: Integration Strategy, Not Tool Sprawl [toc=Analytics Stack Strategy]
Average €5M DTC brand pays €1,200-€2,800/month across 8-12 SaaS analytics subscriptions (GA4 setup/consultant, Triple Whale, Hotjar, Looker Studio, Segment, various dashboard tools). Each tool was added to solve a specific problem: "We need better attribution," "We need heatmaps," "We need financial reporting." The result: tool sprawl creating more fragmentation than clarity. The mistake: evaluating tools in isolation ("Does this solve Problem X?") rather than architecturally ("Does this integrate with our existing stack or create another data silo?"). Smart stack-building starts with architecture-first thinking: unified intelligence layer vs. fragmented point solutions.
❌ The Wrong Way to Build Analytics Stacks
1. Feature Checklist Approach: Choosing tools based on longest feature lists without considering integration. Result: 8 tools with overlapping capabilities that don't communicate.
2. Price-First Decisions: Selecting cheapest options in each category. Result: Low individual costs but massive integration complexity requiring €800-€2,000/month in consultant/agency fees to connect them.
3. One-Tool-Per-Problem: Adding new platform every time a gap emerges. Result: Tool graveyard (12 subscriptions, team uses 4 actively, 8 are abandoned but still billing).
4. Platform Vendor Lock-In Without Realizing: Choosing tools that only work within one ecosystem (e.g., Shopify-exclusive apps) limiting flexibility if you expand to Amazon, wholesale, or migrate platforms.
"Tracking does not work at all. They promised me a trial period (during which they tried to make the software work) and when that did not succeed, they told me I cannot get the refund I was promised." — Gustaf Henriksson, Trustpilot Verified Review
✅ The Right Evaluation Framework: 7 Architectural Criteria
Data Source Breadth (Score 0-2): Does it connect to your full stack (commerce, marketing, finance, operations) or only one domain? Single-domain tools create silos requiring manual bridging.
Integration Architecture (Score 0-2): Native integrations via OAuth (easy) or requires custom API work (expensive)? Calculate: if setup costs €2K in developer time, factor that into TCO.
Query Flexibility (Score 0-2): Can it answer cross-functional questions ("Show contribution margin by channel") or only single-domain queries? If you need 3 tools to answer one business question, that's architectural failure.
Team Access Model (Score 0-2): Seat-based pricing (punishes team growth) vs. flat pricing (scales painlessly)? Calculate 3-year cost with team growth assumptions.
Intelligence Type (Score 0-2): Passive dashboard (you must analyze) vs. active AI (surfaces insights proactively)? Passive tools require analyst time; active tools replace analysts.
Action Capability (Score 0-2): Reporting only vs. can execute decisions (pause ads, generate forecasts)? Tools that can't act create extra manual steps.
Setup & Maintenance Burden (Score 0-2): Requires data engineering team vs. no-code self-service? Calculate ongoing maintenance hours weekly.
📊 Stack Architecture Patterns: 3 Models
Pattern A: Fragmented Point Solutions (Most Common, Least Effective) Ecommerce: Shopify Analytics | Marketing: GA4 + Triple Whale + Hotjar | Finance: Xero + Spreadsheets | Attribution: Separate tool (Polar Analytics) | Capital: Separate loan application (Wayflyer) Characteristics: 8-12 separate logins, manual data export/import between systems, 10-15 hours weekly consolidating, no single system can answer cross-functional questions Total Cost: €1,200-€2,800/month subscriptions + 10-15 hours weekly founder/analyst time (€600-€1,500 opportunity cost) = €1,800-€4,300/month true cost Who it works for: Sub-€500K brands with simple operations, brands with dedicated 2-3 person analytics teams
Pattern B: Data Warehouse + BI Layer (Enterprise Approach) Infrastructure: Segment CDP (collecting data) + Snowflake (data warehouse storing unified data) + ETL (Fivetran syncing data sources to warehouse) + BI (Looker or Tableau for visualization) + Analytics (Custom dashboards built by BI team) Characteristics: Full control and customization, requires 2-3 person data team (analyst, BI engineer, data engineer), 8-12 week implementation timeline, SQL knowledge required for queries Total Cost: €10K-€25K/month (tools + team salaries), plus 8-12 weeks implementation Who it works for: €20M-€100M brands, complex B2B2C models, companies where data is core IP
Pattern C: Unified Intelligence Platform (AI-Era Approach) Single platform: Luca AI connecting all data sources | Intelligence layer: AI reasoning across commerce + marketing + finance + operations | Interface: Conversational natural language queries | Action: Can execute decisions, not just report | Capital: Embedded growth funding Characteristics: One login for entire team, 10-minute no-code setup, no SQL or engineering required, cross-functional queries answered conversationally, proactive 24/7 monitoring, flat pricing €499/month (unlimited users) Total Cost: €499/month flat = €6,000/year (83-91% cost reduction vs. Pattern A or B) Who it works for: €1M-€100M DTC brands, lean teams under 20 people, brands wanting enterprise-grade intelligence without enterprise complexity, brands seeking capital access alongside analytics
💡 Stack-Building Recommendations by Stage
€0-€500K Revenue: Start minimal (Shopify Analytics (free) + GA4 (free)). Avoid tool sprawl until you have product-market fit.
€500K-€2M Revenue: Decision point between Pattern A (fragmented point solutions) vs. Pattern C (unified intelligence). If you have bandwidth for 10-15 hours weekly data consolidation and dedicated marketing analyst, Pattern A works. If you're lean team without analysts, Pattern C (Luca AI) eliminates fragmentation from the start.
€2M-€20M Revenue: Tool sprawl becomes actively harmful here (most brands have accumulated 8-12 subscriptions creating decision paralysis). Either consolidate to unified intelligence platform (Pattern C) or commit to enterprise data warehouse approach (Pattern B) if you have complex custom needs justifying 3-person data team.
€20M+ Revenue: Pattern B (data warehouse) or Pattern C (unified AI) are only viable options. Pattern A (fragmented dashboards) breaks completely at this scale.
Q12. The Profitability Metrics 67% of DTC Brands Don't Track (And Why It's Costing Them) [toc=Profitability Metrics]
Your Shopify dashboard shows €250K revenue in November. Triple Whale reports 3.8x ROAS on Meta campaigns. GA4 shows conversion rate improved to 3.2%. Your marketing team is celebrating. Then your accountant sends December cash flow statement: -€12K negative cash flow. How is revenue up, ROAS strong, but cash disappearing? The answer: You're tracking vanity metrics (revenue, ROAS, traffic) without profitability context. You don't know contribution margin by channel (revenue minus COGS, ad spend, transaction fees, shipping). You scaled campaigns that drove revenue but lost money on every transaction after true costs. This scenario plays out in 67% of sub-€10M DTC brands (revenue growth masking profit erosion).
⚠️ Why Profitability Blindness Exists
1. Architectural Separation: Marketing tools (GA4, Triple Whale, Meta Ads Manager) see revenue and ad spend but don't connect to accounting systems (Xero, QuickBooks) holding COGS, shipping costs, transaction fees, refund data. To calculate true profitability, you must manually export data from 4-5 systems and build spreadsheet bridges (10-12 hours of work most founders skip).
2. Platform Reporting Incentives: Ad platforms (Meta, Google, TikTok) optimize reporting to make performance look good (attributing maximum revenue to their channels, reporting ROAS without COGS context because better-looking numbers drive more ad spend). They have zero incentive to show you lost money.
3. Metric Complexity: Vanity metrics are simple (revenue = money in). Profitability requires multi-source calculation: Contribution Margin = Revenue - COGS - Ad Spend - Payment Processing Fees (2.9% + €0.30 per transaction) - Shipping Costs - Refunds/Returns - Chargebacks. That's a 7-step calculation across 5 data sources.
4. Delayed Visibility: Revenue is instant (order placed = revenue recorded). Profitability lags 15-30 days waiting for refund window to close, COGS recognized when inventory ships, monthly accounting close. By the time you realize November was unprofitable, you've already repeated the mistake in December.
"Really bad platform - constant delays in data and always some level of errors. Support sucks." — Dennis, Trustpilot Verified Review
💰 The Hidden Costs of Profitability Blindness
1. Scaling Unprofitable Channels: Meta shows 4.2x ROAS so you increase budget from €5K to €15K daily. ROAS looks healthy but you don't realize: Product COGS 45% (€45 per €100 sale), Shipping €8 per order, Payment processing 3.2% (€3.20 per €100), Refund rate 22% (apparel), True ad spend €25 per order (blended CAC). Math: €100 revenue - €45 COGS - €25 CAC - €3.20 fees - €8 shipping = €18.80 gross profit. After 22% refunds = €14.66 true profit per order. But you're scaling based on ROAS without this context, turning €5K daily spend (20 orders/day at breakeven) into €15K daily spend (60 orders/day) creating €180/day losses (€5,400/month). You discover the problem 45 days later when cash runway compresses.
2. Product Mix Errors: Product A has 60% margin, Product B has 28% margin. Marketing campaigns drive equal revenue from both (€50K each). You celebrate €100K revenue. Reality: Product A contributed €30K profit, Product B contributed €14K profit. If you'd known contribution margin by product, you would have allocated 70% of budget to Product A. Missed profit opportunity: €8K-€12K per month.
3. Cohort Degradation Invisibility: November cohort has 35% lower LTV than August cohort (customer quality declining) but you only track aggregate metrics. You don't discover cohort degradation until Q1 financial analysis (3 months of diminishing returns).
✅ The Profitability Metrics You Must Track
1. Contribution Margin (CM): Formula: Revenue - COGS - Ad Spend - Transaction Fees - Shipping - Refunds. Why it matters: The ONLY metric that shows true profitability per order after all variable costs. ROAS is meaningless without CM context. Track by: Channel, Product, Campaign, Cohort (monthly customer acquisition groups). Benchmark: Healthy DTC brands maintain 35-50% blended CM. Below 25% CM is unsustainable without external funding.
2. Contribution Margin by Channel: Same CM calculation segmented by acquisition source (Meta, Google, TikTok, Email, Organic). Why: Different channels have different CAC and customer quality (LTV). High ROAS channel might have low CM due to high CAC.
3. LTV:CAC Ratio: Formula: Customer Lifetime Value ÷ Customer Acquisition Cost. Why: Shows payback multiple (how much profit each customer generates relative to acquisition cost). Benchmark: Minimum 3:1 (3x return on acquisition), ideal 5:1. Below 2:1 means you're spending more to acquire than customers are worth.
4. Cohort LTV Trends: Track each monthly cohort's purchasing behavior over time (Month 0, Month 3, Month 6, Month 12 revenue per customer). Why: Detects customer quality degradation early. November cohort with 30% lower Month-3 LTV than August cohort signals acquisition quality problems.
5. Cash Conversion Cycle: Formula: Days Inventory Outstanding + Days Sales Outstanding - Days Payables Outstanding. Why: How long cash is tied up in operations. Lower = less working capital needed. Benchmark: 30-60 days for efficient DTC operations.
💡 How Luca AI Automates Profitability Tracking
Luca AI automatically calculates all profitability metrics by connecting Shopify (orders, revenue), Meta/Google/TikTok (ad spend), Stripe (transaction fees), Xero (COGS), and shipping data. Ask conversationally: "Show me contribution margin by channel for November 2025" and Luca synthesizes data across all 5 sources in 5 seconds. Cross-functional queries like "Which products have highest CM and can we scale them without inventory constraints?" span commerce, marketing, finance, and operations automatically. Zero spreadsheets. Zero manual calculation. Zero errors. The analysis that takes 8-12 hours manually happens instantly and continuously.
FAQ's
What's the difference between ecommerce website analytics and traditional web analytics?
Traditional web analytics (like GA4) track website behavior (pageviews, sessions, bounce rates, user flows) but operate in isolation from your commerce, financial, and operational systems. Ecommerce website analytics must synthesize multiple data domains: commerce platforms (Shopify orders, revenue, inventory), marketing channels (Meta, Google, TikTok ad spend and attribution), financial systems (Xero COGS, Stripe transaction fees, shipping costs), and customer data (LTV, cohort analysis, repeat purchase rates).
The critical distinction: traditional analytics answer "What happened on my website?" while comprehensive ecommerce analytics answer "Is this profitable after all costs, and should we scale it?" For example, GA4 shows conversion rate improved to 3.2%, but can't tell you if those conversions generated positive contribution margin after subtracting COGS, ad spend, and fulfillment costs. Luca AI bridges this gap by connecting all data sources into one reasoning layer, enabling cross-functional queries like "Show me contribution margin by channel for Q4 cohorts" that synthesize marketing, commerce, and financial data automatically. Most DTC brands have 93% coverage of behavioral analytics but only 23% coverage of financial analytics, creating dangerous blind spots where marketing reports "success" while finance sees negative cash flow.
How do I track ecommerce analytics post-iOS 14.5 when pixel tracking is broken?
iOS 14.5+ broke traditional pixel-based tracking, with 60-70% of iOS users declining App Tracking Transparency, causing 15-30% attribution loss in Meta Ads Manager and Google Analytics. The five tracking methods that actually work in 2026 are:
Server-side conversion tracking: Meta Conversions API (CAPI) and Google Enhanced Conversions send data from your server directly to ad platforms, bypassing browser restrictions. This recovers 20-40% of lost attribution compared to pixel-only approaches.
First-party data collection: Customer accounts, email capture, and Shopify native data aren't subject to iOS restrictions because you own the relationship. Luca AI synthesizes this first-party commerce data with marketing exposure data to build complete attribution pictures.
Probabilistic multi-touch attribution: Machine learning analyzes aggregate patterns (spend increases correlated with sales increases) without requiring individual user tracking, making it privacy-compliant and iOS-proof.
Unified commerce data as source of truth: Use actual Shopify orders as the definitive conversion record, then triangulate backwards to ad exposure rather than relying on platform self-reporting.
Marketing Mix Modeling (MMM): Statistical analysis of historical data to determine channel contribution, used by brands spending €50K+/month.
We recommend implementing CAPI + unified intelligence platforms that automatically handle server-side tracking while synthesizing all data sources.
What are the most important ecommerce metrics to track for profitability, not just revenue?
The metrics 67% of DTC brands don't track (but must) focus on profitability after all costs, not vanity metrics like revenue or platform-reported ROAS.
Contribution Margin (CM): Revenue minus COGS, ad spend, transaction fees, shipping, and returns. This is the only metric showing true profitability per order. Healthy DTC brands maintain 35-50% blended CM; below 25% is unsustainable. We calculate this by segmenting by channel, product, and cohort to identify what's actually profitable.
Contribution Margin by Channel: Same CM calculation segmented by acquisition source (Meta, Google, Email). High ROAS channels might have low CM due to high CAC or low-quality customers.
LTV:CAC Ratio: Customer Lifetime Value divided by Customer Acquisition Cost. Minimum 3:1 for sustainability, ideal 5:1+. Below 2:1 means you're spending more to acquire than customers are worth.
Cohort LTV Trends: Track each monthly cohort's purchasing behavior over time (Month 0, 3, 6, 12). November cohort with 30% lower Month-3 LTV than August signals acquisition quality problems.
Cash Conversion Cycle: Days cash is tied up in operations. Benchmark: 30-60 days for efficient DTC.
Luca AI automatically calculates all profitability metrics by connecting Shopify, ad platforms, Stripe, and Xero. The analysis taking 8-12 hours manually happens in 5 seconds conversationally. We answer "Which campaigns have ROAS above 3.0x after all costs?" spanning marketing and financial data automatically.
Should I build a custom analytics stack or use pre-built ecommerce analytics tools?
The build-vs-buy decision depends on revenue stage, team resources, and complexity. We've analyzed 3-year Total Cost of Ownership across three approaches:
Custom Data Warehouse (Snowflake + Looker): €633K-€1.43M over 3 years, requires 2-3 person data team, 8-12 week implementation. Best for: €20M+ revenue with complex B2B2C models justifying dedicated engineering resources.
Pre-Built Dashboards (Triple Whale, Polar Analytics): €93K-€144K over 3 years, still requires 10-15 hours/week analyst interpretation (€26K-€39K annual opportunity cost). Best for: €1M-€10M brands with dedicated marketing analysts comfortable with dashboard-based workflows.
Unified AI Intelligence Platform (Luca AI): €18K over 3 years with 10-minute setup, conversational interface eliminating analyst dependency, saving 81-93% vs. alternatives. Best for: €1M-€100M brands without data engineering teams, seeking cross-functional intelligence spanning marketing, finance, and operations with embedded capital access.
Most sophisticated operators use hybrid: GA4 for granular behavior analysis + Luca AI as the unified intelligence layer with proactive monitoring and capital integration. The €5M DTC brand paying €1,200-€2,800/month across 8-12 fragmented subscriptions saves 80%+ by consolidating to unified platforms while gaining cross-functional reasoning traditional dashboards can't provide.
How does cross-platform attribution solve the "which channel drove this sale" problem?
The attribution problem occurs when customers interact with multiple touchpoints before converting (Instagram ad Monday, Google search Tuesday, email Wednesday, direct visit Friday), and each platform claims 100% credit. Meta reports €80K attributed revenue, Google claims €55K, Klaviyo claims €40K (total €175K), but actual Shopify revenue is €100K. This 75% attribution overlap leads to misallocated budgets.
Solutions that work in 2026:
Unified attribution platforms: Tools like Northbeam, Polar Analytics, and Luca AI ingest data from all marketing platforms plus Shopify orders, deduplicate conversions, and apply multi-touch models (linear, time-decay, or ML-powered algorithmic attribution). Result: single source of truth showing distributed credit across the actual customer journey.
Blended Marketing Efficiency Ratio (MER): Total Revenue divided by Total Marketing Spend (all channels). Example: €100K revenue divided by €25K total spend equals 4.0x blended MER. This sidesteps attribution arguments and measures aggregate efficiency.
Incrementality testing: Rather than track attribution, measure incremental impact through geo-holdout tests (run ads in 80% of markets, hold out 20%, compare lift) or time-based holdouts (pause channel for 2 weeks, measure revenue decline).
We use server-side order matching with Shopify as the source of truth, triangulating backwards to identify marketing touchpoints within conversion windows, then applying ML-powered multi-touch models. This eliminates platform-reported attribution chaos while answering "Which channels drive highest LTV customers?"
Enjoyed the read? Join our team for a quick 15-minute chat — no pitch, just a real conversation on how we’re rethinking Ecommerce with AI - Luca
Loading Schedule...
Your AI Co-Founder is here.
Here’s why:
Shopify, Meta, Xero - one brain.
"Should I scale?" Answered with real data.
Growth capital. No applications. One click.
Thank you! Your submission has been received! Please book a time slot for the Meeting
Oops! Something went wrong while submitting the form.
.svg)
.svg)

.jpg)
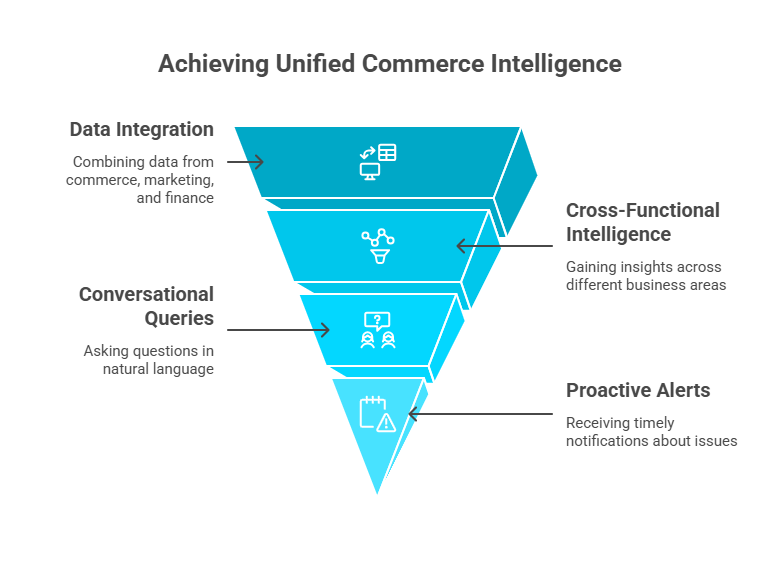
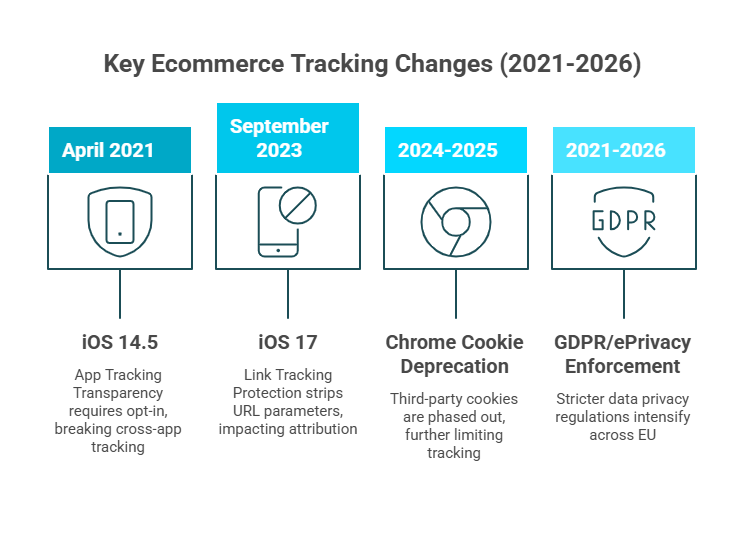
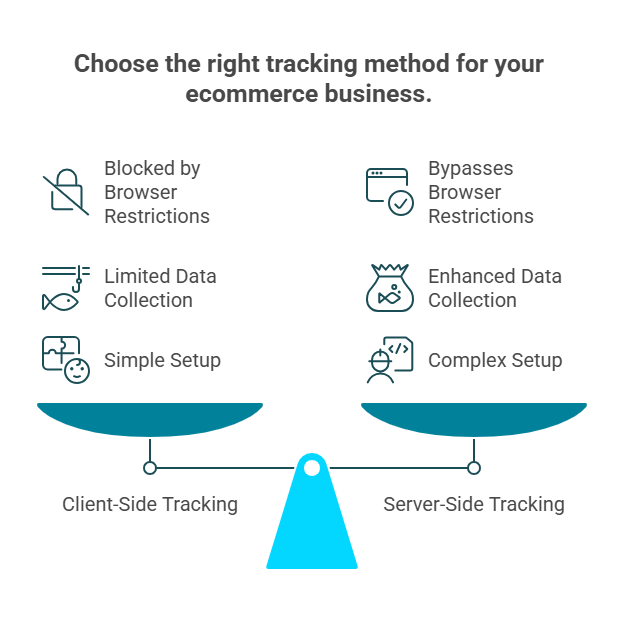
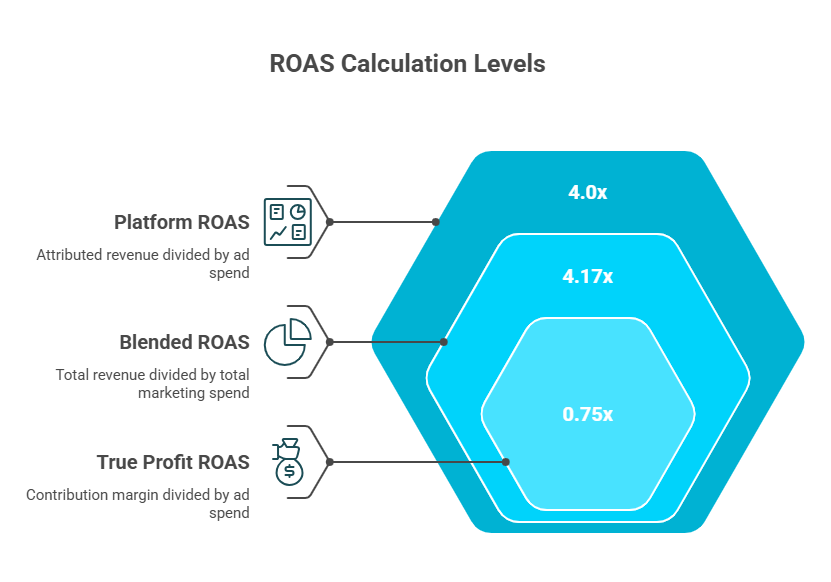
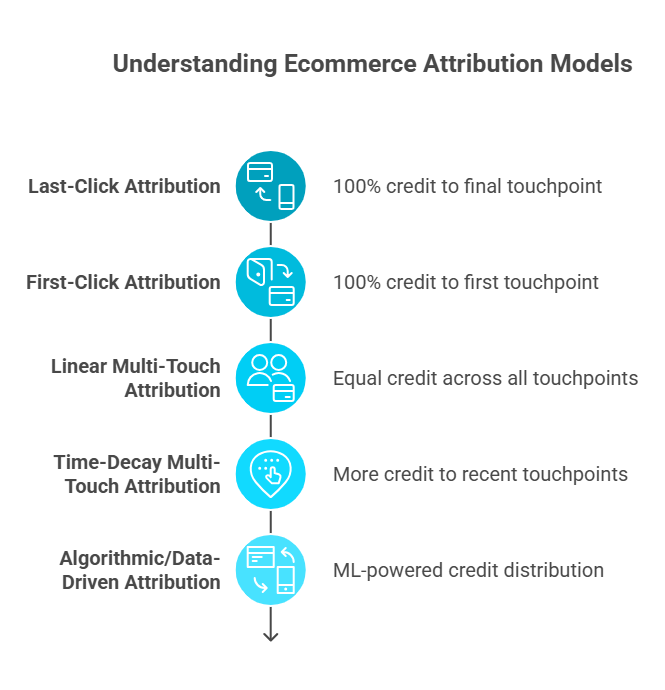
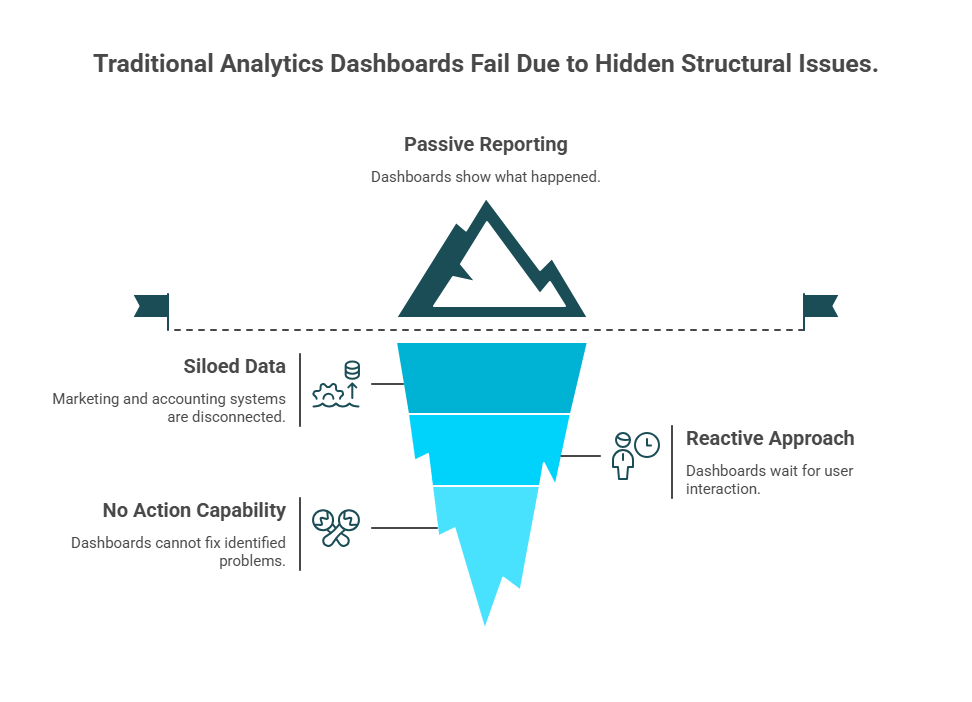

.svg)
.webp)

.png)
