10 Best Lebesgue Alternatives for Ad Spend, CAC and Competitor Insights
13
mins read
TL;DR
The ten picks are Luca AI, Triple Whale, Polar Analytics, Northbeam, Lifetimely, Elevar, Fairing, KnoCommerce, Peel Insights, and Meta Ad Library, with pricing verified August 2026.
Lebesgue does two jobs at once, attribution plus competitor benchmarking, so most replacements need two tools priced together against its 79 dollar Ultimate tier.
Switching rarely fixes attribution. Accuracy is the most-discussed complaint for Triple Whale at 151 mentions and Northbeam at 99.
Competitor revenue estimates run only 30 to 50 percent accurate across a 100,922-store study, while pixel and Plus detection stay above 85 percent.
Median CPA hit 32.74 dollars in 2025 and median DTC contribution margin sits at 15 to 20 percent, so benchmark before buying anything.
Run any new tool in parallel for 60 days, export LTV cohorts first, and never migrate during peak season.
Q1. What are the 10 best ad spend, CAC and competitor insights tools for e-commerce in 2026? [toc=1. The 10 Tools]
The ten best are Luca AI, Triple Whale, Polar Analytics, Northbeam, Lifetimely, Elevar, Fairing, KnoCommerce, Peel Insights, and Meta Ad Library. Luca AI sits first as the reasoning layer over your connected store data, priced from €299 a month. Entry points run from free (Triple Whale, Meta Ad Library) to roughly $300 a month for Polar Analytics. Pricing verified August 2026.
I picked this list the way I pick tools for my own stores. Every entry had to do real work on ad spend, CAC, or competitor signal, and had to be something a $1M to $5M brand can actually run without hiring an analyst. Lebesgue is left out on purpose, because you are here to replace it. Two of the ten are free. Three of them measure things the other seven cannot see. Read the table first, then read the entries for the two or three that match your stage. Skip the rest.
The 10 tools at a glance
Luca AI, best for cross-functional reasoning across store, ad, and finance data
Triple Whale, best for daily ad spend and creative reporting
Polar Analytics, best for warehouse-grade Shopify analytics
Northbeam, best for incrementality at higher spend levels
Lifetimely, best for LTV and cohort profit reporting
Elevar, best for server-side tracking integrity
Fairing, best for post-purchase survey attribution
KnoCommerce, best for zero-party attribution surveys
Peel Insights, best for automated cohort and retention analysis
Meta Ad Library, best for free competitor ad research
Best Lebesgue Alternatives for Ad Spend, CAC, and Competitor Insights (2026)
Tool Name
Key capabilities offered
Best For
Pricing
Luca AI ⭐⭐⭐⭐⭐
Plain-English questions across connected sources, root-cause analysis, predictive alerts, scheduled Slack and email reports
Brands at $1M to $5M with data piling up and nobody to read it
Retention-led brands with repeat purchase products
Custom pricing, not published
Meta Ad Library ⭐⭐⭐
Live competitor ad creative, run dates, placements, ad volume
Anyone researching competitor creative for free
Free
Where a vendor does not publish a price I verified in August 2026, I left it blank rather than repeating a number from a comparison blog. Sentiment volume across public operator posts backs the ordering at the top: Triple Whale draws 151 mentions and Northbeam 99, while Fairing sits at 9 and Peel at 3. If you want the wider category view, our roundup of the best Shopify analytics apps covers tools that fall outside this specific job.
1.1 Luca AI [toc=1.1 Luca AI]
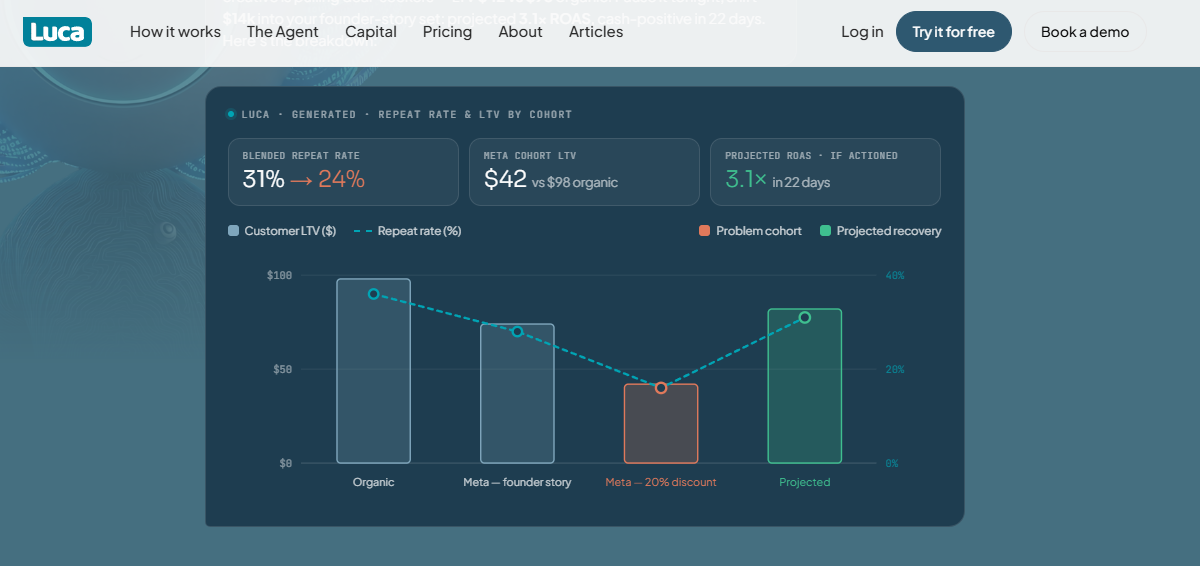
Luca AI traces a repeat-rate drop to one discount cohort and projects the recovery math.
🧠 Why did we choose this tool?
Luca AI is my company, and I am putting it first because of what it does, not who wrote this. Luca AI is an AI layer over your store's data, not another attribution pixel. It connects Shopify, Meta, Google, Klaviyo, and your accounting stack, then answers questions in plain English. No SQL. No dashboard building. It runs root-cause analysis, spots outliers, and pushes scheduled reports to Slack or email. If your problem is a torrent of disjointed data and nobody to read it, that is the exact gap Luca AI was built for.
Root-cause analysis across marketing, product, customer, and operations data
🎯 Best for
Shopify and WooCommerce brands doing $1M to $5M a year
Teams with real data volume and no analyst to interpret it
Operators who want answers pushed to them, not dashboards to check
📁 Case study
What was the problem? A European skincare brand doing roughly €2.4M a year ran Meta, Google, and Klaviyo through four separate exports. Blended CAC looked fine. Contribution margin was quietly falling for two quarters, and nobody caught it.
How Luca helped? Luca AI connected the store, ad accounts, and accounting data, then normalised everything on ingestion. The founder asked one question about margin decline. Luca AI traced it to two SKUs with high return rates absorbing most of the paid traffic, and set a weekly Slack alert on SKU-level contribution margin.
What was the outcome? 💰 The team pulled spend off both SKUs inside a week. Blended CAC rose slightly. Contribution margin recovered, because the traffic moved to products that actually pay. That trade is the one most dashboards will never suggest, since they cannot see cost lines.
💰 Pricing
[ Founder, $250 / Month | Growth, $500 / Month | Scale, $750 / Month ]. Current plans are listed on the Luca AI pricing page.
⚠️ Luca AI is not a fit below roughly $1M in revenue, and it is not a fit for enterprises that already employ data teams. It also does not replace an attribution pixel. If your only complaint about Lebesgue is click credit, buy Elevar or Polar instead and skip this entry.
Luca AI earns position one here for a narrow reason: it is the only tool on this list that reasons across marketing, product, and cost data in one place, then pushes the finding to you without being asked.
1.2 Triple Whale [toc=1.2 Triple Whale]
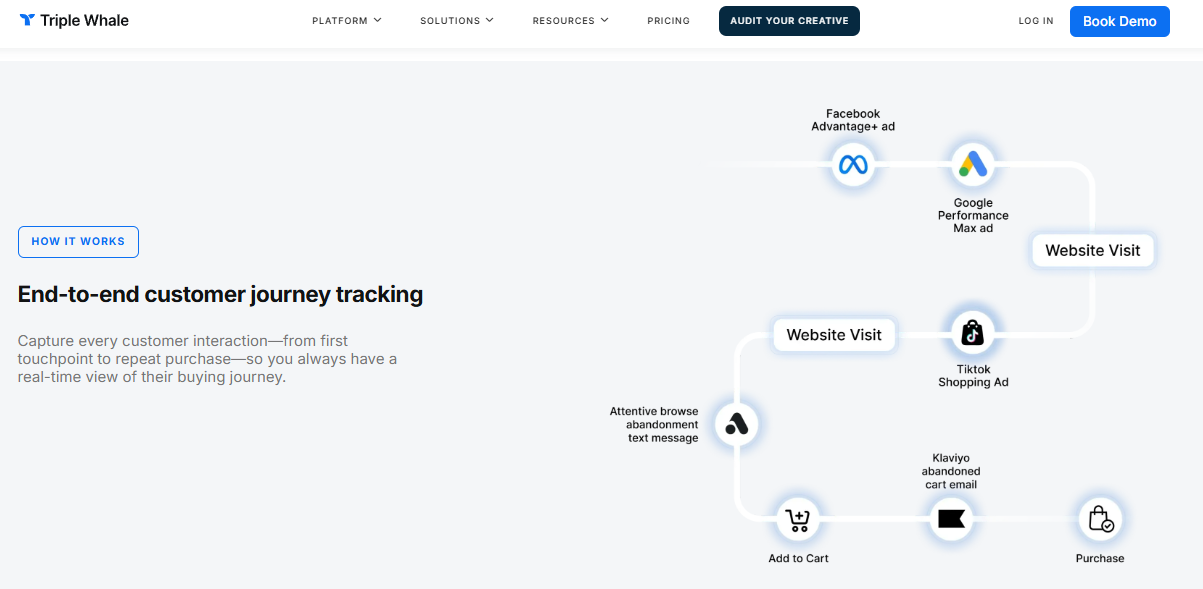
Triple Whale maps every paid touchpoint from first ad click through to the final Shopify purchase.
🐋 Why did we choose this tool?
Triple Whale is the default answer for a reason. It ships a first-party pixel, a clean daily view of blended spend, and creative reporting that media buyers actually use. Its free tier includes the Triple Pixel with a 12-month lookback, which makes it the cheapest serious way off Lebesgue. It is also the most-discussed tool in public operator threads, at 151 mentions. My honest read: excellent for daily decisions, weaker as a source of financial truth, which is the same tension we unpack in our guide to Triple Whale alternatives.
📊 Core evaluation metrics
Data sources connected: major ad, email, and commerce platforms
Reasoning depth: dashboards and AI summaries, marketing scope only
Proactive alerting: available, focused on marketing metrics
Time to first answer: fast, pixel installs in under an hour
Entry price: free, then $149 a month
✅ Solutions offered
Triple Pixel first-party tracking with first and last-click views
Marketing mix modelling and GeoLift on the top tier
🎯 Best for
DTC brands spending $10K to $100K a month on Meta
Teams whose main daily question is which creative to scale
Operators who want a free starting point before committing budget
⭐ Reviews
"Some data we still notice discrepancies between platforms, for example, tracking ads, and differences in the reported metrics like revenue. Or with our emails/sms platforms about what revenue is attributed to which channel, for example, Triple Whale will attribute more revenue to the email that was sent out, but the platform will attribute more revenue to the SMS that was sent out." - Verified UserTriple Whale G2 Verified Review (4/5)
⚠️ Skip Triple Whale if you need cost and margin data in the same view as spend. Attribution accuracy is the single most-discussed complaint about it in public threads. Run it against native Shopify reporting for your first 60 days before you trust the numbers, and hold that check against your own unit economics rather than the dashboard's version of them.
1.3 Polar Analytics [toc=1.3 Polar Analytics]
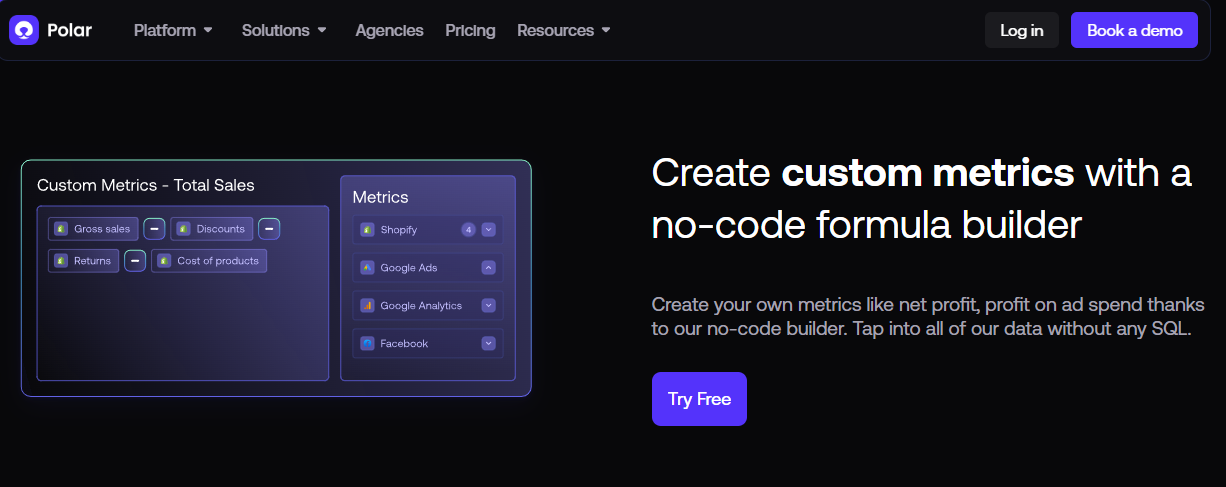
Polar Analytics lets operators build net profit metrics from Shopify and ad data without SQL.
🧊 Why did we choose this tool?
Polar Analytics is the pick when you want to own your data, not rent a dashboard. It joins revenue at the order level and behaves like a warehouse with a friendly front end. That matters if your CFO keeps asking why two tools disagree. The trade-off is price and setup time. It is not plug and play, and support quality is the most common complaint in verified reviews.
📊 Core evaluation metrics
Data sources connected: broad, including ad, email, and ops platforms
Reasoning depth: custom metrics and BI-style reporting, marketing and revenue scope
Proactive alerting: available, configurable per metric
Time to first answer: days, setup requires real effort
Entry price: around $300 a month
✅ Solutions offered
Order-level revenue joins across channels
Custom metric builder without SQL
Cross-channel acquisition and retention dashboards
Warehouse-style data model you can export
Scheduled reporting to email and Slack
🎯 Best for
Shopify brands past roughly $5M in revenue
Teams with someone who enjoys building reports
Operators who want raw data ownership, not a closed ecosystem
⭐ Reviews
"Shortly after onboarding we were assigned an account manager. About a month later, she was laid off and we were never assigned a new account manager. I have the direct email of a support specialist, but the response time has been less than ideal, especially when real-time data is important for our team." Ben S., Director of Commercial OperationsPolar Analytics G2 Verified Review (4/5)
"Mobile limitations and the platform isn't a plug-and-play solution, it requires time and effort to learn its advanced features and capabilities. There are instances that certain intergrations are not yet fully functioning so you have to always check with Customer Support." Charlene R., Head of Operations, HR & CulturePolar Analytics G2 Verified Review (5/5)
💰 Pricing
[ Starter, ~$300 / Month | Higher tiers, up to ~$750 / Month ]
⚠️ Skip Polar if you are under $5M and have nobody to maintain reports. One Trustpilot reviewer flagged that quoted pricing differed sharply from the Shopify listing, so get your quote in writing first. If report maintenance is the part you dread, compare it
1.4 Northbeam [toc=1.4 Northbeam]
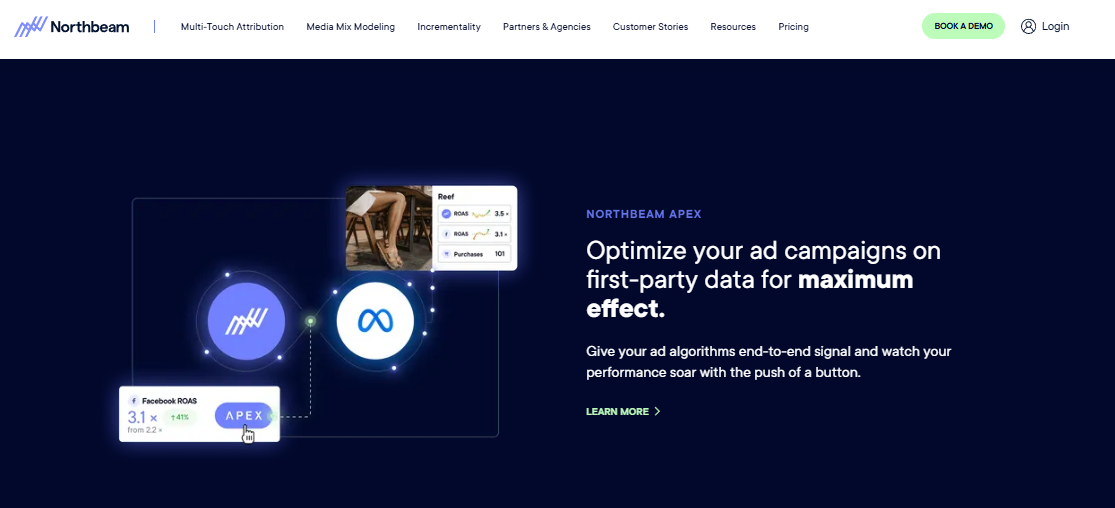
Northbeam pushes first-party signal back into ad platforms to sharpen campaign optimisation at scale.
📡 Why did we choose this tool?
Northbeam earns its place on incrementality, not dashboards. It is built for brands running paid across four or more channels at real spend. Public operator sentiment credits it with catching underreported conversions and staying stable through Meta attribution changes. The recurring complaint is blunt. Cost is hard to justify for smaller, single-channel accounts.
📊 Core evaluation metrics
Data sources connected: major paid channels plus commerce platforms
Reasoning depth: multi-touch attribution and media mix modelling
Proactive alerting: limited, reporting led
Time to first answer: weeks, modelling needs data volume
Brands spending above roughly $200K a month on paid
Teams running four or more acquisition channels
Operators who already trust a measurement process
💰 Pricing
[ Custom pricing, not published ]
⚠️ Skip Northbeam if Meta is your only real channel. Attribution and measurement accuracy is the single most-discussed theme in public Northbeam conversation, with 99 mentions logged.
1.5 Lifetimely [toc=1.5 Lifetimely]
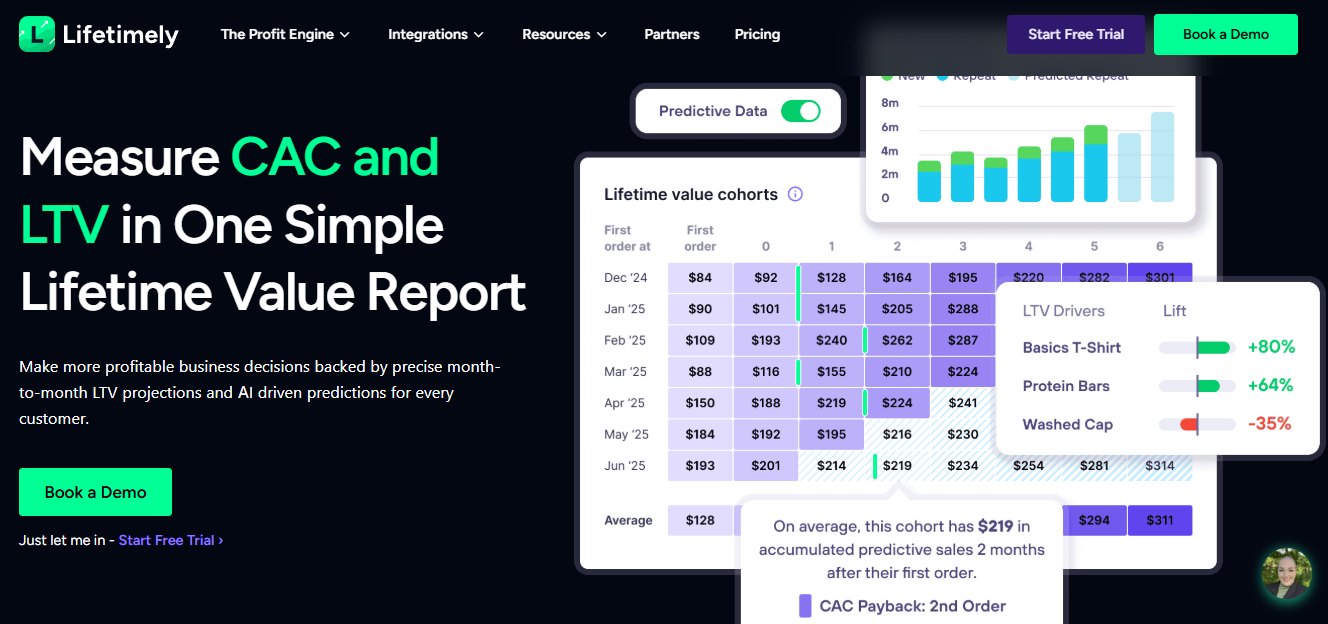
Lifetimely turns cohort data into CAC payback timing and product-level lifetime value drivers.
📈 Why did we choose this tool?
Lifetimely answers one question well. What is a customer worth over time, and when does acquisition pay back. That is the number most ad dashboards quietly skip. Median CAC payback sits at six to nine months, and the top quartile clears it in under three. If you cannot see your own curve, you are guessing at spend.
📊 Core evaluation metrics
Data sources connected: Shopify plus major ad and email platforms
Reasoning depth: cohort and LTV modelling, profit reporting
Proactive alerting: basic, report driven
Time to first answer: hours, historical orders backfill quickly
Entry price: published plans, not verified for this list
✅ Solutions offered
LTV curves by cohort and acquisition channel, the core of any Shopify LTV review
Automated profit and loss reporting
Repeat purchase and retention analysis
Product-level contribution reporting
Scheduled email summaries
🎯 Best for
Brands with repeat purchase products
Operators sizing CAC against payback, not ROAS
Teams that need cohort math without a spreadsheet
💰 Pricing
[ Published plans, not verified for this list ]
⚠️ Skip Lifetimely if you sell a one-time, high-ticket product. Cohort curves need repeat behaviour to say anything useful.
1.6 Elevar [toc=1.6 Elevar]
🔧 Why did we choose this tool?
Elevar fixes the plumbing, not the reporting. It runs server-side tracking, which means conversion data is sent from a server instead of the shopper's browser. Browsers block pixels. Servers do not. It holds 4.6 stars across 148 Shopify App Store reviews, with 89% at five stars.
📊 Core evaluation metrics
Data sources connected: Meta, Google, TikTok, Pinterest, and more
Reasoning depth: none by design, this is a data layer
Brands losing conversions to blocked or broken pixels
Teams comfortable with Google Tag Manager
Stores on headless or heavily customised builds
💰 Pricing
[ ~$200 / Month to Custom pricing at higher volumes ]
⚠️ Running Elevar alongside native Meta CAPI can duplicate events and hurt ad performance. Pick one path and stick to it. Elevar reports nothing about margin, so it is a partner to an analytics tool, never a replacement, and it sits underneath the rest of your e-commerce tech stack.
1.7 Fairing [toc=1.7 Fairing]
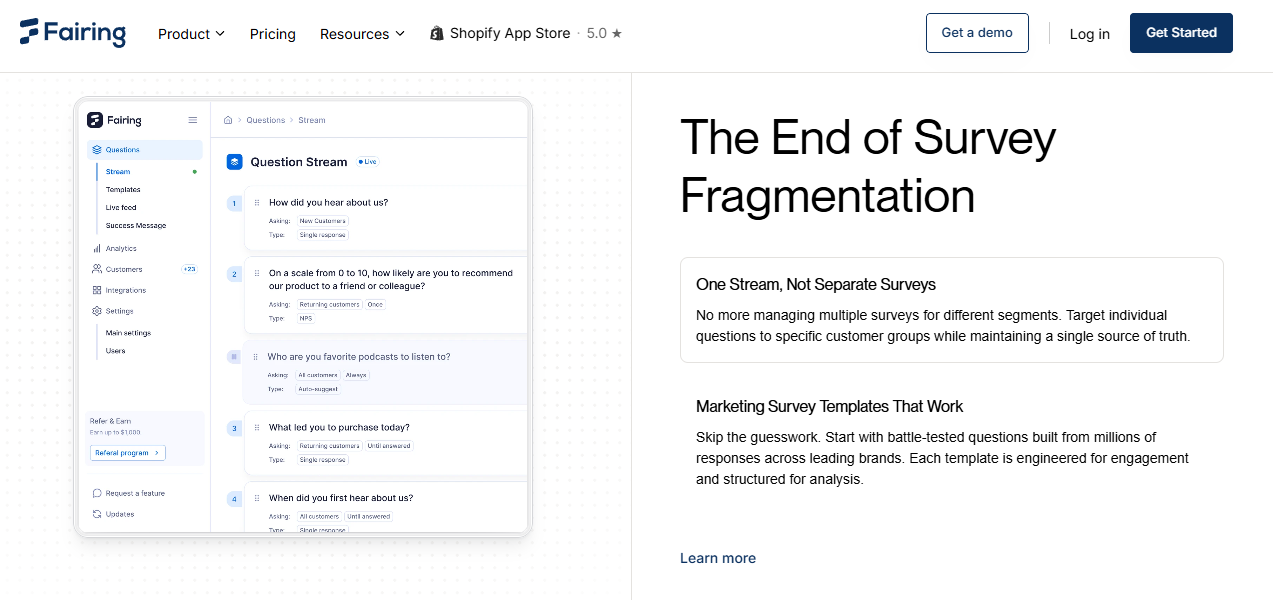
Fairing asks buyers directly, giving an independent check when two attribution dashboards disagree.
🗣️ Why did we choose this tool?
Fairing asks your buyer a question after checkout. That answer is zero-party data, meaning the customer told you directly. It is the cheapest tiebreaker when two dashboards disagree about a channel. Roughly 20 of every 100 orders never show up correctly in analytics integrations, so an independent signal has real value.
📊 Core evaluation metrics
Data sources connected: Shopify checkout plus common marketing tools
Reasoning depth: survey response analysis, no modelling
Proactive alerting: none meaningful
Time to first answer: days, you need response volume
Entry price: published plans, not verified for this list
Brands with heavy organic, podcast, or influencer spend
Operators who need a check on paid channel credit
Stores with enough daily orders for a usable sample
💰 Pricing
[ Published plans, not verified for this list ]
⚠️ Skip Fairing under roughly 300 orders a month. Small samples produce confident-looking noise, which is worse than no data.
1.8 KnoCommerce [toc=1.8 KnoCommerce]
📨 Why did we choose this tool?
KnoCommerce plays the same position as Fairing, with more question logic and integration depth. Public operator chatter puts it at 52 mentions, ahead of Fairing at 9. That is not proof of quality. It does tell you which one operators are actually running.
📊 Core evaluation metrics
Data sources connected: Shopify plus email, SMS, and analytics tools
Reasoning depth: multi-touch survey attribution, no financial modelling
Proactive alerting: none meaningful
Time to first answer: days, response volume dependent
Entry price: published plans, not verified for this list
Brands wanting survey data inside their existing stack
Teams testing several attribution sources at once
Operators with steady daily order volume
💰 Pricing
[ Published plans, not verified for this list ]
⚠️ Do not run KnoCommerce and Fairing together. You will annoy buyers and split your sample for no gain.
1.9 Peel Insights [toc=1.9 Peel Insights]
🍊 Why did we choose this tool?
Peel Insights automates cohort and retention analysis that most teams never build. It is the weakest entry here on operator sentiment, at 3 public mentions. I still include it because retention-led brands with a narrow need can get value cheaply. Judge it on your own trial, not on crowd noise.
📊 Core evaluation metrics
Data sources connected: Shopify plus core marketing platforms
Reasoning depth: cohort, retention, and RFM segmentation
Operators who want retention views without building them
💰 Pricing
[ Custom pricing, not published ]
⚠️ Skip Peel if you already run Lifetimely. The overlap is heavy, and paying twice for cohort math is a poor use of cash.
1.10 Meta Ad Library [toc=1.10 Meta Ad Library]
🔎 Why did we choose this tool?
Meta Ad Library is free, official, and shows every ad a competitor is currently running. Most paid competitor tools are wrapping this same public data. It is also the honest counterweight to estimate-based tools, where competitor revenue estimates run 30% to 50% accurate and traffic estimates 40% to 60%.
📊 Core evaluation metrics
Data sources connected: Meta platforms only
Reasoning depth: none, this is raw creative data
Proactive alerting: none
Time to first answer: minutes, no setup
Entry price: free
✅ Solutions offered
Live view of competitor ad creative
Ad run dates and active duration
Placement and format visibility
Multiple ad variations per advertiser
Search by brand or keyword
🎯 Best for
Any brand researching competitor creative angles
Teams building a swipe file before a launch
Operators who refuse to pay for estimated data
💰 Pricing
[ Free, $0 / Month ]
⚠️ Meta Ad Library shows creative, never spend. Any tool claiming exact competitor spend is modelling it, so treat those numbers as directional at best.
🧾 The free stack, if you should not be paying yet
Not every reader needs a new subscription this month. Triple Whale Free gives you a first-party pixel with a 12-month lookback at zero cost. Meta Ad Library covers competitor creative for free.
Run both for 60 days. If you still cannot answer why margin moved, that is your signal to pay for something. Buying a tool before you can name the question is how software budgets quietly become the new ad waste.
Luca AI is built for the moment after that test fails, when the data exists and nobody has time to read it. In our deployments the first question founders ask is rarely about clicks. It is about which product, channel, or cost line moved margin last month, and why.
Q2. How were these 10 tools scored and ranked? [toc=2. Scoring Methodology]
Each tool is scored on five weighted criteria: Measurement Accuracy (25%), Depth of Reasoning and Root-Cause Analysis (25%), Proactive Alerting and Reporting (20%), Setup and Usability (15%), and Pricing Transparency (15%). Stars are awarded in bands from one to five. Luca AI publishes this rubric and is scored against it on exactly the same terms as every other tool listed here.
📊 The rubric, in full
Scoring Rubric and Weights
Criterion
Weight
What it measures
Measurement Accuracy
25%
Can the tool produce a number you would defend to your accountant?
Depth of Reasoning and Root-Cause Analysis
25%
Does it explain why a metric moved, or only that it moved?
Proactive Alerting and Reporting
20%
Does it tell you first, or wait for you to log in?
Setup and Usability
15%
Days to first useful answer, without hiring anyone
Pricing Transparency
15%
Is the real price published, or quoted after a sales call?
Weights are published so you can rescore for your own situation. If you have a data analyst already, drop reasoning to 10% and raise accuracy.
🧮 Why these weights, and not others
Measurement accuracy carries the heaviest weight because every downstream decision inherits its error. Kunle Campbell frames the operator standard well on the 2X eCommerce podcast: marketing efficiency ratio is total revenue divided by total marketing spend, and a baseline MER sits near 3. A tool that cannot defend that blended number is decoration.
Reasoning depth carries equal weight for a simpler reason. Knowing ROAS fell is worth very little. Knowing it fell because returns spiked on one SKU changes what you do on Monday, which is the whole point of e-commerce business intelligence.
⏰ Why alerting is weighted at 20%
Most operators check dashboards weekly. Problems do not wait a week. Luca AI scans connected data continuously and pushes alerts when CAC spikes or inventory drops below a set threshold, which is the behaviour this criterion rewards.
Pricing transparency sits at 15% because hidden pricing costs real money at the negotiation table. One Polar Analytics customer reported that the price quoted after installation was far higher than the price shown in the Shopify listing.
⭐ How stars were awarded
Score Bands and Star Ratings
Band
Stars
0 to 20
⭐
21 to 40
⭐⭐
41 to 60
⭐⭐⭐
61 to 80
⭐⭐⭐⭐
81 to 100
⭐⭐⭐⭐⭐
Meta Ad Library scores oddly here, and I want to flag that. It earns full marks on price and setup, and near zero on reasoning. A free tool with one job can still beat a paid tool with ten.
⚠️ Where this rubric is weak
I wrote this rubric, and my company sells one of the tools on the list. That is a conflict, so here is the honest disclosure. Luca AI drops points on Pricing Transparency, because plans are quoted per business rather than published in full, and that is scored the same way it would be for Northbeam or Peel Insights.
The rubric also ignores support quality, which turns out to matter enormously. Verified reviewers flag slow response times as the main frustration with tools that otherwise work well. If support is your history of pain, add it as a sixth criterion and take the 15 points from setup.
Luca AI is scored here on measurable behaviour, not on marketing claims: data normalised on ingestion, plain-English questions across connected sources, and alerts pushed to Slack or email. Where it underperforms, the rubric says so.
Q3. Why are operators leaving Lebesgue, and what exactly are you replacing? [toc=3. Why Leave Lebesgue]
Three push factors recur: attribution accuracy doubts, a granularity ceiling against enterprise tools, and pricing metered on revenue and order volume. But Lebesgue does two jobs at once. It runs attribution and LTV, plus competitor monitoring and benchmarking against 20,000+ brands. Most replacements cover only one, so price your swap as a stack against Lebesgue's $79 Ultimate tier.
🔎 Start with the SERP's own mistake
Search this keyword and the top directory result recommends ActiveCampaign, HubSpot, Constant Contact, and Mailchimp. Those are email and marketing automation tools. G2 files Lebesgue under Social Media Advertising Software, which is how that answer happens.
That matters because you may have already shortlisted from a bad list. The operator-relevant set is Polar Analytics, Triple Whale, Northbeam, Lifetimely, Elevar, Fairing, KnoCommerce, and Peel Insights, all of which sit inside the wider field of e-commerce analytics platforms.
✅ Lebesgue is not a bad product
Lebesgue holds a 4.9 rating on the Shopify App Store across 150+ reviews on one listing. It supports WooCommerce as well as Shopify. It runs from free to $79 a month, with roughly 30% off annually.
So this is not a rescue mission. This is a brand outgrowing a tool in one specific direction, which is a different problem.
❌ The three receipts
Attribution trust. Independent review aggregation describes attribution accuracy as a category-wide weak point, with signup and conversion source tracking called unreliable.
Granularity ceiling. Even friendly roundups concede Lebesgue is less granular than enterprise tools.
Metered pricing. Tiers step on order volume, so a good quarter raises your bill.
🧩 The part nobody writes down
Lebesgue bundles four capabilities: attribution, LTV and cohorts, competitor ad monitoring, and peer benchmarking. The alternatives split them.
Which Alternatives Cover Each Lebesgue Capability
What Lebesgue does
Who covers it
Attribution and tracking
Triple Whale, Elevar, Northbeam
LTV and cohort profit
Lifetimely, Peel Insights
Competitor ad monitoring
Meta Ad Library
Peer benchmarking
Largely uncovered by this set
Peer benchmarking is the honest gap. If comparing yourself to 20,000 brands is why you bought Lebesgue, no single tool here replaces that cleanly.
💰 Do the stack math before you cancel
A realistic replacement is two tools. Triple Whale Free plus Meta Ad Library costs nothing, and covers tracking and competitor creative. Triple Whale Starter at $149 plus Elevar at roughly $200 pushes you well past $79, which is worth weighing against your whole e-commerce software budget.
My read is blunt. If your only complaint is price, staying on Lebesgue is the correct financial answer. Switching to feel productive is an expensive habit.
⭐ What buyers say about the upgrade path
"Not impressed compared to price point. I believe this is a great product, and solves many problems for brands with more complex reporting. However, from the get go there were some discrepancy in the pricing." MajaPolar Analytics TrustPilot Verified Review
"Sometimes the data takes time to update, and some ratios are more difficult to understand." Juliette P., CEOPolar Analytics G2 Verified Review (4.5/5)
⚠️ The twist worth sitting with
Here is the uncomfortable part. Most operators leave over attribution, then discover the new tool has the same problem. That is the subject of the next section, so hold the thought.
Luca AI does not replace a pixel and never claims to. If raw attribution is your single complaint, Elevar or Polar is the shorter, cheaper path, and I would rather you take it.
Q4. Deterministic or modelled: why does your CAC change depending on which tool you buy? [toc=4. Attribution and CAC Accuracy]
Deterministic tools match orders to touchpoints at the order level. Modelled tools estimate, and estimates degrade under iOS privacy limits, with roughly 20 of every 100 orders missing from GA integrations. That is why published blended DTC CAC ranges from about $87 to Shopify's $226 figure. Fix your own CAC definition before comparing any two dashboards.
🧠 Three methods, in plain English
Deterministic means the tool sees an actual order and an actual click, and joins them. High confidence, but it only sees what tracking captured.
Modelled means statistics fill the gaps. Useful at scale, unreliable when volume is thin. Media mix modelling, or MMM, ignores individual clicks entirely and studies spend against revenue over time.
❌ Switching tools does not fix attribution
This is the part affiliate roundups skip. Attribution and measurement accuracy is the most-discussed theme in public conversation about Triple Whale, at 151 mentions, and Northbeam, at 99.
The complaint follows you. Buyers describe the same gap in their own words, and it shows up across e-commerce performance analytics tools rather than in one product.
"The dashboard part, for some reason the data is not correct, its as if the dont take into account returns or something, on the dashboard I get overestimated sales and ROAS" Verified UserTriple Whale G2 Verified Review (4/5)
"The change to GA4 has been for the worse. Functionalities have been lost, it has switched to a hit measurement model but there is data loss, for example, sessions do not match the session_start event. To make decisions based on grounded data, it is really difficult to trust it 100% and it complicates decision-making." Verified User in RetailGoogle Analytics G2 Verified Review (1.5/5)
📉 The benchmark spread proves the problem
Look at published 2025 and 2026 numbers for one metric. Blended DTC CAC lands near $87 in aggregate data, with top-quartile brands near $42. Shopify's own US retail figure sits near $226.
Channel level is tighter but still wide. Meta runs about $53, Google $62, TikTok $46, and email or SMS between $8 and $15. Median CPA across paid channels was $32.74 in 2025, up 8.64% year on year, which is why the KPIs you track matter more than the dashboard you buy.
🧾 Write your CAC definition once
Lara Bay, a DTC finance operator, argues that acquisition cost belongs inside unit economics, not beside them. If you spend money to sell a unit, that spend is a variable cost of the sale.
Write these five lines down and enforce them everywhere:
Numerator includes all paid media, agency fees, and creative costs.
Numerator excludes salaries unless the role is purely acquisition.
Denominator counts new customers only, not repeat orders.
Returns are deducted from revenue before margin is calculated.
The measurement window is fixed, and never changed mid-quarter.
⏰ What to do this week
Pick your attribution source and stop arguing with it. Run a post-purchase survey through Fairing or KnoCommerce as a second opinion. Compare both against native Shopify reporting weekly for 60 days.
If the three disagree by less than 15%, you are fine. Ask Luca AI to send that three-way comparison as a scheduled weekly report with the reasoning attached, so the reconciliation stops eating your Sunday night.
⚠️ One honest caveat
My read is that operators overweight attribution and underweight margin. I could be reading that too strongly, since the founders I sit with are usually already profitable on paper.
Luca AI takes whichever attribution model you already trust as an input, then applies one fixed CAC definition across channels in every automated report. The number stops changing depending on which tab you open.
Q5. How accurate is competitor ad spend and revenue data, really? [toc=5. Competitor Data Accuracy]
Less accurate than the interface implies. Across a 100,922-store study, competitor revenue estimates ran 30% to 50% accurate and traffic estimates 40% to 60%, while pixel detection held at 85% to 95% and Shopify Plus detection above 95%. Use competitor tools for stack, creative, and pricing signals. Do not set a budget against someone else's estimated revenue.
📊 The accuracy table nobody publishes
Competitor Data Accuracy by Signal Type
Signal type
Accuracy
Verdict
Theme detection
90% to 95%
Trust it
Shopify Plus detection
95%+
Trust it
Pixel and app detection
85% to 95%
Trust it
Traffic estimates
40% to 60%
Directional only
Revenue estimates
30% to 50%
Ignore for planning
Those ranges come from testing tools against a verified database of 100,922 stores. The pattern is consistent. Anything a tool can observe directly is reliable, and anything it infers is not.
🔎 Why estimates break down
No external tool sees a competitor's actual orders. It sees traffic proxies, then applies assumptions about conversion rate and average order value. Both assumptions carry error, and errors multiply.
Traffic tools degrade further at small scale. SimilarWeb is usually within 30% of real numbers above 100,000 monthly visitors, and accuracy drops sharply below 50,000. Most brands reading this sit below that line, which is also why e-commerce website analytics should be read as a range, not a fact.
⚠️ Operators already know estimates lie
Reviewers say it plainly when a tool reports numbers that do not match reality.
"We are a startup company and mainly use Supermetrics for Shopify API. Data is inaccurate when it comes to Daily Total Sales and Returning Orders figures. Tickets have been opened since the start of January 2021 with barely any response whatsoever." Verified UserSupermetrics G2 Verified Review (2.5/5)
"Sampling, sampling, sampling. For a data and algorithm based company, Google does a terrible, terrible job of estimating reality out of the sampling they do. When we switched to an enterprise web analytics solution that does no sampling, we found that Google Analytics was telling us we had twice as much traffic as we actually do." Gitai B., Marketing, Web Analytics, and Testing LeadGoogle Analytics G2 Verified Review (1/5)
✅ The three signals worth watching weekly
Creative. Meta Ad Library shows every live ad, free, straight from the source.
Pricing. Watch list price movement, not estimated revenue.
Stack changes. A rival adding a subscription app tells you their retention plan, which is a signal worth tracking inside your own retention strategy.
Luca AI treats a competitor price move as an input to your own margin question, surfacing it only when your pricing should actually change.
💸 The 30% discount trick
One brand I looked at was running a permanent sale that was not a sale. They had inflated list prices by 30%, then discounted 30% to mimic a promotion. Estimated revenue tools read that as strength.
Contribution margin would have read it as desperation. That gap is the whole problem with buying someone else's estimate.
⏰ What to do with 20 minutes this week
Open Meta Ad Library. Search your three closest competitors. Note which ads have been running longest, because duration signals what works.
Then check their pricing page against yours. Those two free checks beat any paid revenue estimate you will buy this quarter.
Luca AI runs the same discipline internally, joining observed data across your connected sources rather than reporting inferred numbers as fact. The competitor signal only matters once it touches your own margin.
Q6. Is your CAC actually bad? The 2026 benchmarks to check before you buy anything [toc=6. 2026 CAC Benchmarks]
Median CPA across paid channels was $32.74 in 2025, up 8.64% year on year, with Meta at $38.19 and paid conversion at 2.01%. Median DTC contribution margin sits at 15% to 20%, and median CAC payback at 6 to 9 months. If your MER is above 3 and payback is under 6 months, your problem is not the dashboard.
📉 The invoice that was not what it looked like
A founder I sat with slid an invoice across the table. Her best seller, 72% gross margin, the product she was scaling hardest. She was proud of it, and she should have been on paper.
Twenty minutes later she was crying. We had costed it line by line, and the real contribution margin was 8%.
❌ Gross margin is a lie
Gross margin tells you what it costs to make the thing. It says nothing about what it costs to sell the thing. The bleed happens in between, which is the distinction we unpack in contribution margin versus gross margin.
The eight costs between supplier invoice and actual profit are where brands die: freight, duties, payment fees, pick and pack, shipping, returns, discounts, and acquisition. Her product had a 22% return rate and 42% of all support tickets, which worked out to $1.45 per unit in support load alone.
📊 The 2026 numbers to check yourself against
DTC Benchmarks: Median Versus Top Quartile
Metric
Median
Top quartile
CPA, all paid channels
$32.74
Lower is table stakes
Meta CPA
$38.19
Under $25
Paid conversion rate
2.01%
3.2%+ (top 20%)
Contribution margin
15% to 20%
30%+
CAC payback
6 to 9 months
Under 3 months
LTV to CAC
2.8x
6.5x (top decile)
Sources are the Triple Whale 2025 benchmark set, built on 33,000+ brands and $18.4B in ad spend, plus percentile data on payback. Read them next to your own customer lifetime value curve rather than in isolation.
⚠️ Why your unit economics stopped working
The market moved against you. In 2025, CPMs rose 16%, CPA rose 8.6%, and ROAS fell 5.7%, while average order value rose only 2.6%.
Read that again. Costs rose four times faster than order value. No dashboard fixes that, which is why the game shifted from ad optimisation to business optimisation, and why platform ROAS and true profitability keep drifting apart.
✅ The Monday morning SKU audit
Take your top five products by revenue. In one spreadsheet, subtract every cost per unit, including returns, discounts, and allocated support tickets.
Rank them by contribution margin, not revenue. My honest expectation is that one of your top three sellers is closer to breakeven than you think.
💰 What this changes about tool shopping
If your payback is under 6 months and margin is above 20%, you do not need new software. You need more inventory and more spend.
Luca AI is built for the opposite case, tracing a margin drop back to the SKUs, channels, and cost lines that caused it. In our deployments, the answer is usually one product and one cost line, not a broken attribution model.
I could be reading this too strongly. The founders I sit with are already profitable, which biases the sample toward margin problems over measurement problems.
Q7. Which alternative fits your stage, and how do you switch without losing history? [toc=7. Stage Fit and Migration]
Under $500k GMV, stay on a free or entry tier and add Meta Ad Library. At $500k to $5M, choose Triple Whale for creative depth or Elevar for tracking integrity. Above $5M, Polar Analytics for warehouse-grade data, and Luca AI for reasoning across it. Whichever you pick, run both tools in parallel for 60 days before cancelling anything.
🎯 Stage fit, with the honest exclusions
Which Lebesgue Alternative Fits Your Stage
Your stage
Pick
Not recommended
Under $500k GMV
Triple Whale Free plus Meta Ad Library
Anything above $150 a month
$500k to $5M, Meta-led
Triple Whale Starter
Northbeam, too costly for one channel
$500k to $5M, tracking broken
Elevar, around $200 a month
Adding a second analytics tool first
$5M+, wants data ownership
Polar Analytics
Closed-ecosystem tools
$1M to $5M, data piling up unused
Luca AI, from €299 a month
Enterprises with data teams
Two scenarios where switching is a mistake: your only complaint is price, or you are inside your peak selling season. If neither applies, our AI tools for Shopify owners comparison is a useful second read before you commit.
⚠️ Setup effort is a real cost
Buyers consistently flag that serious tools are not plug and play.
"Mobile limitations and the platform isn't a plug-and-play solution, it requires time and effort to learn its advanced features and capabilities. There are instances that certain intergrations are not yet fully functioning so you have to always check with Customer Support." Charlene R., Head of Operations, HR & CulturePolar Analytics G2 Verified Review (5/5)
"It requires a lot of setup and manual work to get what you really need. The UI is hideous, and we run into problems often with GA not tracking things correctly. It has pretty substantial limitations for ecommerce tracking and often isn't close to accurate for conversion rate, number of orders, or revenue." Verified User in Information Technology and ServicesGoogle Analytics G2 Verified Review (1.5/5)
🧾 The 60-day switching protocol
Export your history first. LTV cohorts and monthly CAC into a sheet, before you touch anything.
Install the new pixel before cancelling the old one. Lookback windows rebuild from install date, and Triple Whale's free tier backfills 12 months.
Run both tools in parallel. Two months, no exceptions.
Verify weekly against native Shopify reporting. That is the only source both tools must agree with, and it is where a clean Shopify reporting baseline earns its keep.
Check data ownership before you commit. Warehouse-backed tools leave raw data with you, closed ecosystems keep it.
Never migrate inside peak season. You will lose trend continuity when you most need it.
Luca AI normalises and standardises data on ingestion, so exported history lands queryable instead of waiting behind a cleanup project.
⏰ The schema trap most people hit
Migrations stall on boring mismatches. One system calls it retail week 554, another calls it week 332, and suddenly nothing reconciles.
Budget a week for that, not an afternoon. Ask Luca AI to handle the data management and reconcile the calendars during ingestion, or expect to do it yourself in a spreadsheet.
💰 What I am watching next
My read is that the tool question gets less interesting by 2027. Measurement will keep degrading, and the winners will be operators who fix their cost data instead of chasing better click credit.
I might be wrong about the timeline. If you switch off Lebesgue this quarter, tell me what broke, because the migration receipts are the part nobody publishes.
Luca AI traces a repeat-rate drop to one discount cohort and projects the recovery math.
FAQ's
What is the best Lebesgue alternative for e-commerce brands in 2026?
There is no single winner, because Lebesgue bundles two separate jobs. It runs attribution and LTV reporting, and it also monitors competitor ads and peer benchmarks. Most alternatives cover only one of those.
For attribution and tracking: Triple Whale, Elevar, or Northbeam.
For LTV and cohort profit: Lifetimely or Peel Insights.
For competitor creative: Meta Ad Library, which is free and official.
For reasoning across all of it: Luca AI, which sits over your connected data rather than replacing a pixel.
Luca AI connects Shopify, Meta, Google, Klaviyo, and your accounting stack, then answers questions about CAC and margin in plain English. That makes it the pick when the data already exists and nobody has time to read it, which is the state most brands between one and five million in revenue are actually in.
Peer benchmarking against twenty thousand brands is the honest gap. No tool on this list replaces that cleanly. If benchmarking is the only reason you bought Lebesgue, staying is a defensible call. Our wider breakdown of e-commerce analytics platforms maps where each category starts and stops.
Is there a free Lebesgue alternative that still tracks ad spend and CAC?
Yes, and two of them are genuinely useful rather than trial-ware.
Triple Whale Free costs nothing and includes the Triple Pixel with first and last-click attribution plus a twelve-month lookback window.
Meta Ad Library is free and official, showing every ad a competitor is currently running, including run dates and placements.
Lebesgue itself keeps a free tier, so leaving purely to save money is often the wrong trade.
Run that free pair for sixty days before you spend anything. If you still cannot explain why margin moved last month, that is your signal to pay for software. Buying a tool before you can name the question is how software budgets quietly become the new ad waste.
The free stack has a hard ceiling. It shows you what happened and what competitors are advertising. It will not tell you which SKU, channel, or cost line caused a margin drop, because it never sees your cost data.
Luca AI is built for that second problem, joining commerce, ad, and finance data so the answer arrives with reasoning attached. Before upgrading, it is worth benchmarking against your own unit economics rather than a vendor's demo numbers.
Will switching from Lebesgue actually fix my attribution accuracy?
Probably not, and this is the part affiliate roundups avoid saying. Attribution accuracy is the single most-discussed complaint across the whole category, not a Lebesgue-specific defect.
Public operator conversation logs 151 mentions of measurement accuracy for Triple Whale and 99 for Northbeam.
Roughly twenty of every hundred orders fail to appear correctly in analytics integrations.
Independent review aggregation describes conversion source tracking as unreliable industry-wide.
Deterministic tools match an actual order to an actual click. Modelled tools estimate the gaps, and those estimates degrade under browser privacy limits. Neither approach is wrong, but both produce a number you should verify.
The practical move is triangulation rather than replacement. Pick one attribution source, add a post-purchase survey as a second opinion, and check both against native Shopify reporting weekly for sixty days. If the three disagree by less than fifteen percent, stop optimising the measurement and go work on margin.
Luca AI takes whichever attribution model you already trust as an input, then applies one fixed CAC definition across every scheduled report, so the number stops changing depending on which tab you open. That distinction between reported ROAS and true profitability is where most switching decisions actually get decided.
How much do Lebesgue alternatives cost per month?
Pricing verified August 2026. The spread is wide, and several vendors do not publish real numbers at all.
Elevar: around 200 dollars a month for server-side plans.
Polar Analytics: roughly 300 dollars a month at entry, reported as high as 750 dollars.
Luca AI: Starter at 299 euros, Growth at 499 euros, Scale custom.
Northbeam and Peel Insights: custom pricing, not published.
Lebesgue itself runs from free to 79 dollars a month, metered on revenue and order volume. That is the number your replacement stack has to beat, and a two-tool stack usually does not.
Watch for quote drift. One verified reviewer reported that the price quoted after installation was materially higher than the price shown in the app listing, so get your number in writing before you migrate anything.
Luca AI prices per business rather than per order, which suits brands whose order count spikes seasonally and whose metered bill jumped after a good quarter. Current tiers are listed on our pricing page.
How do I switch off Lebesgue without losing my historical data?
Treat it as a sixty-day parallel run, not a cancellation. Migrations fail on boring details, and the damage shows up a quarter later when your trend lines have a hole in them.
Export first. Pull LTV cohorts and monthly CAC into a sheet before touching anything.
Install the new pixel before cancelling the old one. Lookback windows rebuild from install date, and free tiers typically backfill only twelve months.
Run both tools together for two months. No exceptions.
Verify weekly against native Shopify reporting. That is the one source both tools must agree with.
Check data ownership. Warehouse-backed tools leave raw data with you, closed ecosystems keep it.
Never migrate inside peak season.
Budget a week for schema mismatches. One system calls it retail week 554, another calls it week 332, and suddenly nothing reconciles.
Luca AI normalises and standardises data on ingestion, so exported history lands queryable on day one instead of waiting behind a cleanup project. If you want the reconciliation handled automatically, that is a question of e-commerce data management rather than dashboard choice.
Enjoyed the read? Join our team for a quick 15-minute chat — no pitch, just a real conversation on how we’re rethinking Ecommerce with AI - Luca
Loading Schedule...
Your AI Co-Founder is here.
Here’s why:
Shopify, Meta, Xero - one brain.
"Should I scale?" Answered with real data.
Growth capital. No applications. One click.
Thank you! Your submission has been received! Please book a time slot for the Meeting
Oops! Something went wrong while submitting the form.