Top 18 Ecommerce KPIs Spanning Acquisition, Conversion, Retention, Fulfillment, and Margin Decision Workflows
13
mins read
TL;DR
Ecommerce KPIs aren't broken, the way operators consume them across Shopify, Meta, Klaviyo, GA4, and Xero is. The 18 KPIs that matter span Acquisition, Conversion, Retention, Fulfillment, and Margin, each with a clear data source and decision trigger. Stage-based KPI focus matters: survival math at €1M, efficiency math at €5M, and capital-efficiency math at €20M+. True CAC, true CLV, and contribution margin are the three most miscalculated KPIs and decide whether your store survives. Dashboards display history, an AI analytics layer reasons, simulates scenarios, and pushes customized digests to Slack and email. Investor KPIs and operator KPIs rarely reconcile because they pull from different source systems on different windows.
Q1. Why Are Ecommerce KPIs Broken in 2026, And What Changed? [toc=1. KPIs Broken in 2026]
A founder running a €4M skincare brand on Shopify pinged me at 11:47pm last Tuesday. Her message was three words: "Did we profit?" She had Triple Whale open, GA4 open, Klaviyo open, a Xero export downloading, and a spreadsheet with 31 tabs. She still could not answer that question. This is the 2026 reality of ecommerce KPIs. Operators do not lack metrics. They drown in them. The tools display history. They do not reason. And the gap between "what happened" and "what to do next" is where most scaling brands quietly bleed margin every Tuesday afternoon.
Ecommerce KPIs aren't broken, the way operators consume them is. Most scaling DTC brands track 25 to 40 metrics across Shopify, Meta, Klaviyo, GA4, and Xero, yet still spend 10 to 15 hours weekly stitching CSVs to answer one question. The 2026 shift is from passive dashboards that display history to an AI analytics layer that extracts the right slice of data on demand, finds root causes, simulates scenarios, and pushes customized reports to Slack and email automatically.
Dashboards display, an AI analytics layer reasons, simulates, and reports across all your connected data.
The Monday Shudder Is Real
Every founder I work with has the same routine. Open six tabs. Export CSVs. Paste into a master sheet. Reconcile Meta's revenue number against Shopify's. Then question reality.
This routine is what Ken Price of Blake Mill called "drinking from a fire hydrant," too much data, no synthesis layer. Reddit threads in r/shopify and r/ecommerce echo the same exhaustion every week.
Dashboards Display, They Don't Reason
Triple Whale, GA4, and Looker were built for a 2019 ecommerce world. Show the metric. Display the trend. Hand the founder a chart.
"Our experience with Triple Whale has been extremely frustrating and almost categorically terrible. The integrations are inconsistent, building with the AI tool Moby is very buggy and crashes more than half the time, and support is largely unresponsive." Matt Huttner Triple Whale Trustpilot Verified Review
The architectural limit is the same across all of them. ❌ They display data, but they do not extract the right slice on demand, simulate scenarios, or run root-cause attribution across creative, audience, and cohort.
The Synthesis Thesis
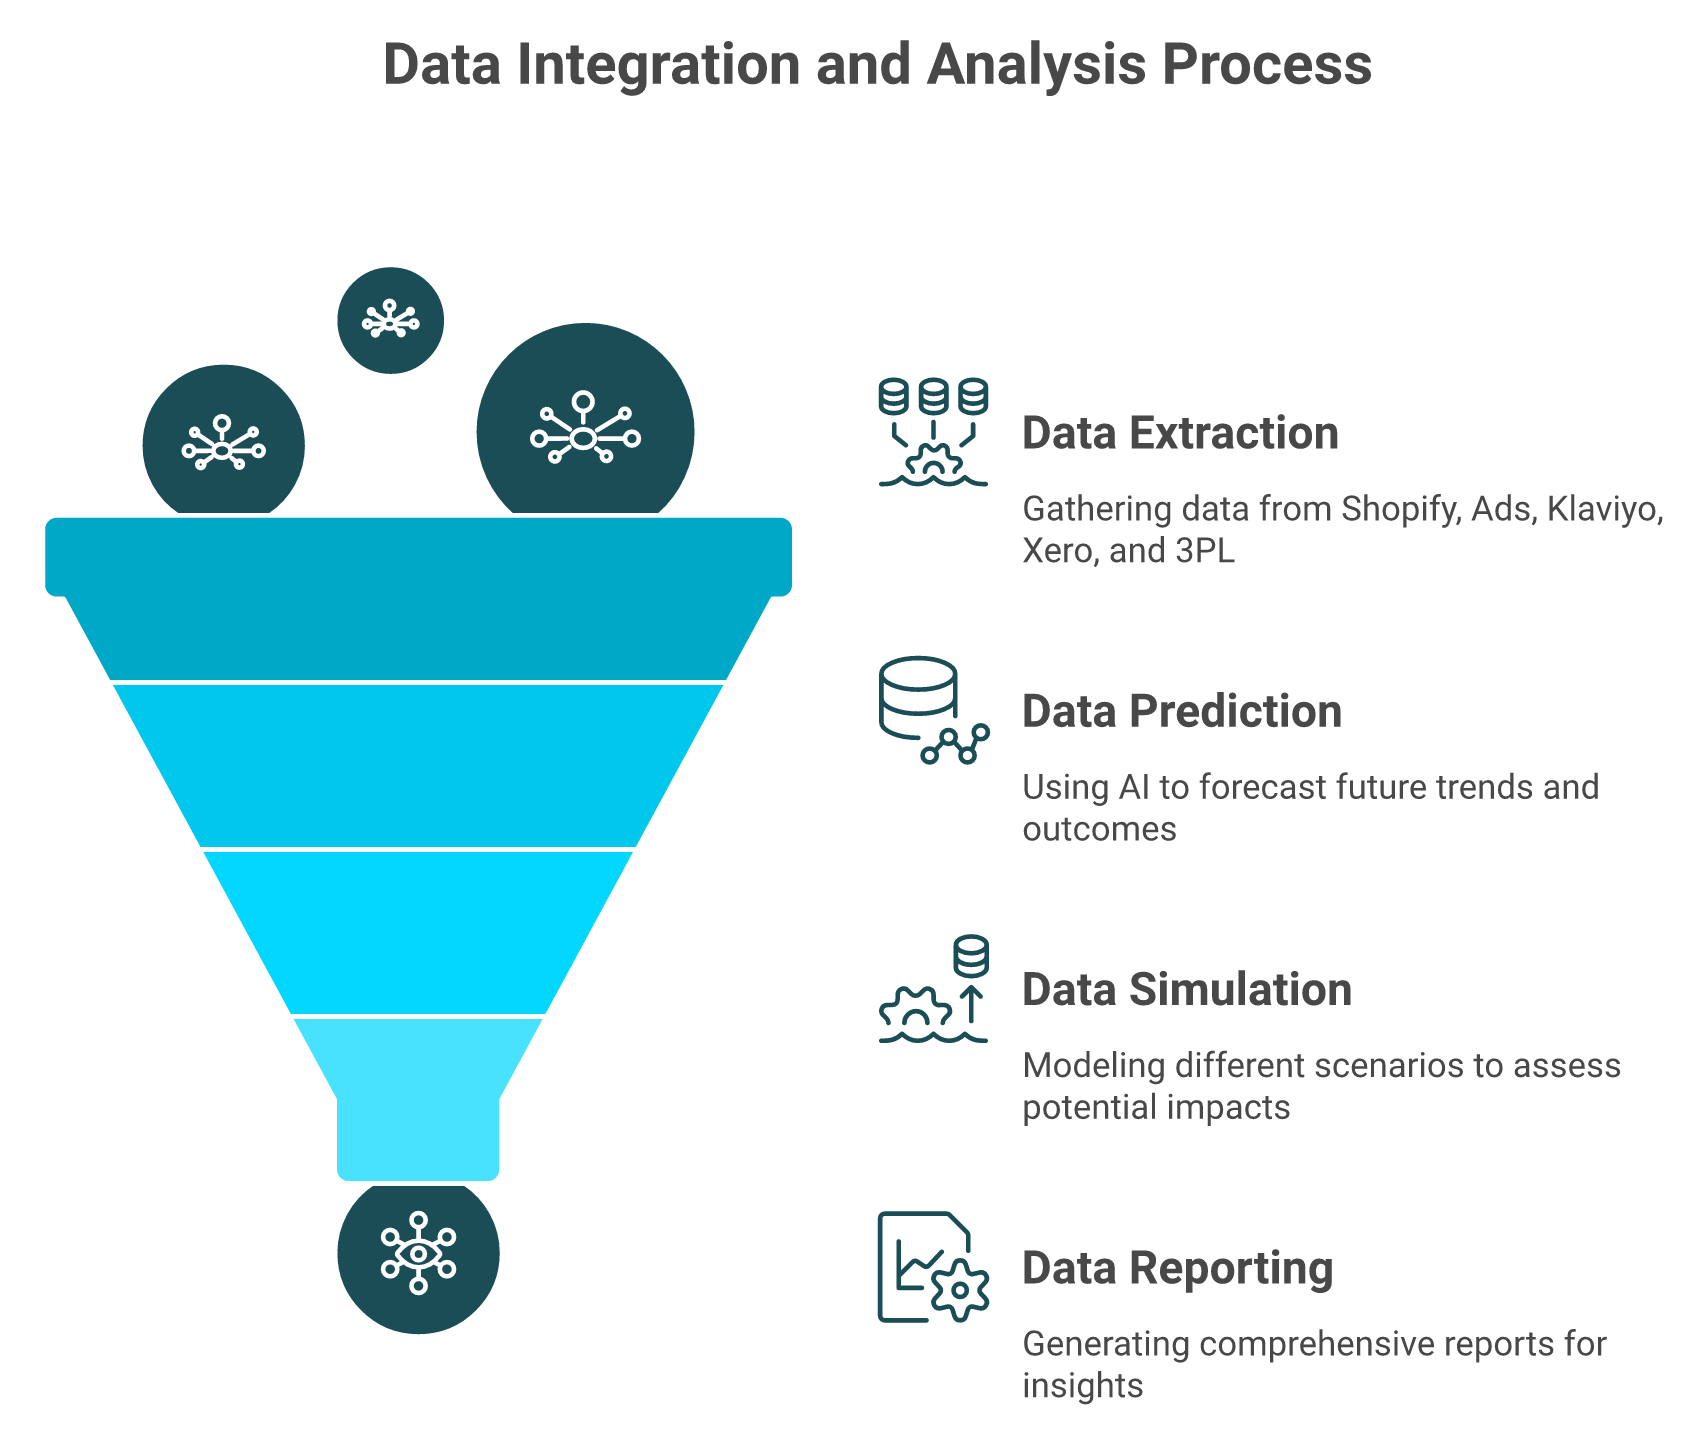
The shift in 2026 is from stitched dashboards to an AI layer sitting over a unified data warehouse. ✅ That layer does five things dashboards cannot.
Extracts the relevant slice of data for the question you actually asked
Predicts outcomes based on historical patterns across your store
Simulates "what if I shift €20K from Meta to TikTok" scenarios in seconds
Finds root causes by linking related metrics across silos
Pushes customized reports to Slack and email on a schedule you set
What Luca Looks Like in Practice
We built Luca as that layer. Ask a plain-English question. Luca extracts data from Shopify, Meta, Klaviyo, and Xero, runs root-cause attribution, and sends the answer with reasoning and charts. No SQL. No CSV exports. No tab-juggling.
The same logic applies to dashboards. You should not pay €600 a month for a tool that hands you a chart and walks away.
The Defining Contrast
Dashboards tell you ROAS dropped. An AI analytics layer tells you which creative, which audience, which cohort, and which landing page caused the drop. That is the 2026 shift in one sentence.
Q2. What Are the Top 18 Ecommerce KPIs Every Scaling DTC Brand Must Track? [toc=2. Top 18 KPIs]
Most KPI articles list 30 metrics and call it done. That is not a playbook. That is a glossary. After looking at hundreds of DTC P&Ls, the honest count of KPIs that actually drive decisions for a scaling Shopify brand is 18. They span five workflows. Each one has a formula, a benchmark, a data source, and a decision trigger.
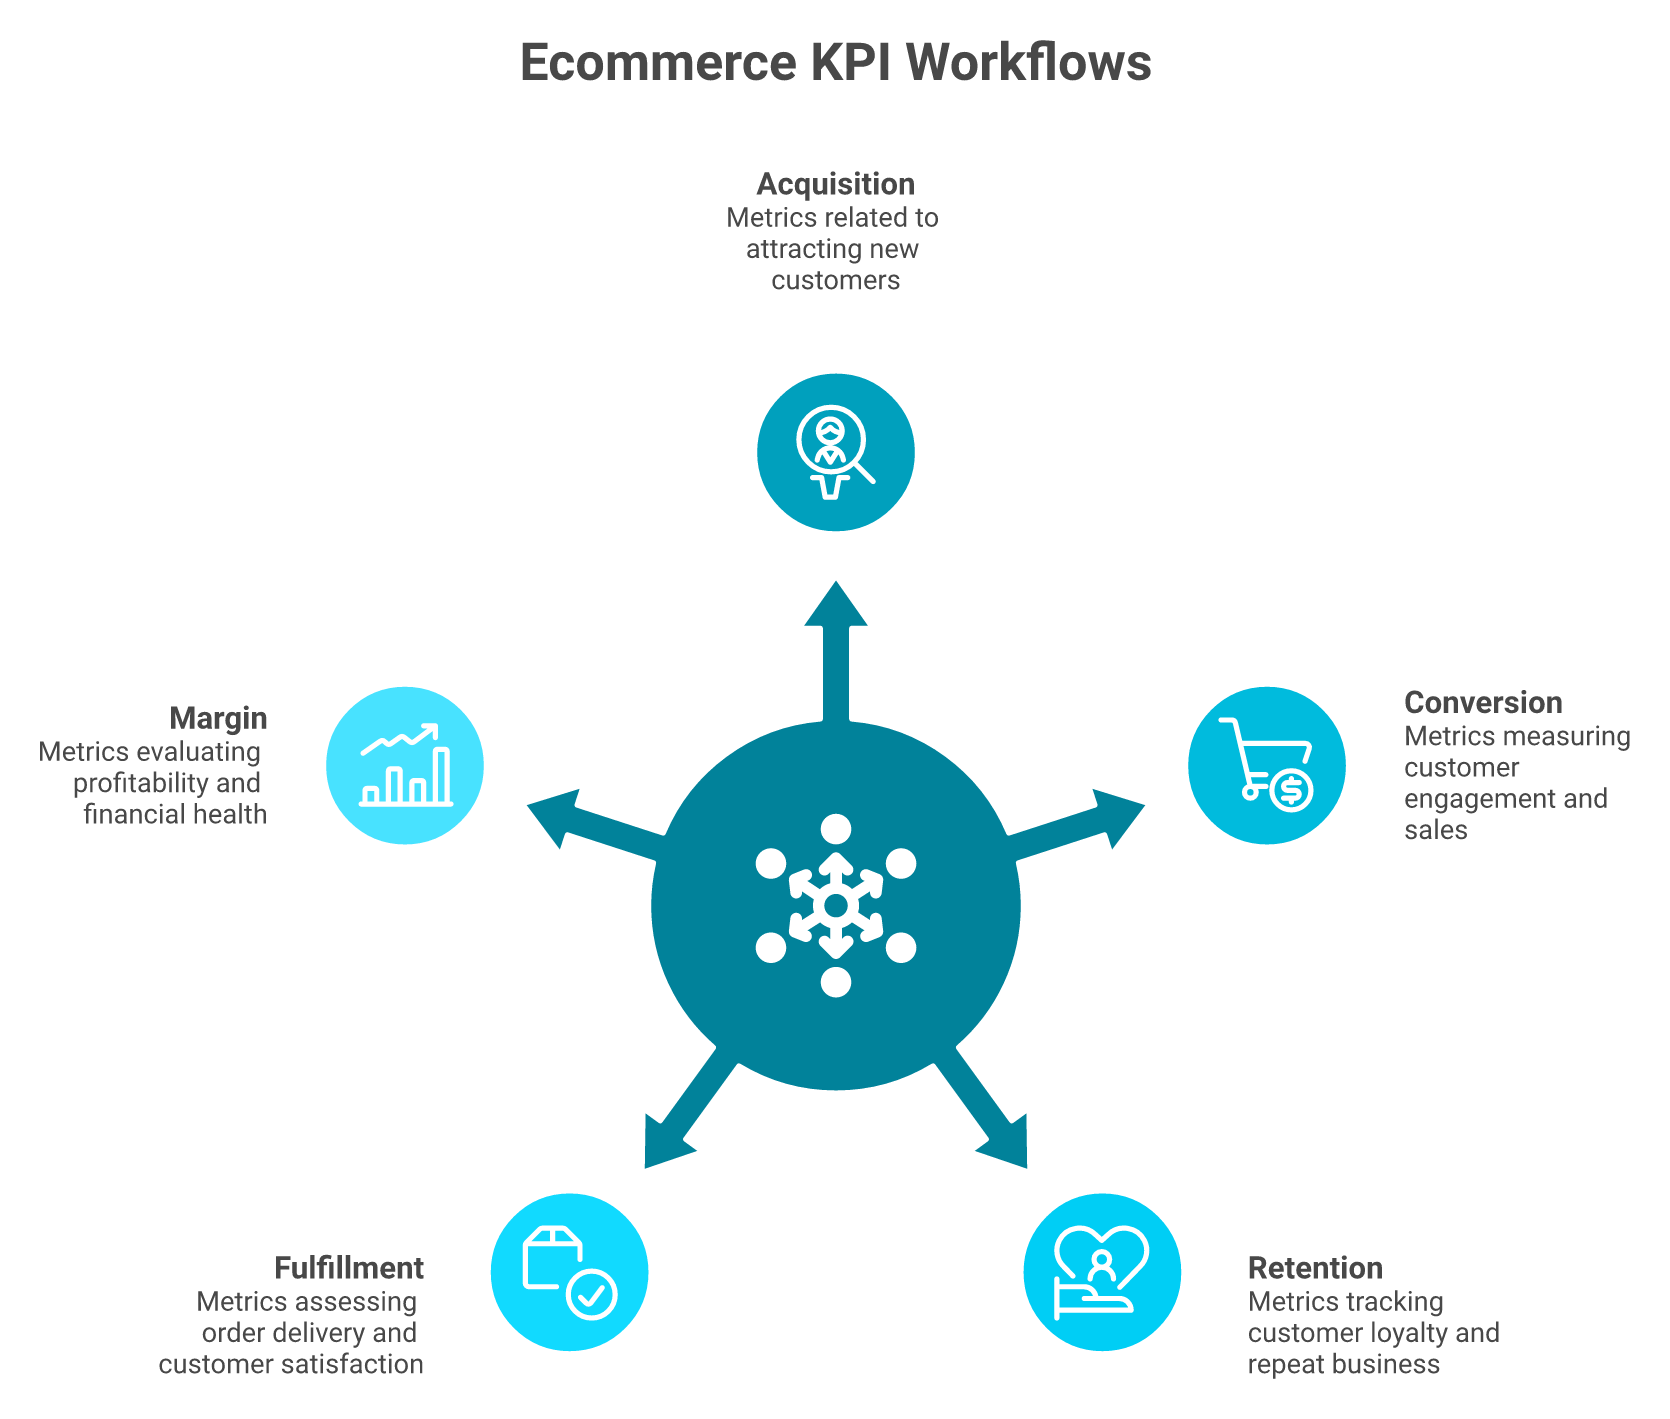
The 18 KPIs that matter span five workflows: Acquisition (CAC, blended MER, CPM, and new-customer ROAS), Conversion (CVR, AOV, add-to-cart rate, and checkout abandonment), Retention (CLV, repeat purchase rate, 90-day cohort retention, and churn), Fulfillment (OTIF, perfect order rate, return rate, and fulfillment cost per order), and Margin (contribution margin and gross margin). Each maps to a specific data source and a decision trigger.
The 18 KPIs that decide whether a scaling DTC brand can buy growth profitably, grouped by workflow.
The Top 18 KPIs at a Glance
CAC (Customer Acquisition Cost)
Blended MER (Marketing Efficiency Ratio)
CPM (Cost per Thousand Impressions)
New-Customer ROAS
CVR (Conversion Rate)
AOV (Average Order Value)
Add-to-Cart Rate
Checkout Abandonment Rate
CLV (Customer Lifetime Value)
Repeat Purchase Rate
90-Day Cohort Retention
Churn Rate
OTIF (On-Time-In-Full)
Perfect Order Rate
Return Rate
Fulfillment Cost per Order
Contribution Margin
Gross Margin
The Master KPI Reference Table
Master KPI Reference
KPI
Formula
What Good Looks Like
Data Source
Decision Trigger
CAC
(Total ad spend + creative + agency + tooling) / new customers
€22 to €67 (vertical-dependent)
Meta + Google + Shopify + COGS
Pause channel if 30% above blended target
Blended MER
Total revenue / total marketing spend
2.8x to 4.5x
All ad platforms + Shopify
Scale if MER holds above 3.5x for 14 days
CPM
(Ad spend / impressions) × 1,000
€8 to €22 (Meta)
Meta + Google Ads
Refresh creative if CPM up 25% WoW
New-Customer ROAS
New-customer revenue / ad spend
1.4x to 2.4x
Meta + Shopify (first-order tagged)
True profitability check vs blended
CVR
Orders / sessions
1.2 to 4.5%
Shopify + GA4
Drop = funnel friction or traffic-quality issue
AOV
Revenue / orders
€40 to €280 (vertical)
Shopify
Bundle, upsell, or shipping-threshold lever
Add-to-Cart Rate
ATCs / sessions
6 to 11%
Shopify + GA4
PDP issue if low
Checkout Abandonment
(Checkouts started − orders) / checkouts started
60 to 75%
Shopify
Shipping cost or payment friction
CLV
Σ(gross profit per order × repeat probability)
3x CAC minimum
Shopify cohorts + Klaviyo
Underwrite acquisition spend
Repeat Purchase Rate
Repeat customers / total customers (90d)
18 to 48% (vertical)
Shopify
Retention spend trigger
90-Day Cohort Retention
% cohort active at day 90
22 to 42%
Shopify cohorts
Product-experience signal
Churn Rate
Customers lost / total (subscription)
Less than 8% monthly
Recharge / Shopify
Subscription health
OTIF
Orders delivered on time and complete / total
95%+
3PL + Shopify
3PL renegotiation trigger
Perfect Order Rate
(1 − defect rate) across pick, pack, ship, deliver
CAC, blended MER (Marketing Efficiency Ratio, total revenue divided by total marketing spend), CPM, and new-customer ROAS together tell you whether you can buy growth profitably. Watch new-customer ROAS, not blended ROAS. Blended hides the truth.
Conversion KPIs
CVR (conversion rate, orders divided by sessions), AOV (average order value), add-to-cart, and checkout abandonment isolate where in the funnel money leaks. A 30% drop in add-to-cart with stable traffic almost always points to a product detail page issue.
Retention KPIs
CLV (customer lifetime value), repeat purchase rate, 90-day cohort retention, and churn measure whether your acquisition spend compounds. Anthony Mink (Live Bearded) found that customers buying across 3 or more product categories drove the largest LTV jumps in his data, frequency alone was a weaker lever.
Fulfillment KPIs
OTIF (on-time-in-full, orders delivered complete and on schedule), perfect order rate, return rate, and fulfillment cost per order quietly compress margin. Most founders track none of them weekly. That is why margin "mysteriously" erodes.
Margin KPIs
Contribution margin and gross margin are the only KPIs investors and operators agree on. If contribution margin holds above 25%, you have permission to scale. Below 18%, you have a rebuild ahead.
We pull these 18 KPIs into Luca automatically across connected sources. Ask for a real-time contribution-margin breakdown by channel and you get one in seconds, not a weekend of CSV stitching.
Q3. Which KPIs Actually Matter at €1M, €5M, and €20M+ Revenue Stages? [toc=3. KPIs by Revenue Stage]
Andrew Faris said it cleanest on the 2x Ecommerce podcast. "Most brands are optimizing for the wrong metric at the wrong stage." At €1M, the math is survival. At €5M, the math is efficiency. At €20M, the math is capital efficiency. Tracking 18 KPIs at every stage means tracking nothing. The win is knowing which five to obsess over for your current revenue band.
At €1M, obsess over first-order contribution margin and CAC payback, survival math. At €5M, the lever shifts to repeat purchase rate, 90-day LTV, and blended MER, efficiency math. At €20M+, contribution margin per channel, cohort LTV by first SKU, and inventory cash conversion become dominant, capital efficiency math.
The five KPIs that matter shift dramatically as a DTC brand scales from €1M to €20M+ revenue.
Stage 1, €1M: The Survival Stack
⏰ Score yourself on these five. If three or more are missing, you are flying blind.
✅ First-order contribution margin tracked weekly
✅ CAC payback period under 90 days
✅ AOV trend over the last 12 weeks
✅ Blended MER over rolling 14-day window
✅ Inventory weeks-of-cover for top 5 SKUs
Stage 2, €5M: The Efficiency Stack
💰 At €5M, survival is solved. The new question is whether each acquired customer compounds.
✅ Repeat purchase rate at 90 days, segmented by first SKU
✅ 90-day cohort LTV vs. CAC
✅ Blended MER stability across 30-day window
✅ Email and SMS attributed revenue percentage
✅ Contribution margin by channel
Stage 3, €20M+: The Capital Efficiency Stack
⚠️ At €20M, money sits locked in inventory and ad spend. Every day matters.
✅ Contribution margin per channel per cohort
✅ Cohort LTV by first-SKU purchased
✅ Inventory cash-conversion cycle in days
✅ Net revenue retention (subscription brands)
✅ Fulfillment cost per order trending vs. AOV
Score Interpretation
Stage Score Read
Score
Read
5/5
You are tracking the right stack for your stage
3 to 4
Critical gaps, plug them this quarter
0 to 2
You are tracking 2024 KPIs in a 2026 business
Luca detects your revenue band from connected Shopify data and surfaces the relevant five-KPI subset on the home screen, so you stop staring at metrics that do not matter at your scale.
Q4. What Are Realistic KPI Benchmarks by Vertical (Apparel, Beauty, Supplements, Home, Food)? [toc=4. Benchmarks by Vertical]
The single most useless sentence in any KPI article is "a good conversion rate is around 2%." Compared to what? Apparel converts differently than supplements. Home goods convert differently than food. Vertical context changes the entire shape of the funnel. The benchmarks below are anchored to operator-published data from Triple Whale's State of DTC reports, Common Thread Collective, and Shopify Commerce Trends.
Apparel: CVR 1.8 to 2.6%, AOV €60 to €110, CAC €38 to €67, repeat 18 to 22%. Beauty: CVR 2.8 to 3.6%, AOV €40 to €75, CAC €22 to €45, repeat 28 to 34%. Supplements: CVR 3.2 to 4.5%, repeat 38 to 48% (subscription-driven). Home: CVR 1.2 to 1.8%, AOV €120 to €280, repeat 8 to 14%. Food/Bev: CVR 2.4 to 3.2%, AOV €35 to €65, repeat 32 to 42%. Treat as starting anchors, not ceilings.
The Vertical Benchmark Table
Vertical KPI Benchmarks
Vertical
CVR
AOV
CAC
90-Day Repeat
Contribution Margin
Apparel
1.8 to 2.6%
€60 to €110
€38 to €67
18 to 22%
22 to 28%
Beauty
2.8 to 3.6%
€40 to €75
€22 to €45
28 to 34%
28 to 34%
Supplements
3.2 to 4.5%
€45 to €85
€28 to €52
38 to 48%
30 to 38%
Home Goods
1.2 to 1.8%
€120 to €280
€55 to €110
8 to 14%
18 to 24%
Food and Beverage
2.4 to 3.2%
€35 to €65
€18 to €38
32 to 42%
20 to 28%
Apparel, The AOV Lever
Apparel runs on AOV, not frequency. Repeat rates stay in the 18 to 22% band because customers do not buy a hoodie every month. The win is bundling and upsell, not retention spend.
Beauty, The Repeat Lever
Beauty has the friendliest math in DTC. Lower CAC, higher CVR, real repeat behavior. The lever is replenishment cycles. Klaviyo data shows beauty brands attribute 25 to 35% of revenue to email when retention is run well.
Supplements, The Subscription Lever
Subscriptions distort everything. CVR looks high because the funnel is built around "subscribe and save." 90-day repeat in the 38 to 48% band is mostly auto-ship, not preference. Track churn, not repeat.
Home Goods, The CAC-Recovery Lever
Home goods CAC is brutal. Recovery happens through AOV, not repeat. If your AOV is below €120, the math rarely works.
Food and Beverage, The Frequency Lever
Food and bev has the highest repeat rates but the smallest AOV. The lever is order frequency and basket size, not new-customer acquisition.
Luca's benchmarking layer pulls peer-vertical cohort data from connected sources and shows how your store compares, not against a generic 2% CVR claim, but against brands in your category at your revenue band.
Q5. How Do You Diagnose a Failing KPI, Not Just Report It? [toc=5. Diagnose Failing KPIs]
It is 11pm. Your CAC (customer acquisition cost) just jumped 22% week over week. Your dashboard tells you the number. It does not tell you whether your creative is fatigued, your audience is saturated, or your landing page CVR collapsed on Sunday. You open Meta. You open Shopify. You open GA4. Forty-five minutes later, you still do not know what to fix before tomorrow's ad cycle.
This is the diagnosis gap. It is the single biggest complaint operators raise in r/ecommerce threads about generic KPI articles. A KPI is a symptom, not a diagnosis. If CAC is rising, check CPM trend, creative fatigue (CTR drop), audience saturation, and landing page CVR in that order. If CLV is falling, check repeat rate by first-SKU cohort before blaming retention.
Why Diagnosis Is Hard
Diagnosis is hard because the data lives in four tools. Meta has CPM and CTR. Shopify has CVR and AOV. Klaviyo has cohort behavior. Your 3PL has return data. ❌ No single dashboard joins all of these on demand.
A 24-hour delay on a CAC spike costs the average €5M brand €4K to €9K in wasted ad spend. A 72-hour delay on a CLV cohort drop compounds across every campaign you scaled into that cohort.
Three Diagnostic Playbooks
Playbook 1: CAC Up Week Over Week
When CAC jumps week over week, run these five diagnostic checks in order; the first failure is your root cause.
⚠️ Run these checks in order. The first failed check is your root cause.
CPM trend (Meta + Google) over 7 days
CTR by ad set, creative fatigue signal
Audience overlap and frequency, saturation signal
Landing page CVR by traffic source, funnel friction
New-customer mix vs. returning, attribution shift
Playbook 2: CVR Down Week Over Week
✅ Funnel-stage isolation tells you where the leak is.
Add-to-cart rate (PDP issue if dropped)
Checkout-initiated rate (cart friction if dropped)
Checkout-completion rate (payment or shipping friction)
Mobile vs. desktop CVR split (device-specific bug)
💸 CLV falls before retention metrics do. Catch it early.
90-day repeat rate by first-SKU cohort
AOV trend on second purchase
Email-engaged vs. non-engaged cohort split
Discount-acquired vs. full-price cohort split
Return rate by first SKU
How Luca Cuts This to 12 Seconds
We built Luca to act like a 24/7 sentry. Ask "why did CAC spike Tuesday?" and Luca extracts data from Meta, Shopify, and Klaviyo, runs root-cause attribution across creative, audience, cohort, and landing page, and answers in plain English with charts and reasoning.
"Triple Whale shows orders from external marketplaces as if they were real conversions even though these orders never go through our Shopify store. Completely fake data." XTRA FUEL Triple Whale Trustpilot Verified Review
The shift from reporting to reasoning is the difference between knowing CAC moved and knowing what to fix before tomorrow's ad spend cycle.
Q6. Where Does Each KPI Actually Live, Mapping Data Sources to Metrics? [toc=6. KPI Data Sources]
The most common KPI failure mode is not bad math. It is bad sourcing. Your Meta dashboard says €100K in attributed revenue. Your Shopify revenue report says €68K. Your bank account says €61K after refunds and fees. Three different numbers for the same week. Nothing is technically wrong. The systems each see a slice. The founder is left to triangulate.
Most KPIs require 2 to 4 source systems to compute correctly. CAC needs Meta + Google + Shopify orders + COGS. CLV needs Shopify cohorts + Klaviyo engagement + 3PL return data. Contribution margin needs ad spend + COGS + shipping + payment fees. The reason your dashboard says one number and your bank account says another is almost always a data-source mismatch, not a metric definition error.
Why Source Mismatches Happen
Meta uses a 7-day click attribution window by default. Shopify uses last-click. GA4 uses data-driven attribution. None of them agree on what "a Meta-attributed sale" means. Add platform-specific issues and the gap widens further.
Operators end up reconciling manually every week. After looking at hundreds of reconciliation exports, what jumps out is that the typical €5M brand wastes 6 to 8 hours per month on this alone.
The Master KPI Source-of-Truth Map
KPI Source-of-Truth Map
KPI
Primary Source
Secondary Sources
Reconciliation Note
CAC
Meta + Google Ads
Shopify orders, tooling, agency invoices
Use Shopify-attributed new customers, not platform-claimed
Blended MER
Shopify revenue
All ad platform spend totals
Roll all spend into one denominator
CPM
Meta, Google Ads
-
Trust platform native
New-Customer ROAS
Meta + Shopify
Tag first-time orders in Shopify
Reject blended ROAS for scaling decisions
CVR
Shopify
GA4
Shopify is source of truth; GA4 for traffic-source split
AOV
Shopify
-
Strip discounts and gift cards before calculating
Add-to-Cart Rate
Shopify + GA4
-
Watch for bot traffic inflating sessions
Checkout Abandonment
Shopify
-
Native checkout funnel report
CLV
Shopify cohorts
Klaviyo, 3PL returns
Subtract returns and discount-acquired cohorts
Repeat Purchase Rate
Shopify
-
90-day rolling window
90-Day Cohort Retention
Shopify
Klaviyo engagement
Build by acquisition month
Churn Rate
Recharge or subscription app
Shopify
Voluntary vs. involuntary split
OTIF
3PL
Shopify fulfillment status
Use 3PL system of record
Perfect Order Rate
3PL
CS ticket data
Net of damages and re-ships
Return Rate
Shopify + 3PL
Loop or Returnly
Watch SKU-level concentration
Fulfillment Cost / Order
3PL invoices
Shopify
Allocate inbound freight properly
Contribution Margin
All sources unified
Xero
Single biggest reconciliation pain point
Gross Margin
Shopify + COGS source
Xero
Update COGS quarterly minimum
The Cleanup Year Trap
Ari Tulla (ELO Health) spent over $10M building a proprietary algorithmic platform that LLMs rendered obsolete in months. The lesson generalizes. Most brands waste 9 to 12 months of "data cleanup" normalizing SKU names and attribution gaps before they can run a single clean analysis.
Q7. How Do You Calculate CAC, CLV, and Contribution Margin Correctly (With Worked Examples)? [toc=7. Calculate CAC, CLV, Margin]
CAC, CLV, and contribution margin are the three KPIs that decide whether your store survives. They are also the three most often miscalculated. Most stores understate true CAC by 20 to 30% and overstate CLV by 35 to 60%. The result is acquisition spend that looks profitable on paper and bleeds cash in reality.
True CAC = (paid ad spend + creator costs + agency fees + tooling) / new customers acquired, not just Meta CAC. True CLV = Σ(gross profit per order × repeat probability) discounted to present value, not AOV × frequency. Contribution margin = revenue − COGS − shipping − payment fees − ad spend per order.
Calculator 1: True CAC
The Formula
True CAC = (Meta spend + Google spend + creator and influencer costs + creative production + agency retainers + martech tooling) ÷ new customers acquired in the same period.
Worked Example (€5M Apparel Brand, October)
Meta spend: €78,000
Google spend: €22,000
Creators: €9,000
Creative production: €6,500
Agency retainer: €4,500
Tooling (Klaviyo, Triple Whale, etc.): €2,800
Total acquisition spend: €122,800
New customers acquired: 2,140
True CAC: €57.38
The Common Error
Founders divide Meta spend by Meta-attributed customers and call it CAC. That number, in this example, would read €36.45. ❌ The brand thinks it has €21 of margin it does not have.
Calculator 2: True CLV
The Formula
True CLV = Σ over 24 months of (gross profit per order × probability of that order occurring), discounted at 10% annually.
Worked Example (Same €5M Apparel Brand)
Gross profit per order: €34
Order 1 probability: 100% to €34.00
Order 2 probability (90-day): 22% to €7.48
Order 3 probability: 12% to €4.08
Order 4 probability: 7% to €2.38
24-month CLV: ~€48 per acquired customer
CAC of €57 against CLV of €48 means the brand loses €9 per acquired customer over 24 months.
The Contrarian Lever
Anthony Mink (Live Bearded) found through AI cohort analysis that customers buying across 3 or more product categories drove 100% larger LTV than those buying repeatedly in one category. Frequency is overrated. Category diversity is the real CLV lever.
Calculator 3: Contribution Margin
The Formula
Contribution margin per order = revenue − COGS − shipping − payment fees − ad spend allocated per order.
Worked Example
AOV: €92
COGS: €31
Shipping: €7
Payment fees (2.9%): €2.67
Ad spend per order (blended CAC across orders): €23
Contribution margin: €28.33 per order (30.8%)
The Common Error
💸 Most P&Ls bury ad spend in "marketing" instead of allocating it to the order. The "gross margin" number looks healthy at 66%. The contribution margin reveals the real picture at 31%.
Luca pulls all three calculators in real time across connected sources. Ask "what is my contribution margin by channel for October?" and Luca returns the answer with reasoning. Ask "what happens if I shift €20K from Meta to TikTok?" and Luca simulates the scenario. The math stops being a Sunday-night spreadsheet.
Q8. Why Do Fulfillment KPIs (OTIF, Perfect Order Rate, Returns) Quietly Decide Your Margin? [toc=8. Fulfillment KPIs Decide Margin]
When Allbirds went omnichannel, the team discovered something brutal. Warehouse-only fulfillment was causing stockouts on their best-selling SKUs across their 31 retail stores. Sales they could measure. Sales they could not recover. The fix was unifying inventory visibility across channels. The lesson is the same for every DTC operator I work with. Fulfillment KPIs are not ops vanity. They are margin levers. And they are systematically absent from every KPI article that ranks for this query.
Fulfillment KPIs are not ops vanity, they are margin levers. Perfect Order Rate (the percentage of orders delivered on-time, in-full, damage-free, and correctly documented) below 95% costs the average DTC brand 1.4 to 2.1% of contribution margin. Return rate above 12% in apparel triples reverse-logistics cost per order. Median (not mean) lead time is the right tracking metric. Outliers wreck CSAT and repeat rate. Retailers lose over $1 trillion annually to inventory distortion, roughly 6% of revenue for the average brand.
The Allbirds Lesson Applied to Your Store
You are not Allbirds. You do not have 31 retail locations. The same physics applies anyway. Every stockout on a best-seller is a measurable loss and an unmeasurable repeat-customer loss compounded over the next 90-day cohort window.
Fulfillment data lives in your 3PL system. Sales data lives in Shopify. Ad spend data lives in Meta. ❌ No dashboard joins them automatically.
The Pattern Across Brands
Gymshark scaled fast and ended up with £49M of locked inventory by 2022, with cash conversion stretched to 102 days according to their Companies House filing.
Allbirds fixed omnichannel stockouts by unifying inventory visibility across 31 stores.
r/shopify operators routinely surface 3PL accuracy issues compounding into 4 to 7% of margin lost per quarter.
"Our experience with Wayflyer has been extremely disappointing and professionally damaging. After being offered funding in writing with specific amounts, Wayflyer abruptly reversed their decision at the last minute. This caused significant disruption to our operations and cash flow." Geoff Brand Wayflyer Trustpilot Verified Review
The same fragmentation that kills analytics kills fulfillment visibility. Founders pay for a 3PL portal, a Shopify dashboard, and an analytics tool. None of them surface what fulfillment is doing to contribution margin in real time.
Median Beats Mean for Lead Times
⚠️ Track median fulfillment lead time, not mean. One catastrophic 14-day delay distorts mean lead time but does not distort median. Median tells you what your typical customer experiences.
Perfect Order Rate as the Composite KPI
Perfect Order Rate combines four sub-metrics into one number. ✅ On-time. In-full. Damage-free. Correct documentation. Below 95% means at least 1 in 20 customers gets a degraded experience that quietly compresses repeat rate over the following 90-day window.
Q9. Which KPIs Do Investors Demand vs. Which KPIs Run Your Week-to-Week Operations? [toc=9. Investor vs Operator KPIs]
A founder doing €8M ARR pinged me last month, two weeks before her Series A pitch. Her deck CAC said €34. Her Shopify-grounded CAC said €51. The VC noticed in due diligence. The deal closed at a 15% lower valuation than the term sheet she walked in with. The KPIs were not wrong. They were calculated from different source systems, on different attribution windows, with different exclusions. This is the gap nobody talks about. Investors and operators do not look at the same KPI stack. And founders who run one dashboard for both audiences get caught in it.
Investors weight blended CAC, CAC payback period, gross margin, contribution margin, net revenue retention (the percentage of last year's revenue retained and expanded from existing customers), and 12-month cohort LTV. Operators weight daily MER, creative-level CTR, inventory days-on-hand, perfect order rate, and weekly repeat rate. The two dashboards rarely overlap. Founders preparing for a raise often discover their operating KPIs do not reconcile to their pitch deck KPIs because they were calculated from different source systems.
The Decision Dilemma
Should you run one dashboard for everyone? It is tempting. It looks clean. It also breaks the moment a VC asks "how are you calculating that?"
❌ Most founders pick the friendlier number. Meta-attributed CAC for the deck. Shopify-attributed CAC for ops. The reconciliation gap shows up in due diligence.
The Right Framework: Two Dashboards, One Source
Investor-Grade KPIs (Quarterly)
Investor-Grade KPIs
KPI
Why Investors Want It
Blended CAC
Total acquisition cost across all channels
CAC Payback Period
Months until a customer earns back acquisition cost
Gross Margin
Pricing and supply-chain health
Contribution Margin
True scaling permission
Net Revenue Retention
Cohort compounding signal
12-Month Cohort LTV
Predictable revenue base
Operator-Grade KPIs (Weekly)
Operator-Grade KPIs
KPI
Why Operators Need It
Daily Blended MER
Real-time spend efficiency
Creative-Level CTR
Fatigue trigger
Inventory Days-on-Hand
Stockout prevention
Perfect Order Rate
Fulfillment margin leak
Weekly Repeat Rate
Retention pulse
New-Customer ROAS by Channel
Scale-or-cut decision
Where Reconciliation Breaks
⚠️ The two dashboards can use the same underlying data. They almost never do. A founder pulls deck CAC from a quarterly Xero export. They pull operator CAC from Triple Whale's Meta-attributed view.
"Our experience with Triple Whale has been extremely frustrating. The integrations are inconsistent, and we end up reverting back to direct data sources like Meta, Shopify, and Recharge." Matt Huttner Triple Whale Trustpilot Verified Review
The Architecture That Solves It
✅ One source-of-truth data layer. Two extraction views on top. The investor view rolls up monthly. The operator view rolls up daily.
We built Luca to handle exactly this split. Luca pulls all source data into one analytics layer. Operators get weekly digests pushed to Slack. Founders auto-generate monthly board packs from the same underlying data. Same numbers. Two audiences. Zero reconciliation drama in your next raise.
Q10. Triple Whale, GA4, Polar, and Lifetimely vs. an AI Analytics Layer, Which KPI Stack Wins? [toc=10. AI Analytics Layer Comparison]
You are evaluating analytics tools because the spreadsheet broke. You looked at Triple Whale, Polar, Lifetimely, and stuck with GA4 for free. Each one solves a slice of the analytics problem. None of them give you the full picture in one place. The comparison below is not feature-by-feature. It is architecture-by-architecture.
Dashboards display, an AI analytics layer reasons. Triple Whale shows blended ROAS but cannot run root-cause attribution across creative, audience, and cohort simultaneously. GA4 shows attribution but cannot simulate "what if I shift €20K from Meta to TikTok." Lifetimely shows LTV but cannot push a customized weekly cohort report to Slack at 8am Monday. The architectural choice is between renting six dashboards or operating one AI layer that extracts, predicts, simulates, and reports.
Triple Whale: Marketing-First, Limited Beyond
✅ Strong on Meta and Google attribution dashboards for single-channel operators.
❌ Weak on cross-functional reasoning, and the AI assistant Moby has persistent reliability issues per user reports. See Triple Whale alternatives for context.
"Building with the AI tool Moby is very buggy and crashes more than half the time. Support is largely unresponsive and not helpful." Matt Huttner Triple Whale Trustpilot Verified Review
❌ Data sampling distorts results, and the GA4 migration broke workflows for mid-market operators.
"Sampling, sampling, sampling. For a data and algorithm based company, Google does a terrible job of estimating reality. Google Analytics was telling us we had twice as much traffic as we actually do." Gitai B. Google Analytics G2 Verified Review
Polar Analytics: Cleaner Dashboards, Same Architecture
✅ Better UX than Triple Whale for operators who want cleaner visualizations.
❌ Still a dashboard, not a reasoning engine. No native simulation or agentic reporting.
Lifetimely: Cohort LTV Only
✅ Strong for retention-focused brands tracking LTV by acquisition cohort.
❌ Single-purpose. No cross-functional view and no proactive anomaly detection.
Luca: AI Layer Over a Unified Warehouse
✅ Plain-English queries across Shopify, Meta, Klaviyo, Xero, and 3PL data simultaneously.
✅ Customized weekly digests pushed to Slack and email automatically.
The Side-by-Side Comparison
Analytics Stack Side-by-Side
Dimension
Luca
Triple Whale
GA4
Polar
Lifetimely
Plain-English queries
✅
Partial
❌
❌
❌
Cross-functional data
✅
Marketing only
Web only
Marketing
Retention only
Root-cause attribution
✅
❌
❌
❌
❌
Scenario simulation
✅
❌
❌
❌
❌
Agentic Slack/email reports
✅
❌
❌
❌
❌
Anomaly detection 24/7
✅
Partial
❌
Partial
❌
Customizable dashboards
✅
✅
✅
✅
Limited
Who Should Choose What
Choose Triple Whale or Polar if you only need a marketing attribution dashboard and have a data team handling the rest. Choose Lifetimely if your only analytics need is cohort LTV and you have separate tools for everything else. Choose GA4 if you have zero budget and accept the sampling tradeoff. Choose Luca if you want one analytics layer that extracts, reasons, simulates, and reports across your full data stack without an analyst or SQL dependency.
After using Triple Whale and spreadsheets for two years, I found critical gaps in cross-functional visibility. Most tools show marketing or finance. Never both together. That is the reason we built Luca.
Q11. How Do You Audit Your Current KPI Stack in 15 Minutes? [toc=11. 15-Minute KPI Audit]
We started this article with the Monday Shudder. The 11pm CSV exports. The 31-tab spreadsheet. Six tabs open. Three numbers for the same week. The audit below tells you exactly where your stack sits today. Seven questions. Fifteen minutes. No fluff.
Score yourself on seven questions: Can you answer "true contribution margin by channel" in under 60 seconds? Does your system surface anomalies automatically? Can you simulate "scale Meta 30%, what happens to August margin?" Are marketing, finance, and operations in one analytics view? Do you receive customized weekly KPI digests in Slack or email without manual effort? Six-plus yeses means optimize. Three to five means critical gaps. Below three means fragmentation is actively costing you revenue every week.
The 7-Question KPI Stack Audit
⏰ Score one point per yes. Be honest.
☐ Can I answer "true contribution margin by channel" in under 60 seconds?
☐ Does my system surface anomalies (CAC spike, ROAS dip, inventory drop) automatically?
☐ Can I simulate "scale Meta 30%, what happens to August margin?" in plain English?
☐ Are marketing, finance, and operations data in one analytics view?
☐ Do I receive customized weekly KPI digests in Slack or email without manual effort?
☐ Can I run root-cause attribution across creative, audience, and cohort in one query?
☐ Can my team get answers without SQL or analyst dependency?
Score Interpretation
KPI Audit Score Interpretation
Score
What It Means
6 to 7
⭐ Stack is mature, focus on optimization
3 to 5
⚠️ Critical gaps, fragmentation is hurting decisions
✅ Agentic weekly digests pushed to Slack and email on a schedule you define
If you scored below 5, the stack is the problem, not your team. Book a 15-minute gap assessment and we will show you which unchecked boxes get checked first.
What I'm Thinking About Next [toc=12. What Comes Next]
The shift from reporting to reasoning is the obvious 18-month story. The one I am sitting with is what comes after. By 2027, the question will not be "do I have an AI analytics layer?" It will be "is my AI layer running tasks autonomously, or am I still asking it questions?" Agentic analytics that monitor goals, surface blockers, and recommend fixes without prompts is where the operator advantage moves next. I could be off on this. My read right now is that the brands compounding fastest in 2027 are the ones treating analytics as a 24/7 colleague, not a 9-to-5 dashboard. If you are testing this on your store, ping me. I want to know what is breaking.
FAQ's
What are the most important ecommerce KPIs every scaling DTC brand should track in 2026?
We track 18 KPIs across five workflows, because anything more becomes noise and anything less leaves margin on the table.
Fulfillment: OTIF, perfect order rate, return rate, fulfillment cost per order
Margin: contribution margin, gross margin
Each KPI maps to a specific data source and a decision trigger, not just a number to report. The mistake most operators make is tracking 30 metrics across 12 tools, then still spending 10 to 15 hours weekly stitching CSVs to answer one question. We pull all 18 into one place inside Luca, so contribution margin by channel is a one-question chat away, not a Sunday spreadsheet.
How do we calculate true CAC, true CLV, and contribution margin correctly?
Most stores understate true CAC by 20 to 30% and overstate CLV by 35 to 60%. Here is the corrected math:
True CAC = (paid ad spend + creator costs + agency fees + tooling) divided by new customers acquired, not Meta CAC alone.
True CLV = the sum of (gross profit per order multiplied by repeat probability) over 24 months, discounted to present value, not AOV multiplied by frequency.
Contribution Margin = revenue minus COGS minus shipping minus payment fees minus ad spend allocated per order.
For a €5M apparel brand, true CAC often lands at €57 against a CLV of €48, meaning the brand quietly loses €9 per acquired customer over 24 months. We run all three calculators live across connected sources inside Luca's unit economics layer, so the math stops being a Sunday-night spreadsheet.
Which KPIs actually matter at €1M, €5M, and €20M+ revenue stages?
Tracking 18 KPIs at every stage means tracking nothing. The right stack shifts as the business scales.
€5M, Efficiency math: 90-day repeat rate by first SKU, cohort LTV vs CAC, blended MER stability, email and SMS attributed revenue, contribution margin by channel.
€20M+, Capital-efficiency math: contribution margin per channel per cohort, cohort LTV by first SKU, inventory cash-conversion cycle, net revenue retention, fulfillment cost per order.
Optimizing the wrong metric at the wrong stage is the most common reason scaling brands stall. Inside Luca's financial layer, we detect your revenue band from connected Shopify data and surface only the KPI subset relevant at your scale.
How is an AI analytics layer different from Triple Whale, GA4, Polar, or Lifetimely?
Dashboards display, an AI analytics layer reasons.
Triple Whale: shows blended ROAS but cannot run root-cause attribution across creative, audience, and cohort simultaneously.
GA4: shows attribution but cannot simulate "what if I shift €20K from Meta to TikTok."
Polar: cleaner dashboards, still no native scenario simulation or agentic reporting.
Lifetimely: strong on cohort LTV, but single-purpose with no cross-functional view.
An AI analytics layer extracts the relevant slice on demand, predicts outcomes, simulates scenarios, runs root-cause attribution, and pushes customized weekly digests to Slack and email automatically. The architectural choice is between renting six dashboards or operating one reasoning engine. We unpack the full head-to-head in our Triple Whale alternatives breakdown.
How do we audit our current KPI stack in 15 minutes?
Score yourself honestly on these seven questions. One point per yes:
Can I answer "true contribution margin by channel" in under 60 seconds?
Does my system surface anomalies (CAC spike, ROAS dip, inventory drop) automatically?
Can I simulate "scale Meta 30%, what happens to August margin?" in plain English?
Are marketing, finance, and operations data in one analytics view?
Do I receive customized weekly KPI digests in Slack or email without manual effort?
Can I run root-cause attribution across creative, audience, and cohort in one query?
Can my team get answers without SQL or analyst dependency?
Six-plus yeses means optimize. Three to five means critical gaps. Below three means fragmentation is actively costing revenue every week. If you scored under five, the stack is the problem, not your team. Book a 15-minute gap assessment with Luca and we will show you which unchecked boxes get checked first.
Enjoyed the read? Join our team for a quick 15-minute chat — no pitch, just a real conversation on how we’re rethinking Ecommerce with AI - Luca
Loading Schedule...
Your AI Co-Founder is here.
Here’s why:
Shopify, Meta, Xero - one brain.
"Should I scale?" Answered with real data.
Growth capital. No applications. One click.
Thank you! Your submission has been received! Please book a time slot for the Meeting
Oops! Something went wrong while submitting the form.