
Q1. What are the 10 best predictive analytics tools for ecommerce in 2026 (and how we scored them)? [toc=1. Best Tools & Scoring]
The 10 best predictive analytics tools for ecommerce in 2026 are Luca AI, Klaviyo, Triple Whale, Saras Pulse, Google Analytics 4, Glew, Peel Insights, Adobe Analytics, BigQuery ML, and DataRobot. I scored each on Cross-Functional Intelligence (25%), Prediction Accuracy and Data Readiness (25%), Setup and Usability (20%), Pricing Transparency (15%), and User Reviews (15%). Luca leads because it reasons across marketing, finance, and operations, not inside one silo.
I have watched too many operators buy a "predictive" tool that turned out to be a trendline with a chart on top. A real predictive tool forecasts churn, customer lifetime value, demand, and next-order timing from your history, then tells you the move. So I did not rank on marketing polish. I ranked on whether the tool actually predicts the jobs that decide what you stock, who you keep, and where you spend next month. If you want the deeper logic, our guide to predictive analytics for ecommerce breaks it down further.
Here is the shortlist, each with what it is best at.
- Luca AI, best for cross-functional prediction across marketing, finance, and ops
- Klaviyo, best for predictive CLV, churn risk, and next-order-date on retention flows
- Triple Whale, best for marketing-side forecasting and DTC dashboards
- Saras Pulse, best for cohort LTV and retention forecasting
- Google Analytics 4, best free baseline for purchase-probability prediction
- Glew, best for SKU and product-level predictive reporting
- Peel Insights, best for automated cohort and retention analytics
- Adobe Analytics, best for enterprise web behavior prediction
- BigQuery ML, best for teams building custom models in-warehouse
- DataRobot, best for AutoML and dedicated data-science teams
📊 Quick comparison of all 10 tools
Note on ratings: stars reflect the weighted rubric explained under Q2. Pricing for non-Luca tools is shown as a public range, so confirm current quotes with each vendor before you commit spend.
1.1 Luca AI ⭐⭐⭐⭐⭐ [toc=1.1 Luca AI]
💡 Why did we choose this tool?
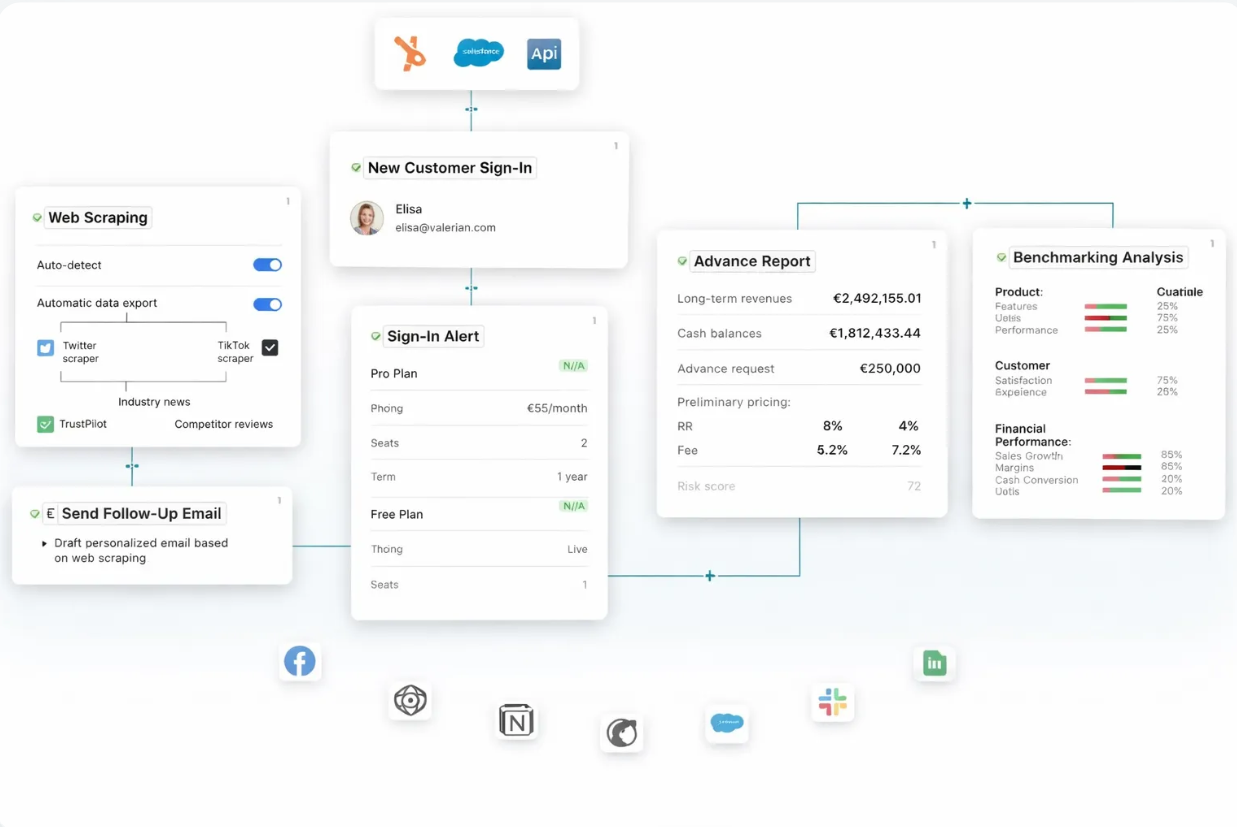
I put Luca first because it is the one tool here that predicts across silos, not inside one. Most tools forecast marketing, or retention, or web behavior. Luca is an AI layer over your data warehouse. It pulls the relevant data for a question, predicts from your history, simulates scenarios, and finds the root cause behind an outlier. You ask in plain English, no SQL and no analyst. As the founder writing this, I am biased, but the ranking reason is architectural, it reasons horizontally where others stay vertical. That is the same thinking behind our approach to ecommerce business intelligence.
🛠️ Solutions offered
- Predicts churn, LTV, and demand across marketing, finance, and operations data in one place.
- Answers plain-English questions and returns reasoning, not just a chart.
- Simulates scenarios (price changes, spend shifts) and models the downstream effect.
- Runs root-cause analysis to find the influencing components behind a metric move.
- Pushes scheduled, customized reports to Slack and email, and alerts on outliers 24/7.
📈 Core evaluation metrics
- Cross-functional scope: marketing, finance, ops, and web in one model.
- Prediction jobs: churn, predictive LTV, demand, next-order, root-cause.
- Data readiness: normalizes and standardizes data on ingestion.
- Interface: conversational, no SQL or dashboard-building required.
- Alerting: 24/7 outlier detection to Slack, email, and app.
😊 Best for
- Scaling DTC and mid-market brands doing roughly $1M to $50M who lack a data team.
- Operators running multi-source stacks (Shopify, Meta, Google, Klaviyo, accounting).
- Founders who want predictions that reason across marketing and finance, not one silo. See our use cases for examples.
⚠️ When Luca is not the right fit
I would not push Luca on a sub-$10K MRR store with thin history, a pure B2B seller, or a marketplace-only operation. Predictions need enough order history to be reliable, and below that stage descriptive analytics plus clean ecommerce data integration matter more.
📋 Case study
😩 What was the problem? A skincare DTC brand on Shopify doing roughly €350K/month believed its hero product carried a 72% margin. The founder spent eight hours a week stitching exports from Shopify, Meta, and Xero, and still could not see true profit by product.
🔧 How Luca helped? Luca normalized the data on ingestion, then ran a line-by-line contribution-margin breakdown across freight, storage, fulfillment, and returns. It surfaced the influencing cost components the blended average was hiding and flagged which SKUs were quietly loss-making. The difference between the two is covered in our note on contribution margin vs gross margin.
📈 What was the outcome? The hero product's real contribution margin came in near 8%, not 72%. The founder repriced, cut two SKUs, and reallocated spend, recovering margin within a quarter, with weekly reports now landing in Slack automatically.
💰 Pricing
[ Starter, €299 / Month | Growth, €499 / Month | Scale, Custom Pricing ]
1.2 Klaviyo ⭐⭐⭐⭐ [toc=1.2 Klaviyo]
💡 Why did we choose this tool?
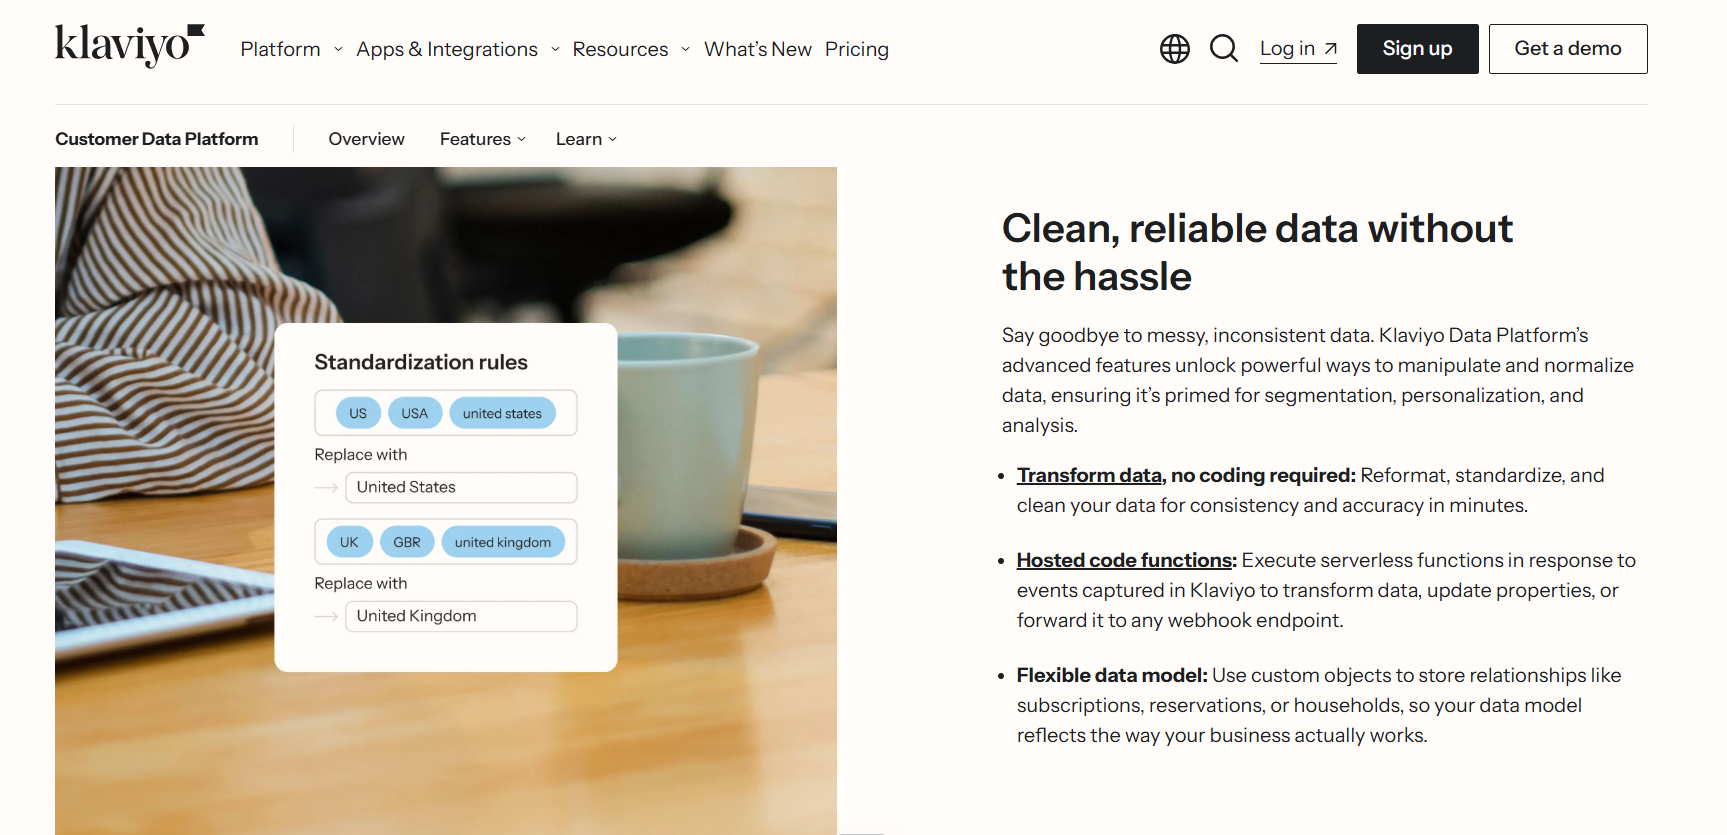
Klaviyo earns its spot because its predictive analytics are genuinely usable, not decorative. Its machine learning estimates each contact's predicted customer lifetime value, churn risk, and expected date of next order, then lets you trigger flows and segments off those predictions. For a Shopify brand running email and SMS, that means you can nudge a high-churn-risk customer before they lapse, without hiring anyone. The catch is scope, Klaviyo predicts inside the retention and messaging layer, not across your finance or inventory data. If retention is your focus, our guide to Shopify LTV pairs well with it.
🛠️ Solutions offered
- Predicted CLV: forecasts how much a contact will spend in the next 365 days.
- Churn-risk scoring on individual customer behavior and cohort patterns.
- Expected date of next order to time flows and win-back campaigns.
- Predictive Insights Panel showing CLV, orders, and churn risk in the helpdesk.
- Segments and flows that fire directly off predictive fields.
📈 Core evaluation metrics
- Cross-functional scope: retention and messaging only, not finance or ops.
- Prediction jobs: predicted CLV, churn risk, next-order date.
- Data readiness: needs enough repeat-purchase history to model reliably.
- Interface: no-code segments and flows, marketer-friendly.
- Alerting: prediction-triggered flows rather than proactive anomaly alerts.
😊 Best for
- Shopify DTC brands running email and SMS as a core retention channel.
- Operators who want predictions wired directly into automated flows.
- Teams without a data scientist who need marketer-usable predictive fields. Compare options in our ecommerce analytics platforms roundup.
💬 Reviews
I could not find verified Klaviyo predictive-analytics reviews in our review file, and per our sourcing rules I will not manufacture quotes. Klaviyo's own documentation confirms the predicted CLV, churn-risk, and next-order-date models cited above.
1.3 Triple Whale ⭐⭐⭐⭐ [toc=1.3 Triple Whale]
💡 Why did we choose this tool?
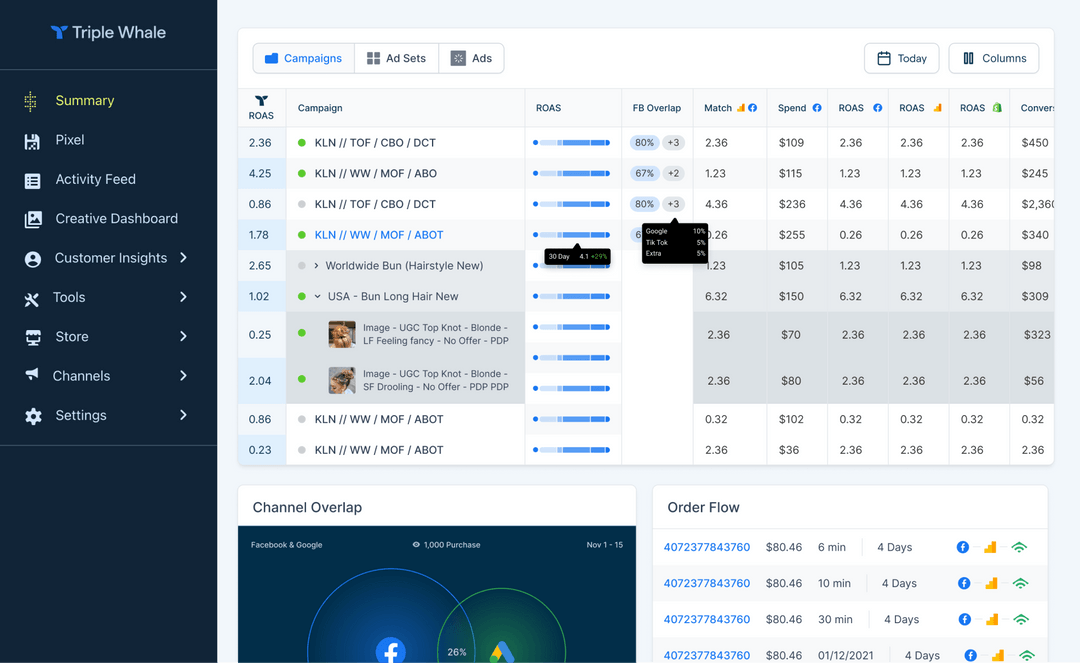
Triple Whale earns its place because it is the DTC operator's daily marketing cockpit. It unifies Shopify, ad platforms, and CRM data, gives you a clear daily profit view, and layers forecasting on top of attribution. If your main question is "which ad is actually driving revenue," Triple Whale answers it fast. The limit worth naming upfront, it sees marketing well and finance poorly, so predictions live inside the ad-spend silo, not across your cash position. We list other options in our Triple Whale alternatives guide.
🛠️ Solutions offered
- Multi-touch marketing attribution across Meta, Google, and other channels.
- Daily profit and ROAS dashboards pulling from Shopify and ad platforms.
- Marketing-side forecasting and creative performance analysis.
- Custom metric tables you can tailor per channel.
- CRM and ad data connection for conversion tracking.
📈 Core evaluation metrics
- Cross-functional scope: marketing-heavy, thin on finance and ops.
- Prediction jobs: ad-spend forecasting, ROAS trends, attribution.
- Data readiness: fast Shopify and ad-platform connection.
- Interface: user-friendly, marketer-oriented.
- Alerting: dashboard monitoring rather than proactive cross-functional alerts.
😊 Best for
- DTC brands running heavy paid media across Meta and Google.
- Growth teams wanting fast, top-down marketing reporting.
- Operators who need clearer attribution than GA4 offers.
💬 Reviews
"I love how seamlessly it connects our ad platforms and CRM data, showing exactly where our conversions come from and which campaigns drive the most revenue. Its made attribution so much clearer."
Verified User Triple Whale G2 Verified Review
"Extremely disappointing customer service, the worst i have seen in years. The attribution system is consistently buggy and unreliable, causing more harm than good. Not worth the investment if you value accurate data and dependable support, I strongly recommend avoiding this platform."
Verified User Triple Whale G2 Verified Review
1.4 Saras Pulse ⭐⭐⭐⭐ [toc=1.4 Saras Pulse]
💡 Why did we choose this tool?
Saras Pulse belongs here for cohort LTV and retention forecasting. It unifies ecommerce data and builds predictive customer-lifetime-value and churn views at the cohort level, which is exactly what retention-led brands need. It reads as a solid data-intelligence layer for brands that live and die by repeat purchase. The trade-off, pricing is quote-based, so you cannot self-serve a price the way you can with GA4 or Klaviyo. For the underlying metric, see our guide to ecommerce customer lifetime value.
🛠️ Solutions offered
- Cohort-level LTV forecasting across customer segments.
- Retention and churn prediction from unified ecommerce data.
- Unified dashboards blending marketing and commerce metrics.
- Automated reporting for repeat-purchase brands.
- Custom metric configuration by cohort.
📈 Core evaluation metrics
- Cross-functional scope: strong on customer and retention analytics.
- Prediction jobs: cohort LTV, churn, retention forecasting.
- Data readiness: unified ingestion across ecommerce sources.
- Interface: dashboard-led, analyst-friendly.
- Alerting: reporting-focused.
😊 Best for
- Retention-led DTC brands with meaningful repeat-purchase history.
- Mid-market operators focused on cohort economics.
- Teams wanting LTV forecasting without building it in-warehouse.
1.5 Google Analytics 4 ⭐⭐⭐ [toc=1.5 Google Analytics 4]
💡 Why did we choose this tool?
GA4 makes the list as the free predictive baseline nearly every store already has. Its predictive metrics like purchase probability and churn probability let you build audiences off likely behavior at zero cost. It is a fine starting point. The honest catch is reliability and usability, operators repeatedly flag sampling, data-trust issues, and a steep learning curve, so treat GA4 as one reference point, not your single source of truth. Our walkthrough on Google Analytics for ecommerce covers the setup.
🛠️ Solutions offered
- Purchase-probability and churn-probability predictive metrics.
- Predictive audiences for Google Ads targeting.
- Traffic-source, engagement, and conversion tracking.
- Integration with Google Ads and Search Console.
- Free tier with BigQuery export for deeper analysis.
📈 Core evaluation metrics
- Cross-functional scope: web behavior only.
- Prediction jobs: purchase probability, churn probability.
- Data readiness: easy GTM setup, but sampling concerns.
- Interface: powerful but confusing, especially GA4.
- Alerting: basic anomaly detection.
😊 Best for
- Early-stage stores wanting a free predictive baseline.
- Teams already invested in the Google Ads ecosystem.
- Operators who pair GA4 with a more trustworthy source.
💬 Reviews
"If you are a small business, this will provide you enough information that you will be able to directionally understand traffic on your site."
Gitai B., Marketing, Web Analytics, and Testing Lead Google Analytics G2 Verified Review
"The downside of GA is its learning curve, especially with GA4. The interface and reporting structure are not very intuitive at first, and finding specific metrics or building custom reports can take time."
Aman S., Performance Marketing Head Google Analytics G2 Verified Review
1.6 Glew ⭐⭐⭐ [toc=1.6 Glew]
💡 Why did we choose this tool?
Glew is here for SKU and product-level predictive reporting. It pulls your data into one place, segments customers by purchase frequency and lifetime value, and gives Shopify brands deeper product analytics than native Shopify offers. It is genuinely useful at the product level. The recurring complaint worth flagging is data accuracy, so verify the numbers before you make a big buy decision on them. For related tooling, see our best Shopify analytics apps list.
🛠️ Solutions offered
- SKU and product-level sales analytics.
- Customer segmentation by frequency, product, and LTV.
- Channel and campaign revenue attribution.
- Looker-based customizable dashboards.
- Data export for further manipulation.
📈 Core evaluation metrics
- Cross-functional scope: product and customer analytics.
- Prediction jobs: LTV segmentation, product-level trends.
- Data readiness: multi-source, but accuracy needs checking.
- Interface: Looker dashboards, flexible.
- Alerting: reporting-focused.
😊 Best for
- Shopify brands needing SKU-level insight beyond native reports.
- Operators segmenting customers by lifetime value.
- Teams comfortable validating data before acting.
💬 Reviews
"Glew helps us acheive accurate channel revenue attribution. Not only can we view by channel, but even by campaign. This helps us see what channel/campaign is working and put our dollars in the right place."
Verified User Glew G2 Verified Review
"Data was often not accurate and adding new data sources was hard. The visualization was also subpar."
Verified User Glew G2 Verified Review
1.7 Peel Insights ⭐⭐⭐⭐ [toc=1.7 Peel Insights]
💡 Why did we choose this tool?
Peel Insights makes the cut for automated cohort and retention analytics. It surfaces cohort behavior, retention curves, and LTV metrics without you building the analysis by hand, which suits repeat-purchase DTC brands. Think of it as automated cohort vigilance. The limit, it is focused on customer analytics, so it is not the tool for cross-functional finance or demand forecasting. Our primer on ecommerce customer segmentation explains the cohort logic.
🛠️ Solutions offered
- Automated cohort analysis and retention curves.
- Predictive LTV and repeat-purchase metrics.
- Pre-built ecommerce metric library.
- Shopify-native data connection.
- Trend and anomaly surfacing on customer behavior.
📈 Core evaluation metrics
- Cross-functional scope: customer and retention analytics.
- Prediction jobs: cohort LTV, retention forecasting.
- Data readiness: quick Shopify connection.
- Interface: automated, low-setup.
- Alerting: metric-trend surfacing.
😊 Best for
- DTC brands focused on retention and repeat purchase.
- Operators wanting cohort analysis without manual work.
- Teams that need customer analytics, not full BI.
1.8 Adobe Analytics ⭐⭐⭐ [toc=1.8 Adobe Analytics]
💡 Why did we choose this tool?
Adobe Analytics is the enterprise entry for web behavior prediction. It brings predictive modeling, anomaly detection, and attribution AI at a depth that large retailers need. If you have an analytics team and enterprise budget, it delivers. For a scaling DTC brand, the honest read is that it is heavy, expensive, and more than most sub-$50M operators can justify. Most growing brands are better served by lighter ecommerce website analytics.
🛠️ Solutions offered
- Predictive web behavior and propensity modeling.
- Anomaly detection and contribution analysis.
- Attribution AI across touchpoints.
- Advanced segmentation and analysis workspace.
- Enterprise integrations across the Adobe stack.
📈 Core evaluation metrics
- Cross-functional scope: deep web and marketing analytics.
- Prediction jobs: propensity, anomaly detection, attribution.
- Data readiness: heavy implementation.
- Interface: powerful, steep learning curve.
- Alerting: strong anomaly detection.
😊 Best for
- Enterprise retailers with dedicated analytics teams.
- Brands already inside the Adobe Experience Cloud.
- Operators needing deep web-behavior prediction at scale.
1.9 BigQuery ML ⭐⭐⭐ [toc=1.9 BigQuery ML]
💡 Why did we choose this tool?
BigQuery ML is for teams that want to build their own models in the warehouse using SQL. You can train regression, classification, and forecasting models directly on your data without moving it. It is powerful and flexible. The reality check, this is the build path, and it only makes sense if you have the data skills, since pricing is usage-based and can climb with query volume. It fits best inside a mature e-commerce tech stack.
🛠️ Solutions offered
- In-warehouse ML model training via SQL.
- Forecasting, regression, and classification models.
- Direct access to raw first-party data.
- Integration with the wider Google Cloud stack.
- Custom churn, LTV, and demand models.
📈 Core evaluation metrics
- Cross-functional scope: whatever you model, but DIY.
- Prediction jobs: custom churn, LTV, demand forecasting.
- Data readiness: requires clean warehouse data.
- Interface: SQL, needs technical skill.
- Alerting: none native, you build it.
😊 Best for
- Teams with data engineers and clean warehouse data.
- Brands wanting full control over model logic.
- Operators comfortable with usage-based cloud pricing.
1.10 DataRobot ⭐⭐⭐ [toc=1.10 DataRobot]
💡 Why did we choose this tool?
DataRobot rounds out the list as the AutoML platform for dedicated data-science teams. It automates model building, deployment, and monitoring across use cases, ecommerce included. It is enterprise-grade and capable. But it is the least ecommerce-native option here, and pricing sits in high five figures and up, so it fits organizations with data teams, not lean DTC brands. Most operators get more from focused ecommerce data analytics.
🛠️ Solutions offered
- Automated machine learning (AutoML) model building.
- Model deployment and lifecycle monitoring.
- Custom churn, LTV, and demand prediction.
- Explainability and accuracy tracking.
- Enterprise governance and integrations.
📈 Core evaluation metrics
- Cross-functional scope: general-purpose, not ecommerce-specific.
- Prediction jobs: any custom model you configure.
- Data readiness: needs structured data and expertise.
- Interface: technical, built for data scientists.
- Alerting: model-monitoring alerts.
😊 Best for
- Enterprises with in-house data-science teams.
- Organizations running many predictive use cases at once.
- Brands needing governed, deployed models at scale.
Q2. What is predictive analytics for ecommerce, and how is it different from your current dashboards? [toc=2. What It Is]
Predictive analytics for ecommerce uses your historical order, customer, and marketing data with machine learning to forecast future outcomes: who will churn, what a customer is worth over their lifetime, how much to stock, and when they buy next. Descriptive dashboards report what already happened. Prescriptive tools go one step further and recommend the move. The 2026 shift is from monitoring to recommending.
🧠 The three layers, in plain English
Descriptive analytics is the rear-view mirror. It shows last week's revenue, your current ROAS (return on ad spend, revenue divided by ad cost), and yesterday's orders. This is the layer most of a standard Shopify analytics dashboard lives in.
Predictive analytics is the windshield. It uses patterns in your data to forecast churn risk, customer lifetime value, and next-order timing before they happen. Prescriptive analytics is the co-pilot telling you to turn.
🧵 What this looks like on a denim buy
Say you sell denim and need to place next season's order. Each style means stocking sizes 23 to 32 across two stores, roughly a $6,000 commitment per style.
A descriptive dashboard tells you what sold last season. A predictive model forecasts demand by size and style, so you stop guessing on a $6,000 bet. That is the difference between reporting history and shaping the next decision, and it is central to smart ecommerce inventory management.
🚦 From monitoring to recommending
Here is my read after sitting with a lot of operators: dashboards became entertainment. As one operator put it, "watch Netflix, don't watch dashboards," because humans are bad at digesting raw logs and traces.
The real move is prescriptive. The industry is shifting from "show me the metric" to "tell me to go right instead of left." That is where the money is, because a recommendation changes what you do on Monday, and a chart usually does not.
This is exactly the edge Luca is built for. We are an AI layer over your data warehouse that reasons across marketing, finance, and operations, then tells you the move, not just draws the map, which is how we think about predictive analytics for ecommerce.
Q3. Which predictive analytics tool is right for your stage, stack, and data readiness? [toc=3. Choosing Your Fit]
Match the tool to your data first. Churn models need roughly 12+ months of lifecycle data and a few hundred churn events. Lifetime-value forecasting needs about a year of revenue and 1,000+ transactions. Shopify-plus-Klaviyo brands without a data team start with Klaviyo or a cross-functional layer. Enterprises with analysts justify BigQuery ML or DataRobot. Then check total cost, because connector fees and per-seat pricing add up fast.
🕳️ The trap nobody warns you about
Most roundups skip the one question that decides everything: do you even have enough data to predict? Buy a predictive tool with thin history, and you get confident nonsense.
The numbers matter. Train a demand model on a single season, and accuracy can collapse, dropping from the high 70s to barely better than a coin flip. If your history is thin, start with descriptive analytics and clean ecommerce data integration first.
📋 A quick data-readiness scorecard
Before you pay for any predictive tool, check these thresholds.
One tactical tip I stand by: compute "average" lead times on the median, not the mean. That strips out one late supplier from poisoning your whole forecast.
🎯 What to pick by stage
Here is my honest read, and I could be off for edge cases.
- Early Shopify store, no data team: start with Klaviyo predictive fields or GA4's free baseline.
- Scaling DTC blending marketing and finance: use a cross-functional layer that reasons across silos.
- Mid-market with real repeat purchase: cohort tools like Saras Pulse or Peel Insights.
- Enterprise with analysts: BigQuery ML or DataRobot to build your own.
💸 The cost that hides in the footnotes
Sticker price is not the real price. Connector maintenance can add hundreds a month, warehouse query fees run around $0.12/GB, and per-seat tools balloon as your team grows. For a sub-$5M brand, that hidden stack often costs more than the tool, which is why we track true ecommerce profit margins closely.
This readiness problem is why we built Luca to normalize and standardize data on ingestion. You skip the data-cleanup year, which hits multi-brand operators hardest when things like retail-week calendars are non-standard across brands. Plug in, ask, act, backed by solid ecommerce data management.
Q4. Why do most predictive tools leave you profitable on paper but broke in reality? [toc=4. Prediction vs Cash]
Most tools forecast revenue, churn, or ROAS but never see the eight costs between the supplier invoice and actual profit. Gross margin only tells you what it costs to make the thing, not to sell it. So a tool can predict a "winning" campaign that quietly burns cash. Predict on SKU-level contribution margin (revenue minus all variable costs to make and sell one unit) and the inventory-cash relationship instead of blended averages.
🪞 The comfortable lie most tools tell
The standard read says predictive analytics means forecasting revenue and ROAS. That feels right, and it is exactly why operators get burned.
A revenue forecast can look great while the underlying product loses money on every order. The prediction was accurate. The business still bled.
😢 The invoice that made a founder cry
I sat with a founder who believed her hero product ran a 72% margin. Then we broke the invoice down line by line.
Freight, storage, fulfillment, and returns turned that 72% into an 8% contribution margin. The dashboard never lied about revenue. It just never saw the eight costs where the money actually leaks. The gap between the two is covered in our note on contribution margin vs gross margin.
🚂 Gross margin is a lie, and so is your blended average
Here is the position the category avoids: gross margin tells you nothing about what it costs to sell the thing. Your blended average is lying to you too, because it smooths over the SKUs quietly draining cash.
Think of it as two train tracks. One rail is inventory, the other is cash, and they have to run in parallel, or you go off the rails. A prediction that ignores the cash track is just a nicer-looking crash. This is why declining platform ROAS often hides a true profitability problem.
📈 What predictions actually return, when you act
Predictions only pay when you act on them. The ROI is real, but so is the discipline it demands.
Even creative testing is prediction in disguise, roughly 90% of ad creative gets near-zero spend from the algorithm, so testing is how you find the 10% worth funding.
💬 Reviews
"Its very easy to use and works good for a multichannel solution."
Verified User Triple Whale G2 Verified Review
"The dashboard part, for some reason the data is not correct, its as if the dont take into account returns or something, on the dashboard I get overestimated sales and ROAS."
Verified User Triple Whale G2 Verified Review
This is the gap we built Luca to close. We predict against SKU-level contribution margin and cash position, finding the influencing cost components other tools average away, the core of real ecommerce business intelligence. One operator with a new customer in South Africa told me he now knows his bottom-line net profit in five minutes, work that used to take an expert two days.
Q5. Should predictive analytics live in built-in SaaS AI, a DIY model, or a dedicated layer? [toc=5. Build, Buy, or Bundle]
Built-in AI forecasting inside inventory or platform SaaS is tempting, but often unreliable. Operators report native tools hallucinating and getting switched off within weeks. Building your own with XGBoost or Prophet (open-source forecasting models) works only with a data team and clean pipelines. For most scaling brands, a dedicated layer that reasons across the full stack beats a bolt-on feature. The test: does it reason across silos, or just chart its own data?
💸 Why built-in AI looks so appealing
The pitch is easy to like. Your inventory tool already has your data, so its native AI forecast feels free and zero-setup.
Treat this as a cash decision, not a technical one. Free-feeling features still cost you if the forecast is wrong and you overbuy stock, so tight ecommerce inventory management still matters.
⚠️ Where native AI and DIY both break
Here is the lived reality. One operator told me their platform's native inventory AI "was rubbish," so they switched it off after it kept "hallucinating and telling fibs."
The DIY path breaks somewhere else: cash and headcount. You can vibe-code quick LTV summaries against Shopify APIs, but you still need a data team to maintain pipelines and ecommerce API integrations. And never let the AI be its own QA, one brand published a $20,000 bike with a misplaced derailleur because nobody checked.
🧭 The one test that settles it
Run every option through a single question. Does it reason across your silos, or just chart the data it already holds?
Legacy BI struggles here too, PowerBI has fallen behind on how AI-ready it is. This is where Luca fits: it is a dedicated layer over your data warehouse that reasons horizontally across marketing, finance, and ops, then pushes scheduled reports to Slack and email, the core of real ecommerce business intelligence.
💬 Reviews
"Almost all of the super popular, easy-to-use, out-of-the-box reports now have to be manually created."
Verified User Google Analytics G2 Verified Review
"I love how seamlessly it connects our ad platforms and CRM data, showing exactly where our conversions come from and which campaigns drive the most revenue."
Verified User Triple Whale G2 Verified Review
My open question for the next 18 months: will vertical SaaS native AI ever earn back the trust operators lost, or does the dedicated layer just win by default? I lean toward the latter, but I would love to be proven wrong. Our take on agentic AI for ecommerce founders goes deeper.
Q6. Which prediction jobs matter most, and which tools do them best? [toc=6. Jobs-to-Tools Map]
The prediction jobs that move money are churn risk, predictive customer lifetime value (CLV, forecasted spend per customer), demand and inventory forecasting, next-order-date, and product recommendations. Klaviyo leads on retention-driven CLV, churn, and next-order timing. Glew and Saras handle SKU and cohort LTV. GA4 covers purchase probability, and cross-functional layers like Luca cover demand and cash-linked forecasting. Pick the tool for the job you actually have.
🗺️ The five jobs, mapped to the right tool
Buy for the job in front of you, not the longest feature list. Here is how the core prediction jobs line up.
⏰ Tie each job to a Monday action
A prediction only matters if it changes what you do this week. Churn risk means "email these customers now," and demand forecasting means "place this reorder." Both feed straight into your ecommerce customer lifetime value math.
One tactical note on demand: base lead-time forecasts on the median, not the mean, so one slow supplier does not skew the plan. And know the limit, one operator, Carrie Lamb, said her Google Ads data "was not good enough" for AI analysis, so human judgment still overrides prediction sometimes.
💬 Reviews
"Atributtion is the most helpful thing, I can see big differences between what Triple Whale says an ad sold and what Meta says."
Verified User Triple Whale G2 Verified Review
"If you are a small business, this will provide you enough information that you will be able to directionally understand traffic on your site."
Gitai B., Marketing, Web Analytics, and Testing Lead Google Analytics G2 Verified Review
Where I see Luca fitting is the demand and cash-linked forecasting job, plus root-cause work, surfacing the influencing components across jobs rather than living in one silo, the essence of unified ecommerce data analytics. My hypothesis: the highest-value job in 2027 will not be any single prediction, it will be connecting them.
Q7. Analytics-only tools vs capital providers: which model closes the loop for you? [toc=7. Intelligence & Capital]
If you need prediction, judge tools on how well they extract, forecast, simulate, and find root cause across your data. If you need growth capital, judge providers on disbursal speed, pricing, and sizing, not their dashboards. The 2026 shift is toward closing the loop: predicting the opportunity and funding it. Match the model to the job in front of you.
🧠 Two buyers, two scorecards
These are different jobs with different scorecards. Do not let a slick dashboard sell you on a loan, or a funding offer sell you on analytics.
I have watched founders conflate the two and regret it. The clean rule: judge analytics on analytics, and judge capital on capital.
📊 Judging analytics-only tools
On the analytics side, ignore the marketing and test the engine. Can it extract the right data, forecast from history, simulate a scenario, and find the root cause of an outlier?
This is exactly the lane Luca competes in as an analytics tool. It is an AI layer over your warehouse that predicts, simulates, and root-causes, then pushes scheduled reports to Slack and email, comparable to the best ecommerce analytics platforms.
💰 Judging capital providers
On the capital side, the dashboard is irrelevant. Judge a provider on three numbers only: how fast money hits your account, what it truly costs, and whether the amount fits your need.
Revenue-based financing sounds founder-friendly, but the pricing can turn ugly below $5M GMV (gross merchandise value, total sales run through the store). So price it honestly against your margin before you sign, and read our primer on revenue-based financing first.
🔁 What closing the loop changes
Here is the shift worth watching: predicting the opportunity and funding it in one motion. Data needs action, action needs capital, and closing that gap is the point.
Trust is quietly moving too, as one operator put it, they would trust AI before a consultant in Denver who does not understand their customer. So here is my honest question for you: is your bottleneck knowing what to do, or having the cash to do it? Tell me which, and the right model gets a lot clearer, and our view on how AI can actually help you run your e-commerce business is a good next read.




