Ecommerce Data Analytics: A Step-by-Step Guide to Tracking Profit, Retention, and Ad Performance Without an Agency
13
mins read
In this article
TL;DR
Nine KPIs do 90% of the work for a Shopify SMB: revenue, contribution margin, blended CAC, LTV, AOV, 90-day repeat rate, blended ROAS, conversion rate, and weeks-of-cover. Most stores fly blind because Shopify, GA4, Meta, and Xero do not reason horizontally, leaving the founder as the manual integration layer for 10 to 15 hours a week. Three artefacts catch most leaks: a SKU contribution-margin sheet, a Shopify-vs-GA4-vs-Meta reconciliation template, and an 8-point GA4 purchase-event QA checklist. Run RFM scoring plus cohort retention to find which paid channel actually produces 90-day repeat buyers, since aggregate retention numbers hide the truth. A Mon/Wed/Fri cadence under 90 minutes a week replaces what agencies bill 3K a month for, and an AI reasoning layer can run that cadence on autopilot. Compare working capital on five metrics: effective APR, disbursal time, sizing logic, repayment structure, and personal-guarantee requirement before signing anything.
Q1. What Is Ecommerce Data Analytics, and Which 9 KPIs Actually Drive a Shopify SMB's Profit? [toc=1. What Is Ecommerce Analytics]
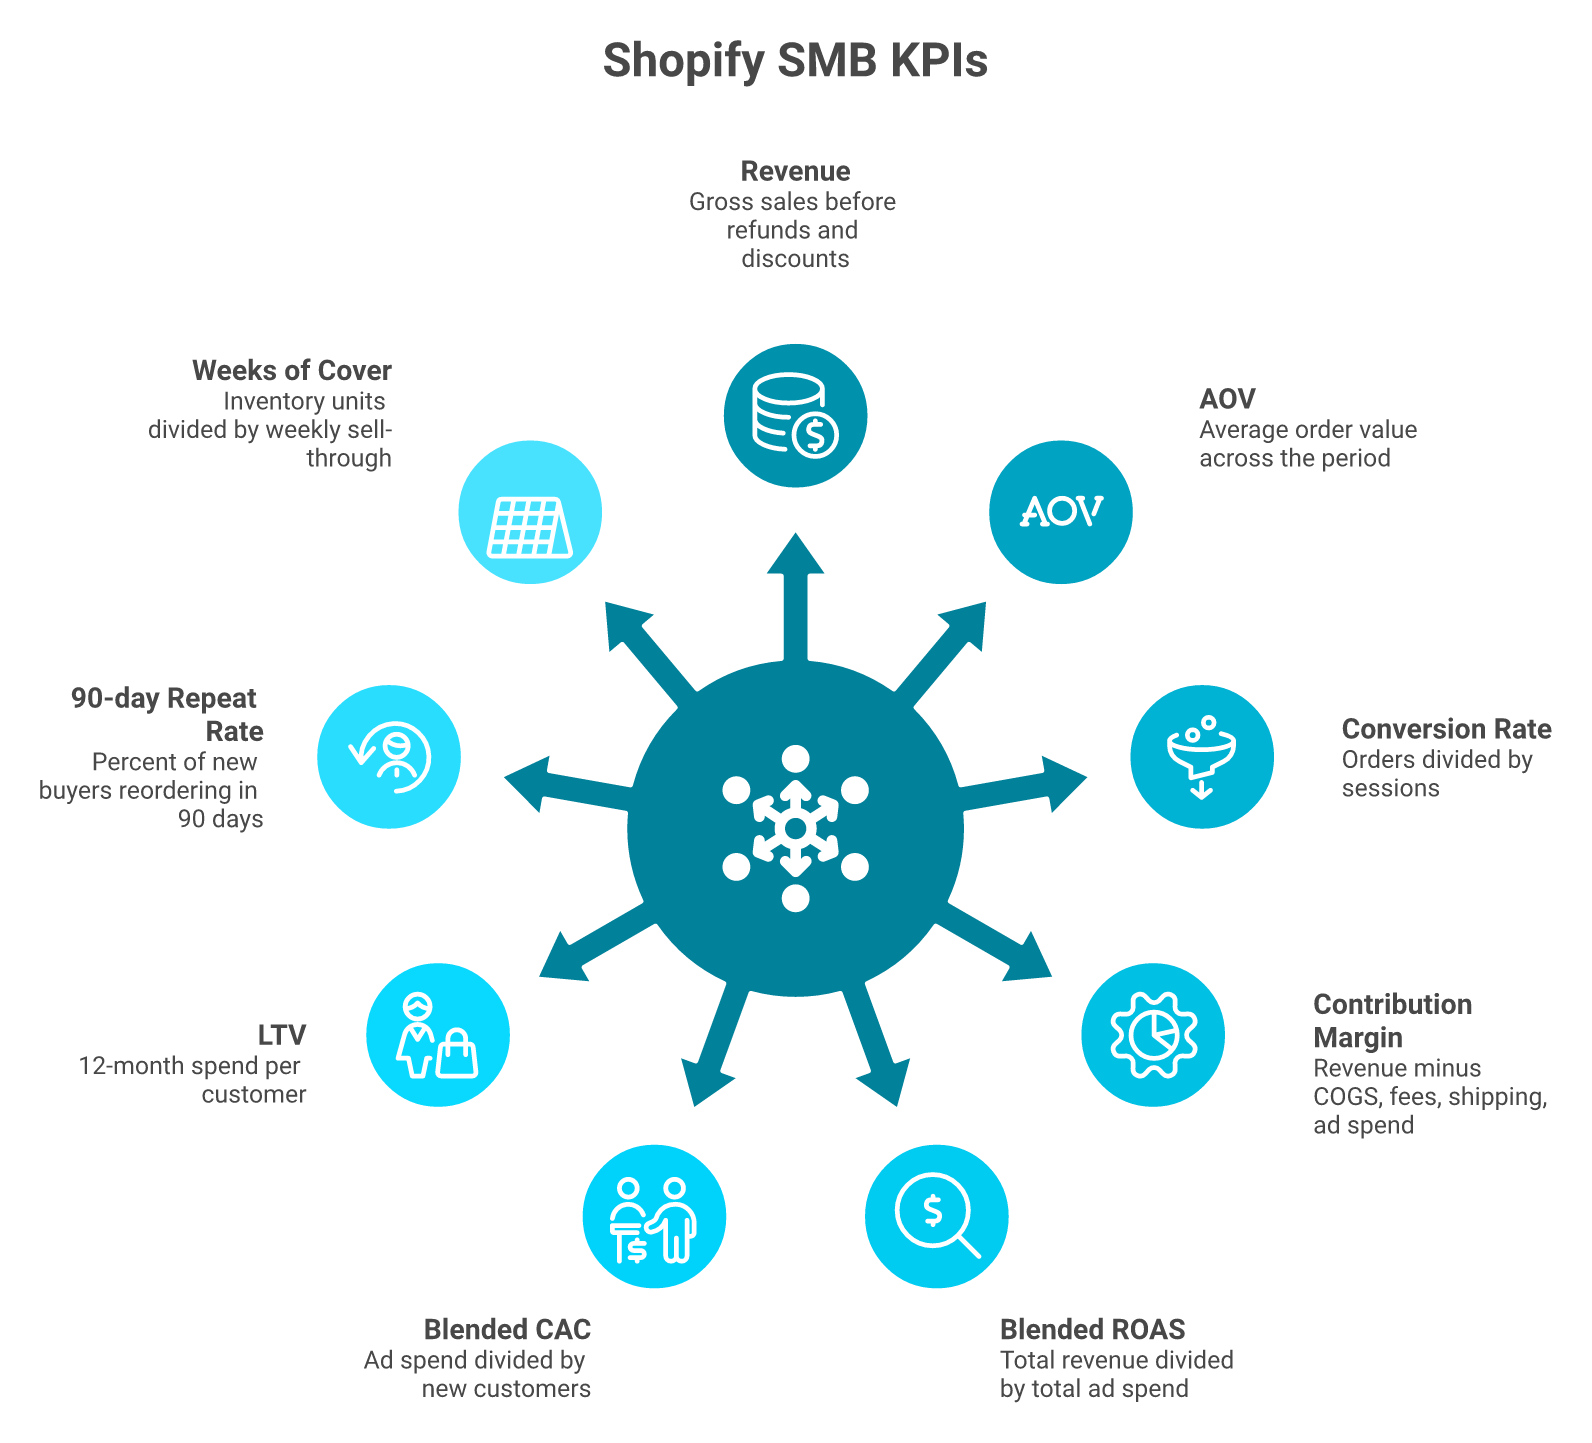
Ecommerce data analytics is the practice of turning Shopify orders, ad-platform spend, GA4 behavior, Klaviyo retention, and accounting data into weekly profit decisions. For a Shopify SMB, nine KPIs do roughly 90% of the work: revenue, contribution margin, blended CAC (customer acquisition cost), LTV (lifetime value), AOV (average order value), 90-day repeat rate, blended ROAS (return on ad spend), conversion rate, and inventory weeks-of-cover. Everything else is noise until those nine are clean.
💰 The 9 KPIs every Shopify SMB should pin above the desk
Most "ecommerce KPI" lists ship 40 metrics. Operators don't have time for 40. After running this exercise on dozens of stores, nine numbers are what actually move the P&L week to week. A clean unit economics tracking framework starts with this shortlist.
The nine pipes that replace forty-metric KPI lists, grouped by funnel stage, profit, and retention.
The 9 KPIs Every Shopify SMB Should Track Weekly
#
KPI
Plain-English definition
Source of truth
1
Revenue
Gross sales before refunds and discounts
Shopify Orders
2
Contribution margin
Revenue minus COGS, fees, shipping, and ad spend
Shopify + Xero + ad platforms
3
Blended CAC
Total ad spend divided by new customers
Meta + Google + Shopify
4
LTV
Total spend per customer over 12 months
Shopify + Klaviyo
5
AOV
Average order value
Shopify Orders
6
90-day repeat rate
% of new buyers who reorder in 90 days
Shopify Customers
7
Blended ROAS
Total revenue divided by total ad spend
Shopify + ad platforms
8
Conversion rate
Orders divided by sessions
Shopify + GA4
9
Weeks-of-cover
Inventory units divided by weekly sell-through
Shopify Inventory
⚠️ Why most KPI lists fail operators
Most define ecommerce analytics as the process of collecting data from all of the sources that affect your online store. That's accurate, but it's also the part founders already understand. The harder question is which numbers to trust on a Tuesday morning when MER (marketing efficiency ratio) drops, and inventory lands Friday.
Ken Price, who runs merchandising at Blake Mill, put it best: the amount of data around merchandising is huge, and you're "drinking from a fire hydrant." The fire hydrant is the problem. Nine pipes, not forty. A founder facing this exact problem can read more on why e-commerce founders are drowning in data.
✅ How an AI reasoning layer changes the math
The nine KPIs above are not hard to define. They are hard to keep live, every week, across five tools. An AI layer over a unified data warehouse, like Luca AI, extracts these from Shopify, Meta, Google Ads, and Xero, normalises them on ingestion, and answers in plain English when you ask "what's my contribution margin by channel this week?" That's the difference between owning the nine and chasing them.
Q2. Why Do Most SMB Stores Still Fly Blind With Shopify Analytics, GA4, and Triple Whale Already Installed? [toc=2. Why SMBs Fly Blind]
It's 11 PM on a Thursday. You've spent three hours exporting CSVs from Shopify, Meta Ads Manager, and Stripe, trying to figure out which product-channel combination is actually profitable. Your spreadsheet has 47 tabs. You still don't have a confident answer.
This isn't a tool problem. It's an architecture problem.
Why most SMB stores still fly blind: five tools, no horizontal reasoning, and the founder pays in hours.
Why fragmentation exists by design
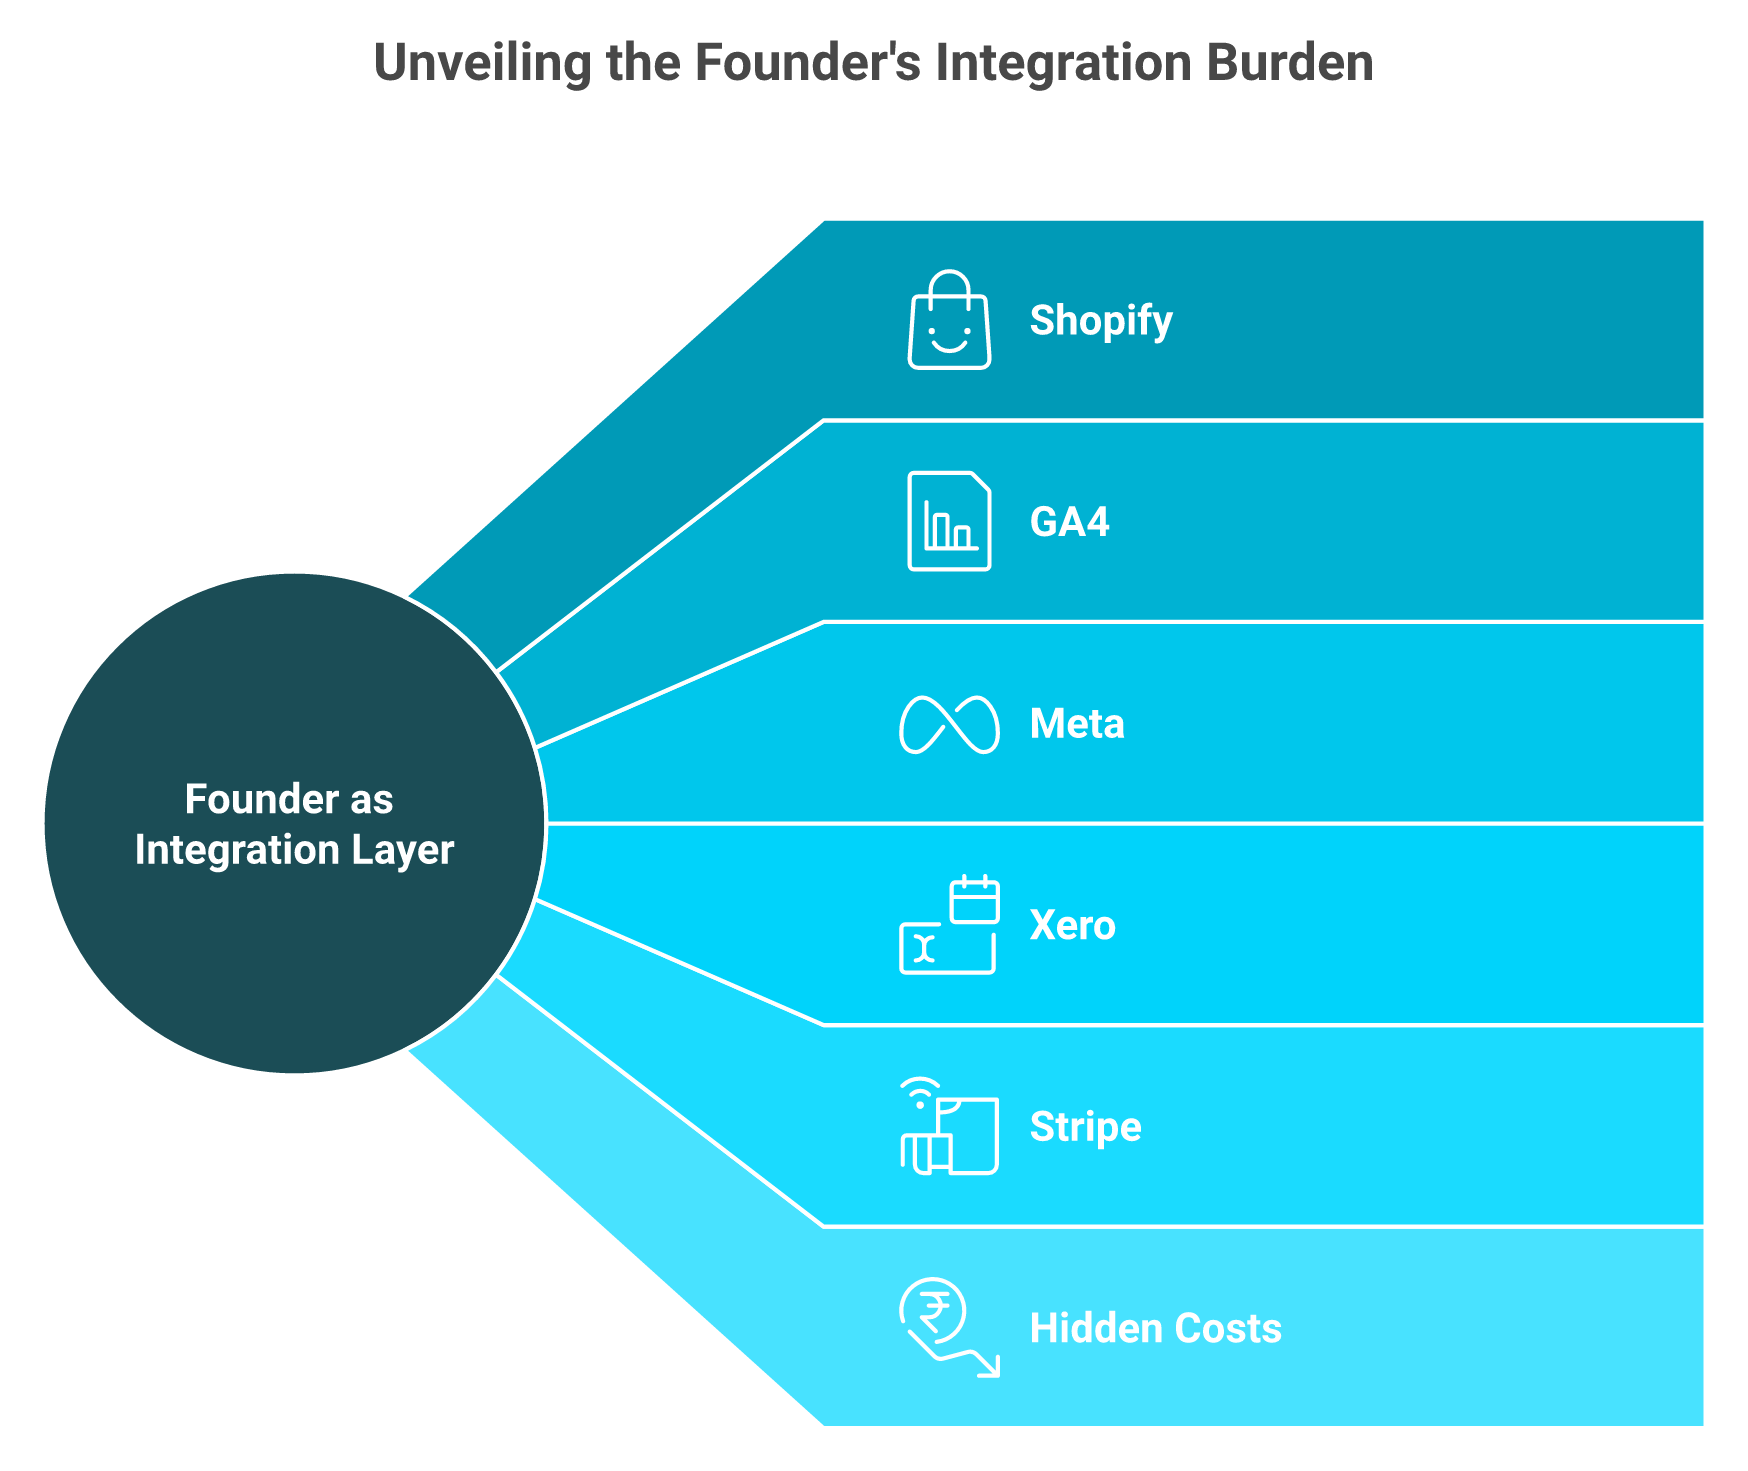
Each tool in your stack was built to win one slice of the workflow. Shopify shows orders. Meta shows clicks. GA4 shows sessions. Xero shows cash. None of them can reason horizontally, and none can answer "if I scale Meta spend 20% this week, what happens to my cash position by August?"
The founder becomes the manual integration layer. That's where the 10 to 15 hours a week of reporting time disappears. A modern e-commerce tech stack should remove that swivel-chair work entirely.
💸 The hidden costs operators rarely admit
⏰ 10 to 15 hours a week consolidating CSVs and reconciling numbers
❌ 15 to 20% reporting variance between Shopify, GA4, and Meta on the same week
⚠️ Decisions delayed 3 to 5 days while the founder hunts the discrepancy
💰 Capital sitting idle because nobody trusts the cash forecast enough to deploy
The Triple Whale receipts
I'm not picking on Triple Whale. They built a serious product. But the operator complaints are loud and consistent, and they are exactly the architectural problem this article exists to solve. Operators evaluating Triple Whale alternatives see the same patterns surface repeatedly.
"Broken integrations. Fake attribution for external marketplaces. Daily revenue totals are wrong, entire order blocks are missing, and every week we have to open new support tickets just to get our numbers halfway close to what our channel actually reports." XTRA FUEL, Verified Reviewer Triple Whale Trustpilot Verified Review
"Integrations are inconsistent, building with the AI tool Moby is very buggy and crashes more than half the time, and support is largely unresponsive. We end up reverting back to direct data sources like Meta, Shopify, Recharge." Matt Huttner, Verified Reviewer Triple Whale Trustpilot Verified Review
GA4 isn't immune either. A mid-market reviewer on G2 was direct about it.
"It is becoming very opaque, it doesn't have real-time, the sampling is increasingly wild. Sessions do not match the session_start event. To make decisions based on grounded data, it is really difficult to trust it 100%." Verified User in Retail Google Analytics G2 Verified Review
What "should" look like
The right system reads across your stack, normalises the data on ingestion (so you skip what operators call the "data-cleanup year" of fixing SKU naming and attribution gaps), and answers cross-functional questions in seconds. That's the AI layer over a unified data warehouse, not another dashboard, not another pixel, and not another retainer. From fragmented tools to one reasoning surface, that's the shift you can explore through Luca's data analysis and deep industry research capability.
Q3. How Do You Calculate True Contribution Margin Per SKU and Per Channel, Step by Step? [toc=3. Contribution Margin Math]
Contribution margin per order = Revenue − COGS − payment fees − shipping − returns reserve − allocated ad spend. A €100K-revenue Shopify store can build this in a sheet in about 90 minutes by joining Shopify orders to ad spend by UTM, and pulling COGS from inventory. The catch is that it goes stale within a week. Automating ingestion into a unified data layer is the only way to keep it live.
The 5-step procedure
Step 1: Export Shopify orders with line items
Pull a 30-day order export from Shopify Admin (Orders → Export) including SKU, quantity, gross sales, discounts, refunds, and shipping charged. This is your spine. Every other column joins to this. The full Shopify analytics guide covers exports in detail.
Step 2: Pull COGS per SKU
Export your inventory cost from Shopify Inventory or your 3PL. If COGS varies by batch, take a weighted average for the period.
Sum Meta + Google + TikTok spend for the period. Allocate to orders by UTM source. Where UTM is missing, fall back to a blended allocation using the channel's revenue share.
Allocated ad spend per order = (Channel spend ÷ Channel orders) for that order's source
Pivot by SKU and by channel. Two things will jump out: a "best-seller" that's actually losing money once shipping hits, and a "small" channel quietly carrying the highest margin. This is exactly the dynamic explored in the declining platform ROAS vs true profitability piece.
A worked example: €100K-revenue store
A €100K month with 35% blended COGS, 3% fees, 8% shipping, 5% returns reserve, and 22% blended ad spend leaves roughly 27% contribution margin, which is €27K to cover overhead and profit. Pivot it by SKU, and you'll usually find the bottom 20% of SKUs are dragging this 4 to 6 points lower.
What jumps out after looking at thousands of P&Ls
Anthony Mink at Live Bearded discovered that customers who bought from three or more product categories were the entire LTV story. Frequency wasn't the driver, category diversity was. SKU-level margin reveals that. Order-level revenue hides it.
The hard part isn't the formula. It's keeping the formula live without rebuilding the sheet every Monday. An AI reasoning layer over your data warehouse rebuilds it continuously. You ask "show me contribution margin by SKU this week," and the answer reflects Friday's ad spend without anyone touching a CSV. Luca's financial management use case automates this exact loop.
Q4. Last-Click vs Data-Driven vs MMM: Which Attribution Model Should You Trust, and How Do You QA It in GA4 + Shopify? [toc=4. Attribution Models QA]
Last-click is fast and broken. Data-driven is a black box. Marketing mix modeling (MMM) needs scale most SMBs don't have. The honest answer is to run two in parallel and reconcile weekly. But before any model means anything, verify in GA4 DebugView that purchase events fire once per order, transaction IDs match Shopify order IDs, and refunds deduct correctly. Variance over 10% across Shopify, GA4, and Meta means every ROAS number after that is built on sand.
The 3-model micro-comparison
Last-Click vs Data-Driven vs MMM: When Each Works
Model
What it is
Where it works
Where it breaks
Last-click
Credits the final touch
Direct response, short cycles
Ignores discovery, undercounts top-of-funnel
Data-driven (DDA)
GA4's algorithmic credit
Mid-traffic stores
Black box, needs ~300 conversions/month
MMM
Statistical model on aggregate spend
$5M+ GMV brands
Needs 18+ months of data
My read right now is that sub-€5M stores should run last-click in Shopify alongside data-driven in GA4, then reconcile weekly. Above €5M, layer in a lightweight MMM. The mechanics of Google Analytics for ecommerce are foundational here.
✅ The 8-point GA4 + Shopify purchase-event QA checklist
Run this before you trust any number in any model.
☐ Purchase event fires exactly once per order in GA4 DebugView
☐ Transaction IDs in GA4 match Shopify order IDs
☐ Refunds deduct correctly via the refund event
☐ Server-side tracking via Conversions API is live for Meta
☐ Consent Mode v2 is configured (EU stores especially)
☐ UTMs are present on 95%+ of paid sessions
☐ Click IDs (gclid, fbclid) are captured into Shopify cart attributes
☐ Cross-domain tracking is set if checkout is on a separate domain
Score below 5? Pause spend decisions until you fix it. The full Add Google Analytics to Shopify walkthrough covers each of these checks.
The receipts on why this matters
Operators on Reddit have learned this the hard way:
"Shopify ecommerce data are not showing on GA4. Default install undercounts purchases." u/anonymous, r/GoogleTagManager Reddit Thread
"It is becoming very opaque, it doesn't have real-time, the sampling is increasingly wild. Sessions do not match the session_start event. To make decisions based on grounded data, it is really difficult to trust it 100%." Verified User in Retail Google Analytics G2 Verified Review
And on what happens when an attribution layer goes wrong:
"They told Google to calculate page views as conversions. Now Google thinks it has given me lots of sales, the algorithm is messed up, and it's costing me a fortune every day." David Banks, Verified Reviewer Wetracked Trustpilot Verified Review
What I'd do Monday morning
Run the 8-point checklist this week. Fix anything below 6/8 before next ad spend cycle. Then set up a one-page reconciliation between Shopify, GA4, and Meta. If variance crosses 10%, freeze the budget conversation until the data is fixed. An AI reasoning layer can run that reconciliation every morning, and ping you on Slack only when variance breaches the threshold, which is the only honest way to keep three attribution models in sync without hiring an analyst. Luca's marketing analysis and automation capability does exactly this.
Q5. How Do You Identify and Retain High-Value Repeat Customers Using RFM and Cohort Retention? [toc=5. RFM and Cohort Retention]
Score every customer 1 to 5 on Recency, Frequency, and Monetary value (the RFM model), then trigger Klaviyo flows for 555 (champions) and 155 (at-risk-high-value). Layer cohorts by acquisition month to see which paid channel produces 90-day repeat buyers. Most SMBs find that one channel quietly subsidises another, and only cohort vigilance reveals it.
What RFM actually means in plain English
RFM stands for Recency (days since last order), Frequency (number of orders), and Monetary value (total spend). Each customer gets a 1 to 5 score per axis. A 555 has bought recently, often, and spent a lot. A 155 used to spend a lot and has gone quiet.
You can build the scoring directly off a Shopify customer export. No SQL, no analyst, just a quintile bucket per axis. The mechanics map cleanly to the Shopify analytics dashboard explained.
💰 The 5-step RFM build
Export customers.csv from Shopify (Admin → Customers → Export)
A 25% repeat rate at the store level tells you nothing useful. A 38% 90-day repeat rate from the August Meta cohort, vs. 19% from the August TikTok cohort, tells you exactly where to push budget next month.
Klaviyo's 2024 benchmarks confirm flow revenue is dramatically higher when triggered by behaviour vs. broadcast, with segmented campaigns out-converting bulk sends by orders of magnitude. This is the kind of pattern Luca's sales performance module surfaces automatically.
What the Live Bearded data taught everyone
Anthony Mink at Live Bearded did the work and shared the answer. Customers who bought from three or more product categories had a 100% lift in LTV, while purchase frequency alone was not the driver. Category diversity was the signal.
That changes the cross-sell strategy completely. You stop sending "buy more of the same" emails, and start sending "have you tried this category?" flows. Luca's product management use case is built around exactly this kind of category-level reasoning.
"We genuinely thought they would be our partner... at the end of the day, like the Wizard of Oz, their underwriter is some other person behind the scenes pulling the strings." Mike M, Verified Reviewer Uncapped Trustpilot Verified Review
I include that to make a point: founders who lean only on platform-reported retention numbers end up disappointed the same way. The real signal is in the cohort math, not the marketing copy.
Cohort-level vigilance without the cohort-level dashboard
Building this in Sheets every week is doable. Keeping it live across Shopify, Klaviyo, and Meta is where most operators give up by month three. An AI reasoning layer over your data warehouse can compute RFM, build cohort retention curves, and ping you on Slack when a cohort's 90-day repeat rate drops below trend, without you opening a single tab. Luca operates as agentic AI for ecommerce founders, doing exactly this work in the background.
That's the analytics outcome operators actually want. Cohort vigilance, not cohort dashboards.
Q6. Shopify Analytics vs GA4 vs Polar vs Triple Whale vs an AI Reasoning Layer: Which Analytics Stack Fits Your GMV Band? [toc=6. Analytics Stack by GMV]
Under €1M GMV: Shopify Analytics + GA4 + a sheet is enough. Between €1M and €5M: add Polar or Triple Whale for blended ROAS and contribution margin. Above €5M: dashboards stop scaling, and decisions stall. That's where an AI layer over a unified data warehouse, like Luca AI, pulls ahead, because it extracts, predicts, simulates, and root-causes across all data, then pushes scheduled reports to Slack and email without you opening a tab.
Why this comparison matters by GMV band
Tool choice isn't a feature decision. It's a stage decision. The right answer at €500K is the wrong answer at €5M, and the right answer at €5M is overkill at €500K. The full landscape of ecommerce analytics platforms shifts dramatically across these bands.
Capability Comparison: Luca AI vs Shopify Analytics, GA4, Polar, and Triple Whale
Capability
Luca AI
Shopify Analytics
GA4
Polar
Triple Whale
Plain-English queries
✅ Native
❌
❌
Limited
Moby (limited)
Cross-source data warehouse
✅
❌
❌
Marketing only
Marketing only
Scenario simulation
✅
❌
❌
❌
Limited
Root-cause analysis
✅
❌
❌
Limited
Limited
Outlier alerts (Slack/email)
✅
❌
❌
Email only
Limited
Scheduled push reports
✅
❌
❌
❌
Limited
Setup time
~10 min
Built-in
30 to 60 min
1 day
1 to 2 weeks
Luca sits first because it's the only AI-native reasoning layer in the row. Most analytics tools added AI. Luca is AI. For a deeper look at the best Shopify analytics apps ranked across these dimensions, the comparison stays consistent.
What operators are actually saying
"Broken integrations, fake attribution for external marketplaces. Daily revenue totals are wrong, entire order blocks are missing, and every week we have to open new support tickets just to get our numbers halfway close." XTRA FUEL, Verified Reviewer Triple Whale Trustpilot Verified Review
"Integrations are inconsistent, building with the AI tool Moby is very buggy and crashes more than half the time. We end up reverting back to direct data sources like Meta, Shopify, Recharge." Matt Huttner, Verified Reviewer Triple Whale Trustpilot Verified Review
"It is becoming very opaque, the sampling is increasingly wild. To make decisions based on grounded data, it is really difficult to trust it 100%." Verified User in Retail Google Analytics G2 Verified Review
Who should pick what
✅ Sub-€1M GMV: Shopify Analytics + GA4 + a Google Sheet. Don't overbuild.
✅ €1M to €5M GMV: layer in Polar or Triple Whale for blended ROAS and contribution margin, accept the integration drift, and reconcile weekly.
✅ €5M+ GMV: dashboards alone won't keep up. An AI reasoning layer reads across Shopify, Meta, Google, Klaviyo, Stripe, and Xero, and answers "what changed and why" in plain English.
The contrarian take
Vertical SaaS dashboards feel very old-SaaS by 2026. The frontier of analytics isn't more charts. It's reasoning, simulation, and proactive push, and that requires an architecture built around an LLM, not bolted onto a dashboard. The thinking is laid out in the intelligence capital thesis.
Q7. What Does a Weekly Mon/Wed/Fri Operating Cadence Look Like Without an Agency or Data Team? [toc=7. Weekly Operating Cadence]
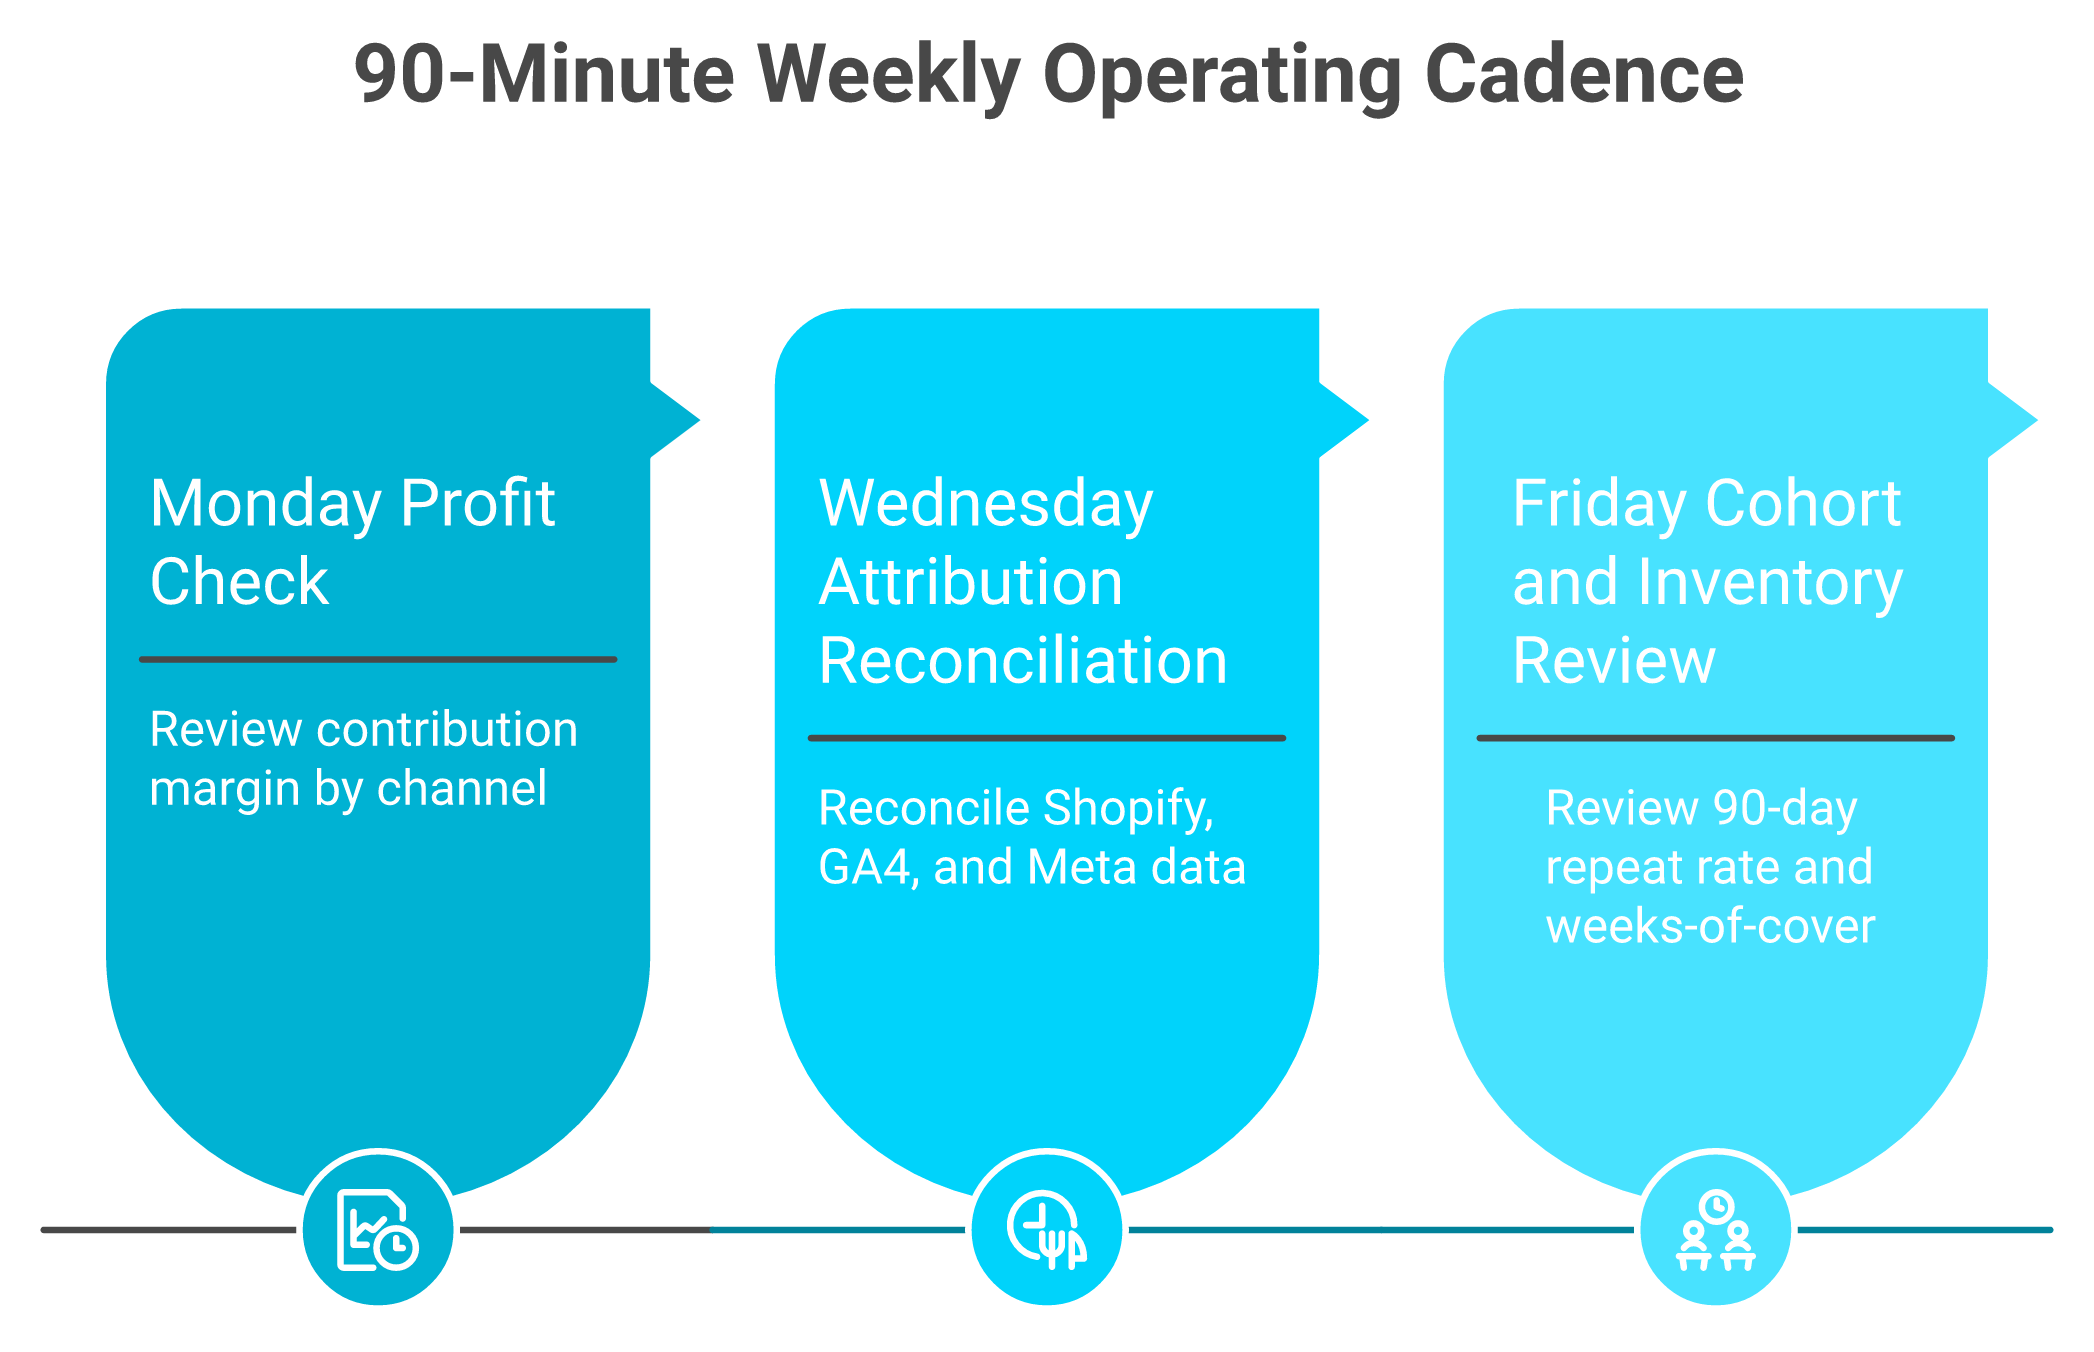
Monday 15 minutes: profit check (contribution margin by channel, week-over-week). Wednesday 20 minutes: attribution reconciliation (Shopify vs GA4 vs Meta variance). Friday 25 minutes: cohort and inventory review (90-day retention, weeks-of-cover by SKU). Total: under 90 minutes a week to replace what most agencies bill €3K/month to deliver, and arrive 5 days late.
Here's how a $1M to $5M Shopify founder runs the week
A 90-minute Mon/Wed/Fri rhythm replaces what most ecommerce agencies bill thousands a month to deliver.
⏰ Monday 9:00 AM, profit check (15 min)
Open the contribution-margin view. Look at three numbers: blended margin %, week-over-week delta, and worst-performing channel.
Decision rule: if margin dropped more than 3 points week-over-week, flag the channel and freeze new spend in that channel until Wednesday's reconciliation.
Pull Shopify revenue, GA4 purchase revenue, and Meta-reported revenue for the prior 7 days. Compute variance.
Decision rule: variance under 10% means trust the numbers and let bids run. Variance over 10% means pause budget changes until the GA4 + Shopify QA checklist (from Q4) is rerun.
⏰ Friday 4:00 PM, cohort and inventory review (25 min)
Two questions: which acquisition cohort is producing the best 90-day repeat rate, and which SKUs have under 4 weeks of cover?
Decision rule: shift Monday's spend allocation toward the highest-retention channel. Trigger PO conversations on any SKU under 4 weeks of cover. Operators worried about timing can stress-test their model with cash-flow forecasting for e-commerce.
What the same week looked like before
"Shopify started taking daily repayment deductions from my bank account even though I have NOT received any NEW CAPITAL or SIGNED for a NEW LOAN." u/anonymous, r/ecommerce101 Reddit Thread
Before the cadence: 4 hours across 6 tools, two decisions delayed pending more data. After the cadence: 90 minutes, three confident decisions, and capital allocated.
The Common Thread Collective math
CTC's operator benchmarks consistently show that DTC teams under $5M spend 8 to 15 hours a week on manual reporting. The 90-minute cadence above doesn't replace insight, it just removes the swivel-chair work. That's exactly the gap ecommerce management software like Luca closes.
That's an unrelated Shopify Capital horror story, but it's exactly the kind of anomaly a Friday inventory review catches before it becomes a Monday cash-flow crisis.
What changes when an AI layer runs the cadence for you
Leon Surman, who runs Wellbox, told us Luca "saves me personally a lot of time a day," because the same Mon/Wed/Fri questions get answered in Slack before he asks them. The cadence stops being a calendar event, and becomes an inbox. You can read more in the piece on Meet Luca AI.
That's the productivity multiplier I think shifts ecom analytics over the next 18 months. The founder doesn't run the cadence. The system does, and pings the founder only when something is off.
Q8. When Should You Take Working Capital, and How Do Wayflyer, Clearco, 8fig, and Luca Compare on Rate, Speed, and Sizing? [toc=8. Working Capital Comparison]
When your data says scale, capital becomes the constraint. Compare providers on five capital metrics only: effective annualised cost, disbursal time, sizing logic (static vs dynamic), repayment structure, and personal-guarantee requirement. Wayflyer disburses in 24 to 48 hours at 6 to 12% flat fees. 8fig requires a strict spend plan with cycle-based disbursal. Luca AI disburses dynamically priced capital in under 24 hours with no personal guarantee, sized to actual need rather than maximum advance.
When taking capital is the right call
Capital is correct when three conditions hold:
✅ A campaign or SKU has proven unit economics over a recent window
✅ The cash-conversion cycle (days from spend to cash back in bank) is under 60 days
✅ The cost of capital is less than the projected contribution margin on deployment
"0% customer service whatsoever. I've done 2 loans with these people and can't get a hold of a real person." Trustpilot Verified Reviewer Wayflyer Trustpilot Verified Review
"They sucker you in by saying how they will scale you big and then since you're hooked legally now, they create a disbursement and payment plan that gets extremely confusing to follow." Suckered In, Verified Reviewer 8fig Trustpilot Verified Review
"I wasn't asked when Uncapped took over the business I had with SellersFi. They are aware of these problems and promise me for the last 5 months to fix them, but nothing has ever changed." Volker Foerster, Verified Reviewer Uncapped Trustpilot Verified Review
The pattern across these is consistent: static rates priced at the top of the offer, sizing pushed to the maximum advance the provider can underwrite, and repayment terms that don't flex when the business does.
Who should pick what
✅ You need capital fast and have proven unit economics: Luca for sub-24-hour, dynamically-priced capital sized to the actual deployment. No personal guarantee. The blueprint is in how to get funding to scale e-commerce marketing campaigns.
✅ You're already approved with Wayflyer and like the relationship: Wayflyer remains a credible option at $5M+ GMV, accepting the static-fee trade-off.
⚠️ You're considering Clearco or 8fig: read the Trustpilot pattern above carefully. Sub-$5M brands repeatedly report the cost-of-capital sliding to 35%+ APR once cycles compound.
The contrarian take on sizing
The dirty secret of revenue-based financing is that providers earn more on bigger advances. They have an incentive to push $300K when you need $150K. Dynamic, health-based sizing flips that incentive. Take what you need, when you need it, priced to your current performance, and refinance up if the math holds. That's the capital metric that compounds quietest, and matters most. 💰
Q9. Which Templates and Checklists Should Every Shopify Operator Build (or Steal) This Week? [toc=9. Templates and Checklists]
Three artefacts cover roughly 80% of weekly analytics work: a SKU contribution-margin sheet (catches loss-making best-sellers), a Shopify-vs-GA4-vs-Meta reconciliation template (catches attribution drift over 10%), and a GA4 purchase-event QA checklist (catches missing or duplicated events). Build them once in Sheets. An AI reasoning layer can later replace them with live, always-on equivalents.
Why three artefacts beat ten dashboards
Most operators try to dashboard their way out of a data problem. After looking at thousands of Shopify P&L's, what jumps out is that three small artefacts catch most of the leaks. They also let founders skip what operators call the "data-cleanup year" of normalising SKU names and stitching attribution before any analysis happens. The fastest way out of that trap is the playbook in the best way to track e-commerce unit economics.
Each one takes under two hours to build. Each one catches a specific failure mode that costs real money.
💰 1. SKU contribution-margin sheet
What it does: ranks every SKU by true contribution margin after COGS, fees, shipping, returns, and allocated ad spend
Columns: SKU, units, gross revenue, COGS, payment fees, shipping cost, returns reserve, allocated ad spend, contribution margin, and margin %
Failure mode caught: best-sellers that lose money once shipping hits, hidden in volume-led reports
Time to build: 90 minutes from a Shopify orders export and a COGS file
I've watched a $400K/month founder discover that his top SKU by units was the worst by margin once shipping was loaded in. The sheet paid for itself in one Friday review. The same logic underpins declining platform ROAS vs true profitability.
2. Shopify vs GA4 vs Meta reconciliation template
What it does: compares the three revenue numbers side-by-side for the prior 7 days
Columns: date, Shopify revenue, GA4 purchase revenue, Meta-reported revenue, max variance %, and action flag
Failure mode caught: silent attribution drift that breaks every ROAS decision downstream
Time to build: 60 minutes once UTMs and click IDs are clean
If max variance crosses 10% on any day in the rolling week, freeze new budget changes until the GA4 purchase-event QA checklist (asset 3) is rerun. That single rule prevents most of the "we scaled into broken tracking" disasters I see.
✅ 3. GA4 purchase-event QA checklist
This is the 8-item checklist from Q4, in printable form. Pin it next to your monitor. The deeper walkthrough lives in add Google Analytics to Shopify.
☐ Purchase event fires once per order in DebugView
☐ Transaction IDs match Shopify order IDs
☐ Refunds deduct correctly via the refund event
☐ Conversions API is live for Meta server-side
☐ Consent Mode v2 configured for EU traffic
☐ UTMs present on 95%+ of paid sessions
☐ Click IDs (gclid, fbclid) captured in cart attributes
☐ Cross-domain tracking set if checkout is on a separate domain
Most of these aren't on by default in standard Shopify-GA4 installs.
From spreadsheets to a live reasoning layer
The honest truth is that these three sheets go stale in about a week. Rebuilding them every Monday is the chore most founders quietly outsource to an agency at 3 grand a month. An AI layer over a unified data warehouse keeps all three live, and pings you on Slack only when a number breaks the threshold, which is the agency-free version of the same outcome. Luca's data analysis and deep industry research module is built around exactly this loop.
Q10. How Do Best-in-Class DTC Brands Operationalise Analytics: Lessons From Live Bearded, Wellbox, and Blake Mill [toc=10. Best-in-Class Analytics Lessons]
Live Bearded discovered category diversity (not frequency) drove 100% of LTV. Wellbox's CEO compresses hours of dashboard time into a daily AI briefing. Blake Mill's merchandising team learned to filter the "fire hydrant" by ranking SKU velocity weekly. The pattern across all three: stop watching dashboards, and start asking questions of a unified data layer.
The Live Bearded benchmark
Anthony Mink runs Live Bearded, a DTC men's grooming brand that scaled past $10M on Shopify. Public commentary from Anthony surfaces a finding that flips the standard retention playbook on its head. Customers who bought from three or more product categories had a 100% lift in LTV, while purchase frequency on its own was not the driver.
Why this changes the cross-sell strategy
Most retention emails push more of the same. Buy more beard oil. Buy more shampoo. The Live Bearded finding says the right next message is "have you tried this category?" Category diversity, not frequency, is the LTV signal. This kind of pattern recognition is exactly what product management at Luca automates.
You're not Live Bearded, and your customer file looks different. The same physics applies. SKU-level segmentation, not aggregate retention dashboards, is where the leverage sits.
The Wellbox parallel
Leon Surman, who runs Wellbox, told us directly: "Luca saves me personally a lot of time a day." The mechanism matters more than the quote. He stopped opening five tabs every morning, and started reading a single Slack briefing.
What changed for the CEO
The compression isn't about dashboards. It's about reasoning. The same questions Leon used to triangulate manually, what changed in retention, where did margin slip, and which SKU is approaching stockout, get answered before he asks them. The thinking behind this approach is laid out in what is an AI co-founder for e-commerce.
That's the agency-free version of a Monday morning report.
The Blake Mill receipts
Ken Price at Blake Mill articulated the merchandising problem with operator clarity: "The amount of data around merchandising is huge. You're drinking from a fire hydrant." His team's fix was ranking SKU velocity weekly, and acting on the top and bottom 20%, not all of it. This is what operators turning to the best AI tools for Shopify owners are increasingly looking for.
The pattern across all three
⭐ Stop watching dashboards, and start asking questions of a unified data layer
⭐ Filter the fire hydrant by ranking, not by reading
⭐ Replace daily reporting work with a daily briefing
What the best operators already know: the analytics edge by 2026 isn't another chart. It's a reasoning layer over a data warehouse that tells you the why alongside the what, and pushes the answer before you open a tab. The full landscape comparison sits in 7 best e-commerce analytics tools that fund your campaigns.
The principle
Data is a commodity. Reasoning is the edge.
Live Bearded did the LTV math. Wellbox compressed the workflow. Blake Mill filtered the hydrant. The connecting thread is that they treat analytics as a question-and-answer interface, not a wall of charts. An AI reasoning layer like Luca AI operationalises exactly this for SMB Shopify stores, with scenario simulation, root-cause analysis, and scheduled push reports to Slack and email.
You don't need their scale. You need their reasoning rhythm.
Q11. Are You Doing Ecommerce Data Analytics Right? A 7-Point Self-Audit Plus the Security Question Every Founder Eventually Asks [toc=11. Self-Audit and Security]
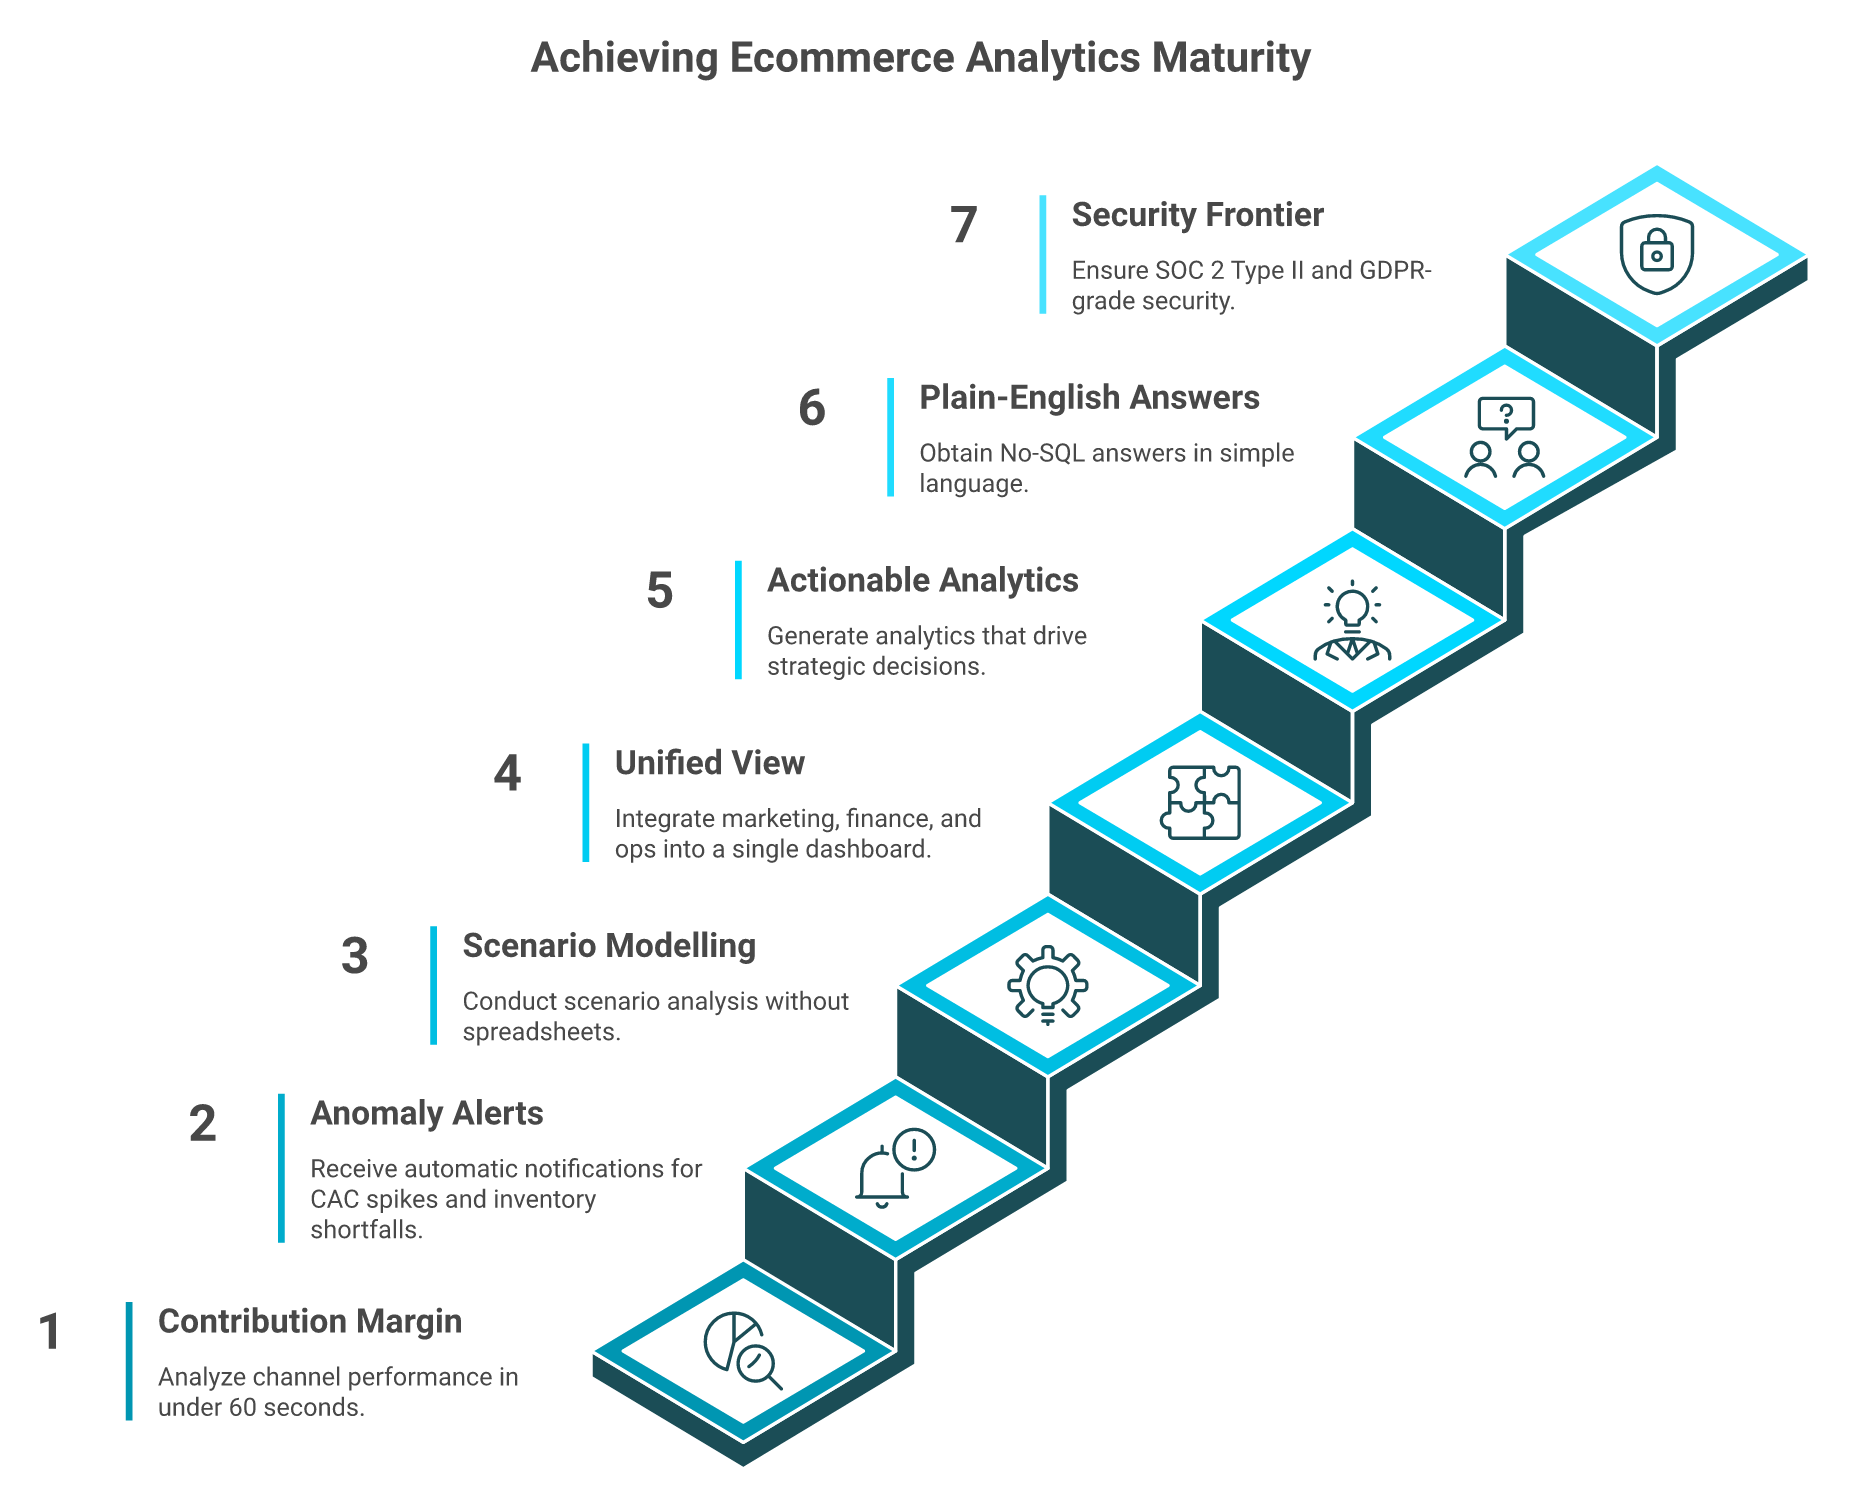
Score 0 to 7: contribution margin by channel in under 60 seconds, automatic anomaly alerts, scenario modelling, unified marketing-finance-ops view, action-capable analytics, no-SQL answers, and SOC 2 / GDPR-grade security on whatever AI layer you adopt. Below 5, fragmentation is costing you revenue you can't see. Above 5, the security checklist matters more than the feature checklist.
⚠️ The 7-point self-audit
Score your current stack against these seven criteria. Each unchecked box is a leak. If you want a side-by-side benchmark first, scan ecommerce analytics platforms.
A take-home benchmark: score yourself 0 to 7 on the criteria that separate fragmented stacks from frontier ones.
☐ Can you answer "what's my true contribution margin by channel?" in under 60 seconds?
☐ Does your system push automatic anomaly alerts for CAC spikes or inventory shortfalls?
☐ Can you model "if I scale Meta spend 30%, what happens to cash in 90 days?" without a sheet?
☐ Are marketing, finance, and ops data unified into one view?
☐ Can your analytics take action (pause ads, generate reports), or only display?
☐ Can your team get answers without SQL knowledge or analyst dependency?
☐ Does the AI tool you adopt meet SOC 2 Type II and GDPR standards?
How to read your score
0 to 2: fragmentation dominates. Manual processes are eating 10+ hours a week.
3 to 4: critical gaps exist. You're making decisions on incomplete data.
5 to 7: stack is mature. Focus on the security and reasoning frontier, not feature count.
🔒 The security question every founder eventually asks
"I'm not comfortable giving an AI access to all my financial data" is the most common concern I hear. It's rational. Your data is your moat.
The honest answer is architectural, not promotional. Any AI layer you adopt should meet four standards: SOC 2 Type II, GDPR compliance, AES-256 encryption at rest and in transit, and a no-training-on-your-data policy with full deletion rights. Verify before you trust. We expect you to. Our position on this is documented in the Luca privacy policy.
What real founders worry about (and the receipts)
"They rely on some AI software to analyse data, which seemed off. Looks like kids are working in underwriting." M. Islamovic, Verified Reviewer Uncapped Trustpilot Verified Review
"We had to fight to clear that up. They withheld funds, inflated the amount owed to over $100,000, and continued adjusting it despite the original agreement." Verified Reviewer 8fig Trustpilot Verified Review
Both quotes are about capital providers, not analytics tools. They make the same point: trust is earned through transparency on architecture, contracts, and data handling, not through marketing copy. If you're weighing capital partners, the comparisons in Wayflyer alternatives and Clearco alternatives apply the same lens.
Where to go from here
If you scored under 5, the fragmentation cost is likely between 10 and 15 hours a week, plus the silent variance in attribution. If you scored 5 or above, the next frontier is a reasoning layer that turns the seven boxes into one Slack channel.
Either way, the question isn't "which dashboard has the most charts?" The question is "which system can reason about my business the way a co-founder would?" That's the shift I'm watching closely, and the one explored in depth in the intelligence capital thesis.
FAQ's
What is ecommerce data analytics, and which KPIs should a Shopify SMB actually track?
Ecommerce data analytics is the practice of turning Shopify orders, ad-platform spend, GA4 behaviour, Klaviyo retention, and accounting data into weekly profit decisions. We see operators drown in 40-metric KPI lists, but only nine numbers move the P&L week to week.
Revenue, AOV, and conversion rate for top-of-funnel health
Contribution margin and blended ROAS for profit truth
Blended CAC and LTV for unit economics
90-day repeat rate for retention quality
Inventory weeks-of-cover for cash-tied-up risk
The hard part is keeping the nine live across five tools. We built Luca AI to extract these from Shopify, Meta, Google Ads, and Xero, normalise them on ingestion, and answer plain-English questions like 'what's my contribution margin by channel this week?' That is the difference between owning the nine, and chasing them every Monday.
How do we calculate true contribution margin per SKU and per channel without hiring an analyst?
Contribution margin per order equals revenue minus COGS, payment fees, shipping, returns reserve, and allocated ad spend. We build it in five steps:
Export 30 days of Shopify orders with line items
Pull per-SKU COGS as a weighted average across batches
Allocate variable fees: payment processing, real shipping cost, and a 90-day returns reserve
Allocate ad spend by UTM source, with a blended fallback for missing UTMs
Pivot by SKU and channel, then stack-rank by margin %
Two truths usually surface: a best-seller losing money once shipping hits, and a small channel quietly carrying the highest margin. The sheet works, but it goes stale weekly. We automate the entire loop inside Luca's financial management module, so contribution margin reflects Friday's ad spend without anyone touching a CSV. The framework also pairs with our unit-economics tracking guide.
Which attribution model should we trust: last-click, data-driven, or marketing mix modeling?
None alone. We run two in parallel and reconcile weekly. Last-click is fast but ignores discovery. GA4's data-driven attribution is a black box and needs roughly 300 conversions a month. Marketing mix modeling needs 18+ months of data and 5M+ GMV to be useful.
Before any model means anything, run our 8-point GA4 + Shopify QA checklist:
Purchase event fires once per order in DebugView
Transaction IDs match Shopify order IDs
Refund events deduct correctly
Conversions API live for Meta server-side
Consent Mode v2 configured
UTMs on 95%+ of paid sessions
gclid and fbclid captured into cart attributes
Cross-domain tracking set if checkout is on a separate domain
If variance across Shopify, GA4, and Meta crosses 10%, freeze budget changes. Our marketing analysis and automation module runs that reconciliation every morning, and pings Slack only when variance breaches threshold. The deeper walkthrough sits in our GA4 for ecommerce guide.
How does an AI reasoning layer compare to Shopify Analytics, GA4, Polar, and Triple Whale?
Stack choice is a stage decision, not a feature decision.
Sub-€1M GMV: Shopify Analytics + GA4 + a Google Sheet is enough
€1M to €5M GMV: layer in Polar or Triple Whale for blended ROAS and contribution margin, accept integration drift, and reconcile weekly
€5M+ GMV: dashboards alone stop scaling, and decisions stall
Most analytics tools added AI. We are AI. Luca AI reads across Shopify, Meta, Google, Klaviyo, Stripe, and Xero, then answers 'what changed and why' in plain English. We add scenario simulation, root-cause analysis, outlier alerts, and scheduled push reports to Slack and email, which dashboards do not. For a side-by-side, our breakdowns of Triple Whale alternatives and the wider ecommerce analytics platforms landscape make the trade-offs explicit. The frontier of analytics by 2026 is reasoning, not more charts.
When should we take working capital, and how do Wayflyer, Clearco, 8fig, and Luca compare?
Capital is correct only when three conditions hold: a campaign or SKU has proven unit economics, the cash-conversion cycle is under 60 days, and the cost of capital is below the projected contribution margin. If any breaks, fix the cycle first.
We compare providers on five metrics:
Effective annualised cost: Wayflyer 12 to 24% APR, Clearco 35 to 40% APR, 8fig variable
Disbursal time: Luca under 24 hours, Wayflyer 24 to 48 hours, Clearco days to weeks
Sizing logic: most providers push to maximum advance, we size to actual need
Repayment structure: revenue-share vs cycle-gated
Personal guarantee: UCC filings are common, ours has none
Read the head-to-head in Luca AI vs Wayflyer, and the alternatives roundup in Clearco alternatives. Dynamic, health-based pricing flips the incentive away from oversized advances.
Enjoyed the read? Join our team for a quick 15-minute chat — no pitch, just a real conversation on how we’re rethinking Ecommerce with AI - Luca
Loading Schedule...
Your AI Co-Founder is here.
Here’s why:
Shopify, Meta, Xero - one brain.
"Should I scale?" Answered with real data.
Growth capital. No applications. One click.
Thank you! Your submission has been received! Please book a time slot for the Meeting
Oops! Something went wrong while submitting the form.
.svg)
.svg)


.svg)
.webp)

.png)
