.svg)
.svg)

Q1. What exactly is predictive analytics for ecommerce (and what is it not)? [toc=1. What It Is]
Predictive analytics for ecommerce is using your store's own historical data to forecast a specific future number: next quarter's demand per SKU, which subscribers will churn in 30 days, or what a January cohort is worth in 12 months. It is not a crystal ball, and it is not generic AI guessing. It is pattern extrapolation. History rhymes, and a model reads the rhyme faster than you can.
📊 Where it sits among the four analytics types
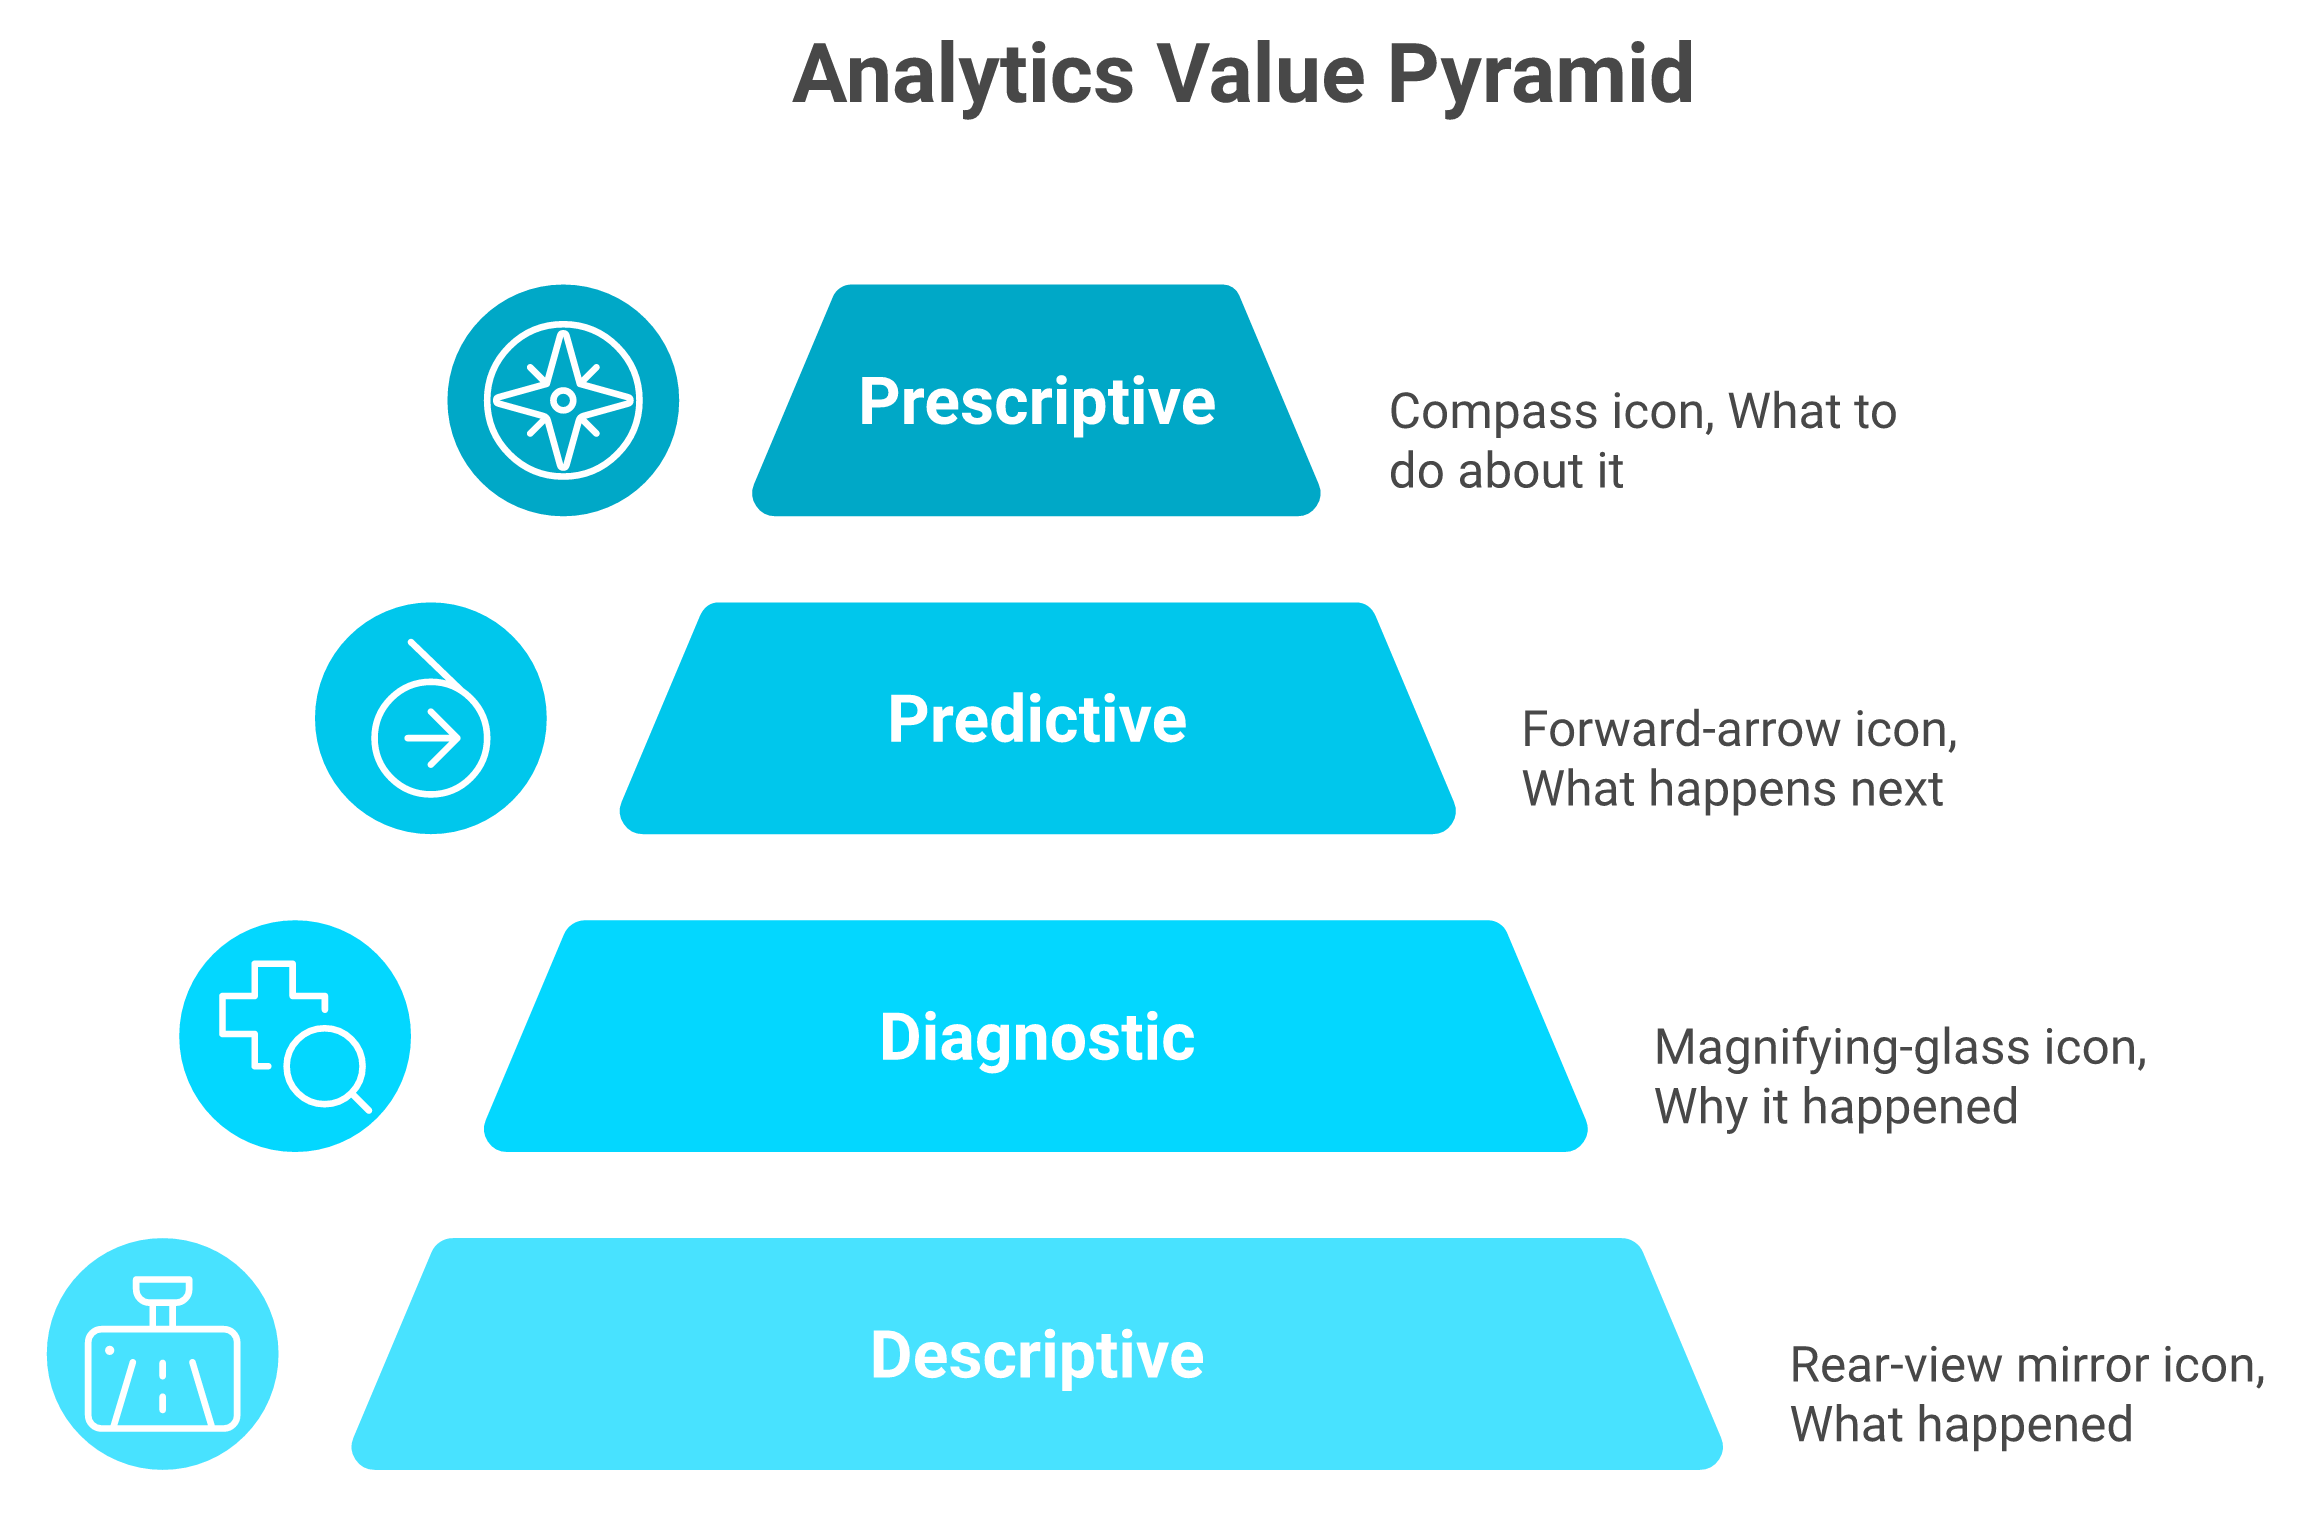
You already know the four buckets, so I will be quick. Descriptive tells you what happened. Diagnostic tells you why. Predictive tells you what happens next. Prescriptive tells you what to do about it. Most tools you have used live in the first two buckets. Predictive is where the money moves, because a forecast you trust changes the check you write this week.
Here is the part vendors skip. A predictive model does not invent the future. It finds the patterns already sitting in your sales, your lead times, and your customer behavior, then projects them forward. This is the kind of reasoning our data analysis and deep industry research capability was built around.
⚠️ What it is not
It is not magic, and it breaks when conditions break. Feed it three years of steady data, then launch into a new country or double your price, and the forecast gets shaky because the past stopped rhyming. That limit is real, and honest operators respect it.
There is also a line machines do not cross. As one practitioner put it bluntly, machines can forecast demand and purchasing quantities but cannot replicate buyer intuition. My read: predictive analytics handles the math of what is likely. You still own the judgment call on what is right. If you want the fuller picture on why operators struggle here, we wrote about why e-commerce founders are drowning in data.
Q2. Where does predictive analytics actually make or save you money, department by department? [toc=2. Use Cases That Pay]
Predictive analytics pays off in four places: inventory (forecast sell-through per SKU so you stop the stockout-then-overstock whipsaw), retention (flag the subscribers about to churn while you can still save them), finance (know your landed net margin before you commit cash), and acquisition (predict cohort LTV so you know your true allowable CAC). Each one is a number you can act on Monday, not a dashboard you stare at.
📦 Inventory: stop guessing on the buy
This is where your cash is most exposed, so it goes first. Buying blind is brutal: one denim brand described a single style needing sizes 23 to 32 in two stores, a $6,000 commitment per style before a single unit sells. Multiply that across a catalog and a bad guess can sink a quarter.
A sell-through forecast per SKU turns that guess into a reorder point. One operator told the story of feeding a full year of sales by product into an AI and getting back a slotting plan in minutes, what goes on the first shelf, what goes at hip height, what stays in the back room, work that used to eat a month. This is core to how we think about product management.
🔁 Retention: save the subscriber before they cancel
Churn is quiet money. You do not feel it leave, you just notice growth stalling. A churn model flags the at-risk subscriber while you can still intervene with a skip, a swap, or an offer.
Anthony Mink of Live Bearded made this concrete, setting an agentic AI a goal to pull churn from 13% down to 8%. That is not a vanity metric. On a subscription base, a five-point churn drop compounds into real cash every month. We dig deeper into this in our guide to agentic AI for ecommerce founders.
💰 Finance and acquisition: know the number before you spend
On finance, the win is knowing your landed net margin before the cash leaves. On acquisition, it is predicting cohort LTV so you know your true allowable CAC, instead of scaling spend on a hope. If unit economics are the gap, start with the best way to track e-commerce unit economics.
I think about channel exposure the way a hedge fund thinks about asset allocation. Concentrate too hard in one channel or one hero SKU, and you are overweight a single risk. This is also where Luca crosses from marketing into operational forecasting, anticipating CS ticket spikes, seasonal staffing, and vendor pre-market performance, so one layer covers all four departments instead of four separate tools, which is the whole point of our financial management approach.
"I never had a problem with SellersFi. But with Uncapped. A major one... they ONLY accept a connection to the bank account at my local credit union, the one they can't connect to due to technical problems."
Volker Foerster Uncapped Trustpilot Verified Review
That receipt is a reminder: a forecast is only as good as the data plumbing under it. If the connection breaks, the prediction breaks.
Q3. Build it yourself or buy a tool, which path is actually right for your store? [toc=3. Build vs Buy Decision]
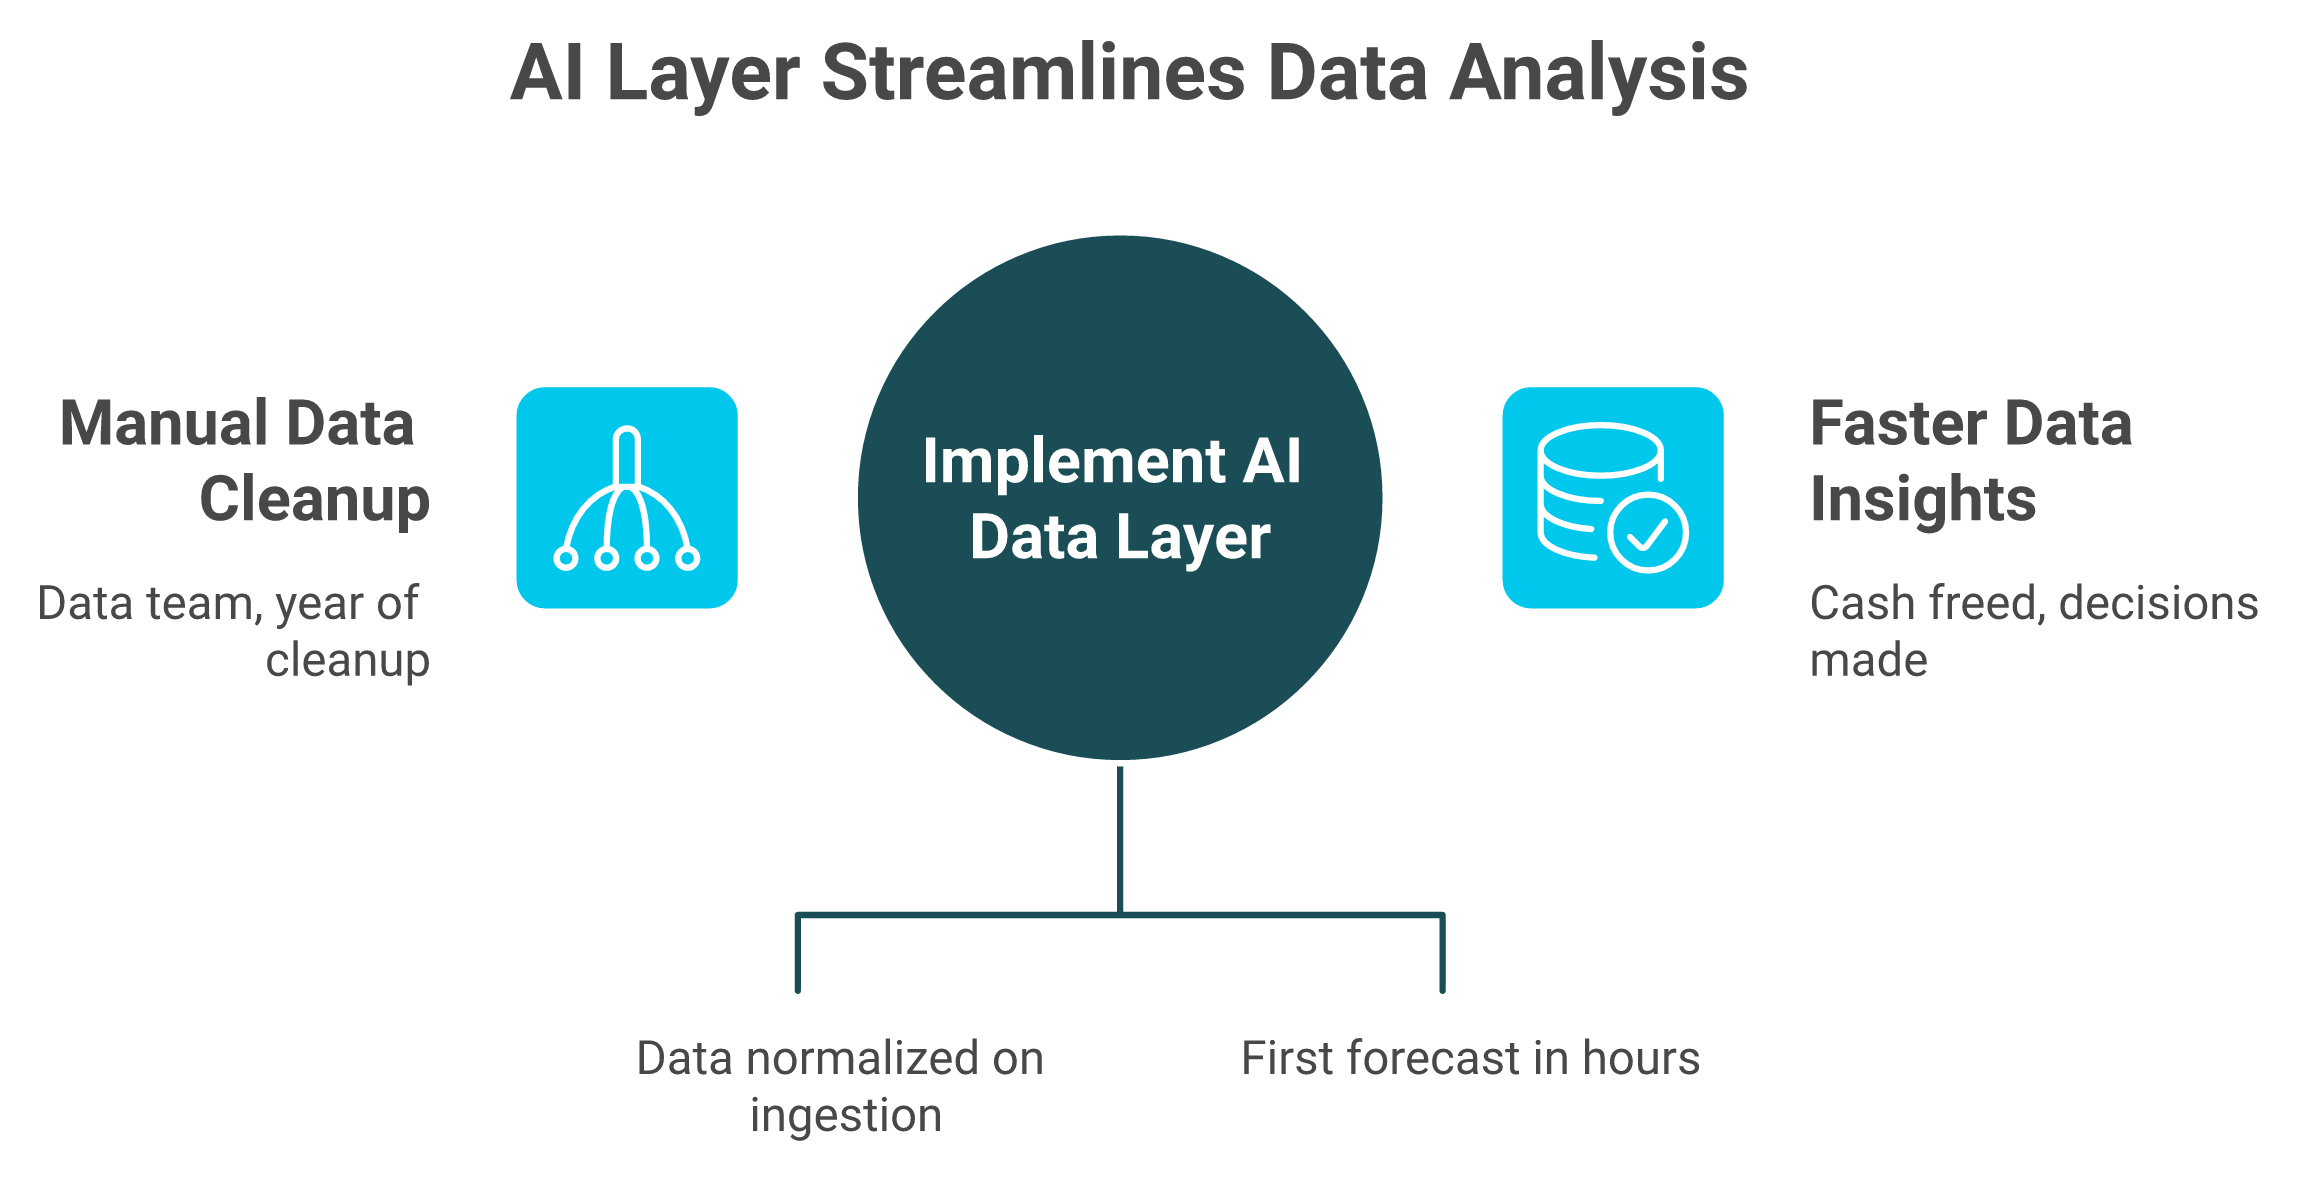
You have two roads, and "buy" splits into two. Build the traditional way (collect, ingest, normalize, and model the data, which means a team and a cleanup year). Buy a point tool off a list. Or use an AI layer on your existing data and skip the cleanup. Below roughly $1M, you usually cannot justify a build. In the messy multi-channel middle, an AI layer wins. Only enterprises with real data teams should build from scratch.
🛠️ The three paths, side by side
| Path | Rough cost | Time to first forecast | Who maintains it | Who it fits |
|---|---|---|---|---|
| Build traditional stack | Data hire(s) plus tooling | Months | You / your team | Enterprise with a data team |
| Buy a point tool | $100 to $1,000+/mo | Days to weeks | Vendor | Single-job, single-channel needs |
| AI layer (e.g., Luca) | Subscription | Hours | Vendor | SMB / mid-market, multi-channel |
⚖️ My honest take per stage
Building from scratch made sense five years ago. It rarely does now. Ari Tulla rebuilt his company's data platform on an LLM-native stack after spending eight figures the old way, and his takeaway stuck with me: LLMs "are 10 times better than you can be even after spending $10 million." That is the credibility tax of the build path in 2026.
A point tool fits when you have one narrow job on one channel. An AI layer fits the messy middle, because it normalizes your data on ingestion and you skip the cleanup year entirely. Plug in, ask, act. Jen Van Wart walked away from $3,000-a-month consultants once AI could do the analysis directly, and that math is getting harder to argue with. We compare the broader options in our roundup of ecommerce analytics platforms.
"We end up reverting back to direct data sources like Meta, Shopify, Recharge, etc."
Matt Huttner Triple Whale Trustpilot Verified Review
When a bought tool fails, you do not just lose the tool. You lose the hours triangulating around it. That cost belongs in your e-commerce tech stack math.
Q4. If you buy: which predictive tools are worth it, and which reviews should scare you? [toc=4. The Buy Path: Tools]
If you buy a point tool, match it to the job. Inventory forecasting: Inventory Planner or Cogsy. Cohort LTV and blended reporting: Triple Whale or Polar. Attribution stays a separate pixel. But read the receipts first, because operators report broken integrations, fake attribution, surprise 12-month contracts, and support that vanishes after the sale. Buy the job, not the demo.
🧰 Match the tool to the job
| Job to be done | Common point tools | What to check before you sign |
|---|---|---|
| SKU demand / inventory | Inventory Planner, Cogsy | Does it reconcile to your raw Shopify numbers? |
| Cohort LTV / reporting | Triple Whale, Polar | Contract length, attribution accuracy |
| Channel attribution | A dedicated pixel | Treat as separate, not bundled |
This is the one warning I will repeat: do not let the AI be your QA. Validate every forecast against your raw source before you trust it. The cautionary tale that sticks with me is a brand that let unvetted AI publish a $20,000 bike with the rear derailleur superimposed on the front wheel. If the inputs are not checked, confident wrong output is the result. For a deeper teardown, see our take on the best e-commerce analytics tools that fund your campaigns.
⚠️ The receipts that should make you pause
The accuracy risk is not theoretical. Read these before you wire money.
"Daily revenue totals are wrong, entire order blocks are missing... Triple Whale shows orders from external marketplaces as if they were real conversions... Completely fake data."
XTRA FUEL Triple Whale Trustpilot Verified Review
"I never signed anything... Only weeks later I found out that I'm locked into a contract until April 2026."
Max Emanuel Gruber Triple Whale Trustpilot Verified Review
"The sampling is increasingly wild, and now it applies a threshold... To make decisions based on grounded data, it is really difficult to trust it 100%."
Verified User in Retail Google Analytics G2 Verified Review
Here is the category line that matters. Most analytics tools added AI on top of a dashboard, and they still hand you wrong numbers. Luca is AI from the ground up, normalizing data on ingestion and reasoning across sources, which is a different starting point than bolting a chatbot onto a broken integration. You can see how that plays out across our use cases.
Q5. If you build: how do you go from raw data to a forecast you can trust? [toc=5. The Build Path: Pipeline]
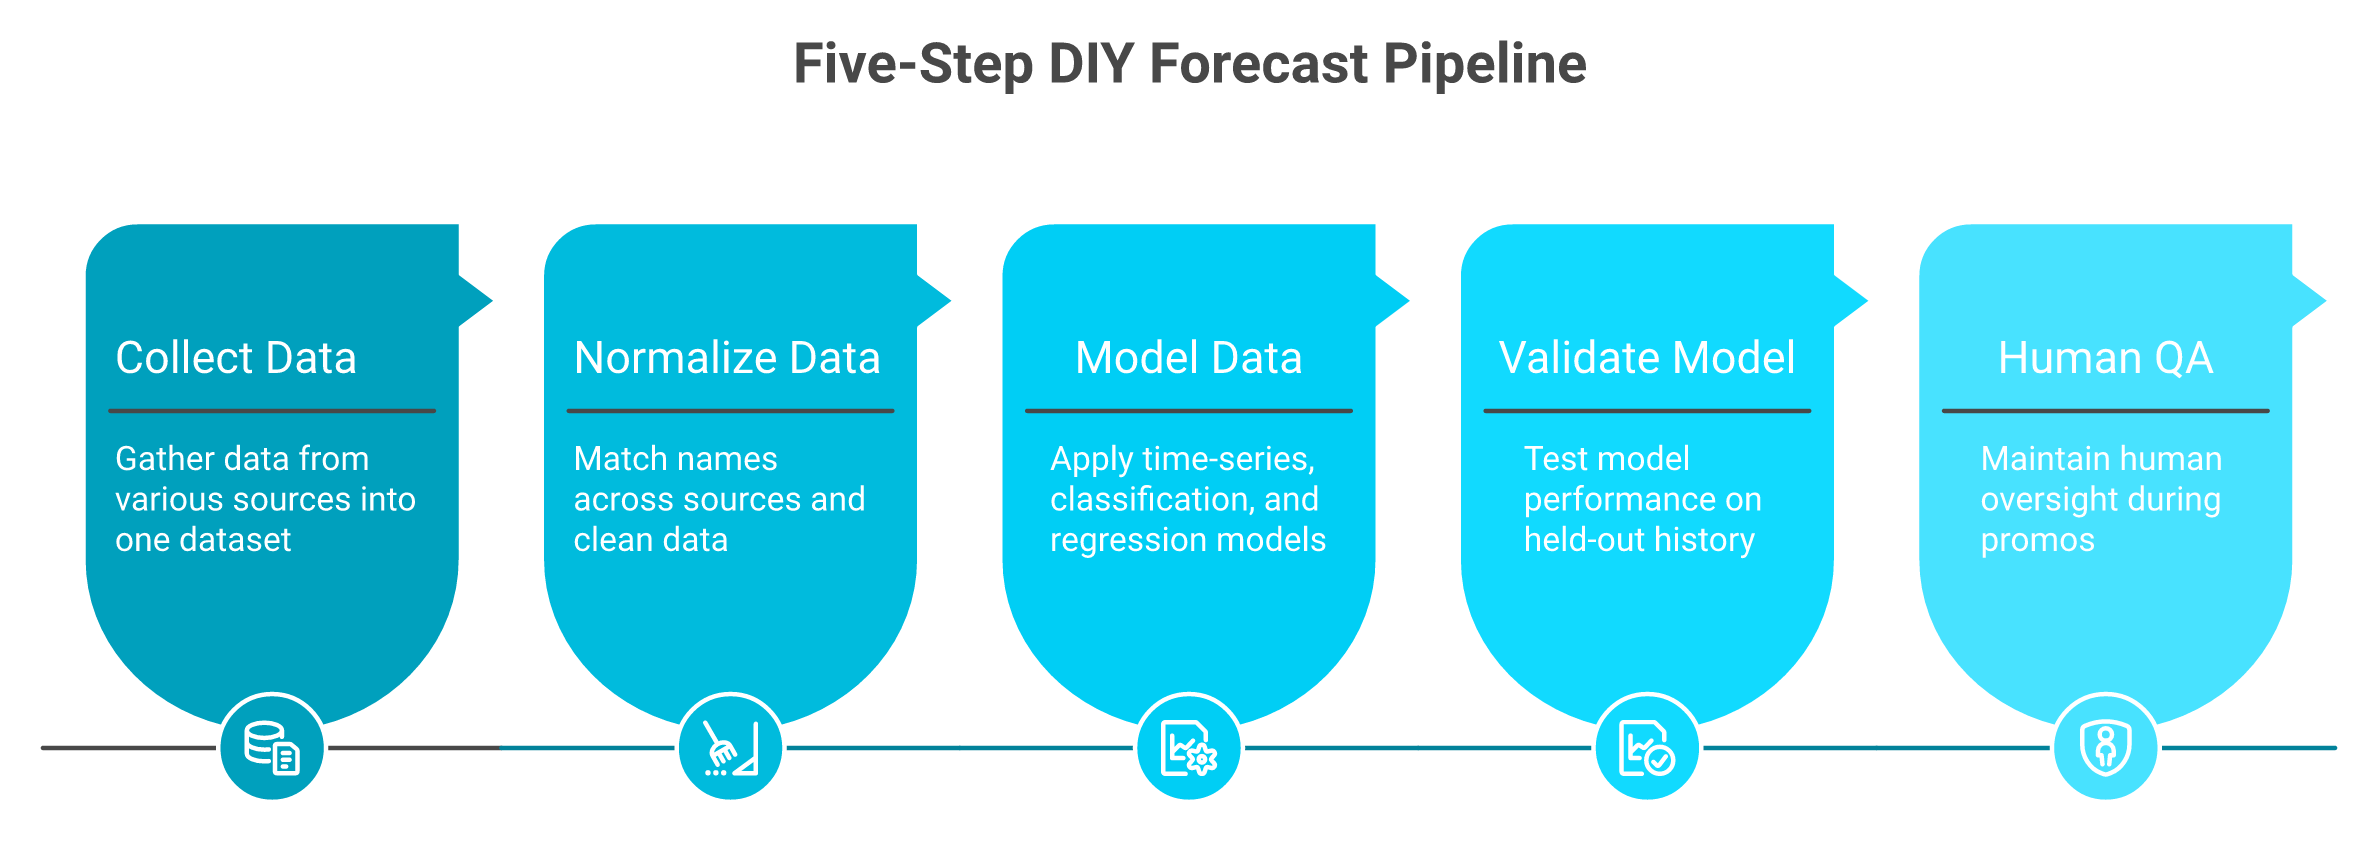
Building a forecast is five steps: pull the data (orders, SKUs, ad spend, returns, and lead times), normalize it (the part nobody warns you about), pick a model to fit the question (time-series for demand, classification for churn, regression for LTV), validate against held-out history, then put a human on the QA. Most DIY projects die at step two, the cleanup year.
🗂️ Steps 1 and 2: collect, then survive normalization
Step one is pulling everything into one place: orders, SKUs, ad spend, returns, and supplier lead times. The output is a single dataset. The trap is that it lives in twenty exports.
One operator described the early days as "so Excel based," running the whole business on manual exports from Shopify and the returns system every week. That is the before-state, and it is exactly why so many founders end up drowning in data.
Step two is normalization, and it is where most builds quietly die. Names do not match across sources. A merchandiser put it well, pointing at "simple things around retail weeks 554, 332" that were non-standard across every brand he touched. The output you want is clean, matched data. The trap is that this alone can eat a year, a cost worth weighing against your full e-commerce tech stack.
🧮 Steps 3 to 5: model, validate, then keep a human on it
Step three is picking the model to fit the question. Use time-series for demand, classification for churn (will they cancel, yes or no), and regression for LTV (a predicted dollar value). The output is a forecast. The trap is using one model for everything.
Step four is validation against held-out history, meaning you test the model on data it never saw. One tactical tip: compute lead times on the median, not the mean, so a single late container does not poison your average. This discipline matters most when you are forecasting cash flow for e-commerce.
Step five is human QA. Do not let the model run unsupervised during promos. Carrie Lamb, a CMO, leans on AI but keeps her own hand on Google Ads bids because the model lacks her business context. That instinct is correct.
Here is the honest tax. Done right, this is months of work and probably a hire. That is exactly why an AI layer like Luca exists. It normalizes data on ingestion, which collapses steps one through three, and it is the thinking behind our agentic AI for ecommerce founders. If you do not want to live the cleanup year, that is your fork in the road.
Q6. How do you run this on your stack, Shopify, WordPress, marketplace, or multichannel? [toc=6. Tailoring By Platform]
Your platform changes your first move. On Shopify, native predicted-spend and RFM get you started today. On WordPress and WooCommerce, you wire your own pipeline or a layer. On Amazon and marketplaces, you forecast on platform-fed data and rented visibility. Multichannel is the hardest and the highest-payoff, because nobody's dashboard agrees until you unify the sources first.
🛍️ Shopify and WordPress: where your data already lives
If you are on Shopify, you have a head start. Native predicted-spend and RFM (recency, frequency, monetary) segments give you a usable first forecast today, no build required. The trap is stopping there, since native tools see Shopify and little else, which is why we compare the wider field of best Shopify analytics apps.
On WordPress or WooCommerce, the data is yours but the plumbing is not built for you. Your fastest path is wiring a pipeline or dropping a layer on top. The trap is underestimating the connector work, a recurring theme in our look at ecommerce website analytics.
🌐 Marketplace and multichannel: the unification game
On Amazon and other marketplaces, you forecast on platform-fed data and rented visibility. You get demand signals, but you do not own the customer relationship, so churn and LTV work is limited.
Multichannel is where the real money and real pain sit. When five sources disagree, the whole game is unifying them before you forecast. The failure mode is concrete. One operator watched a tool multiply inventory across stores, showing six times the real stock. Connecting Shopify, Meta, Google, Klaviyo, accounting, and your 3PL into one normalized source is exactly the job Luca was built for, which is why multichannel is where our sales performance work earns its keep.
"Polar reported our inventory multiplied across stores... it took a month and a half and it's still not fully resolved."
Maja Polar Analytics Trustpilot Verified Review
A founder I respect described the after-state perfectly. A new customer in South Africa, and "in 5 minutes I know what my bottom line net profit is going to be," where before it took an expert and two days. That speed is the multichannel payoff.
Q7. How do you turn a number into an insight you can act on, not just another dashboard? [toc=7. From Data to Decision]
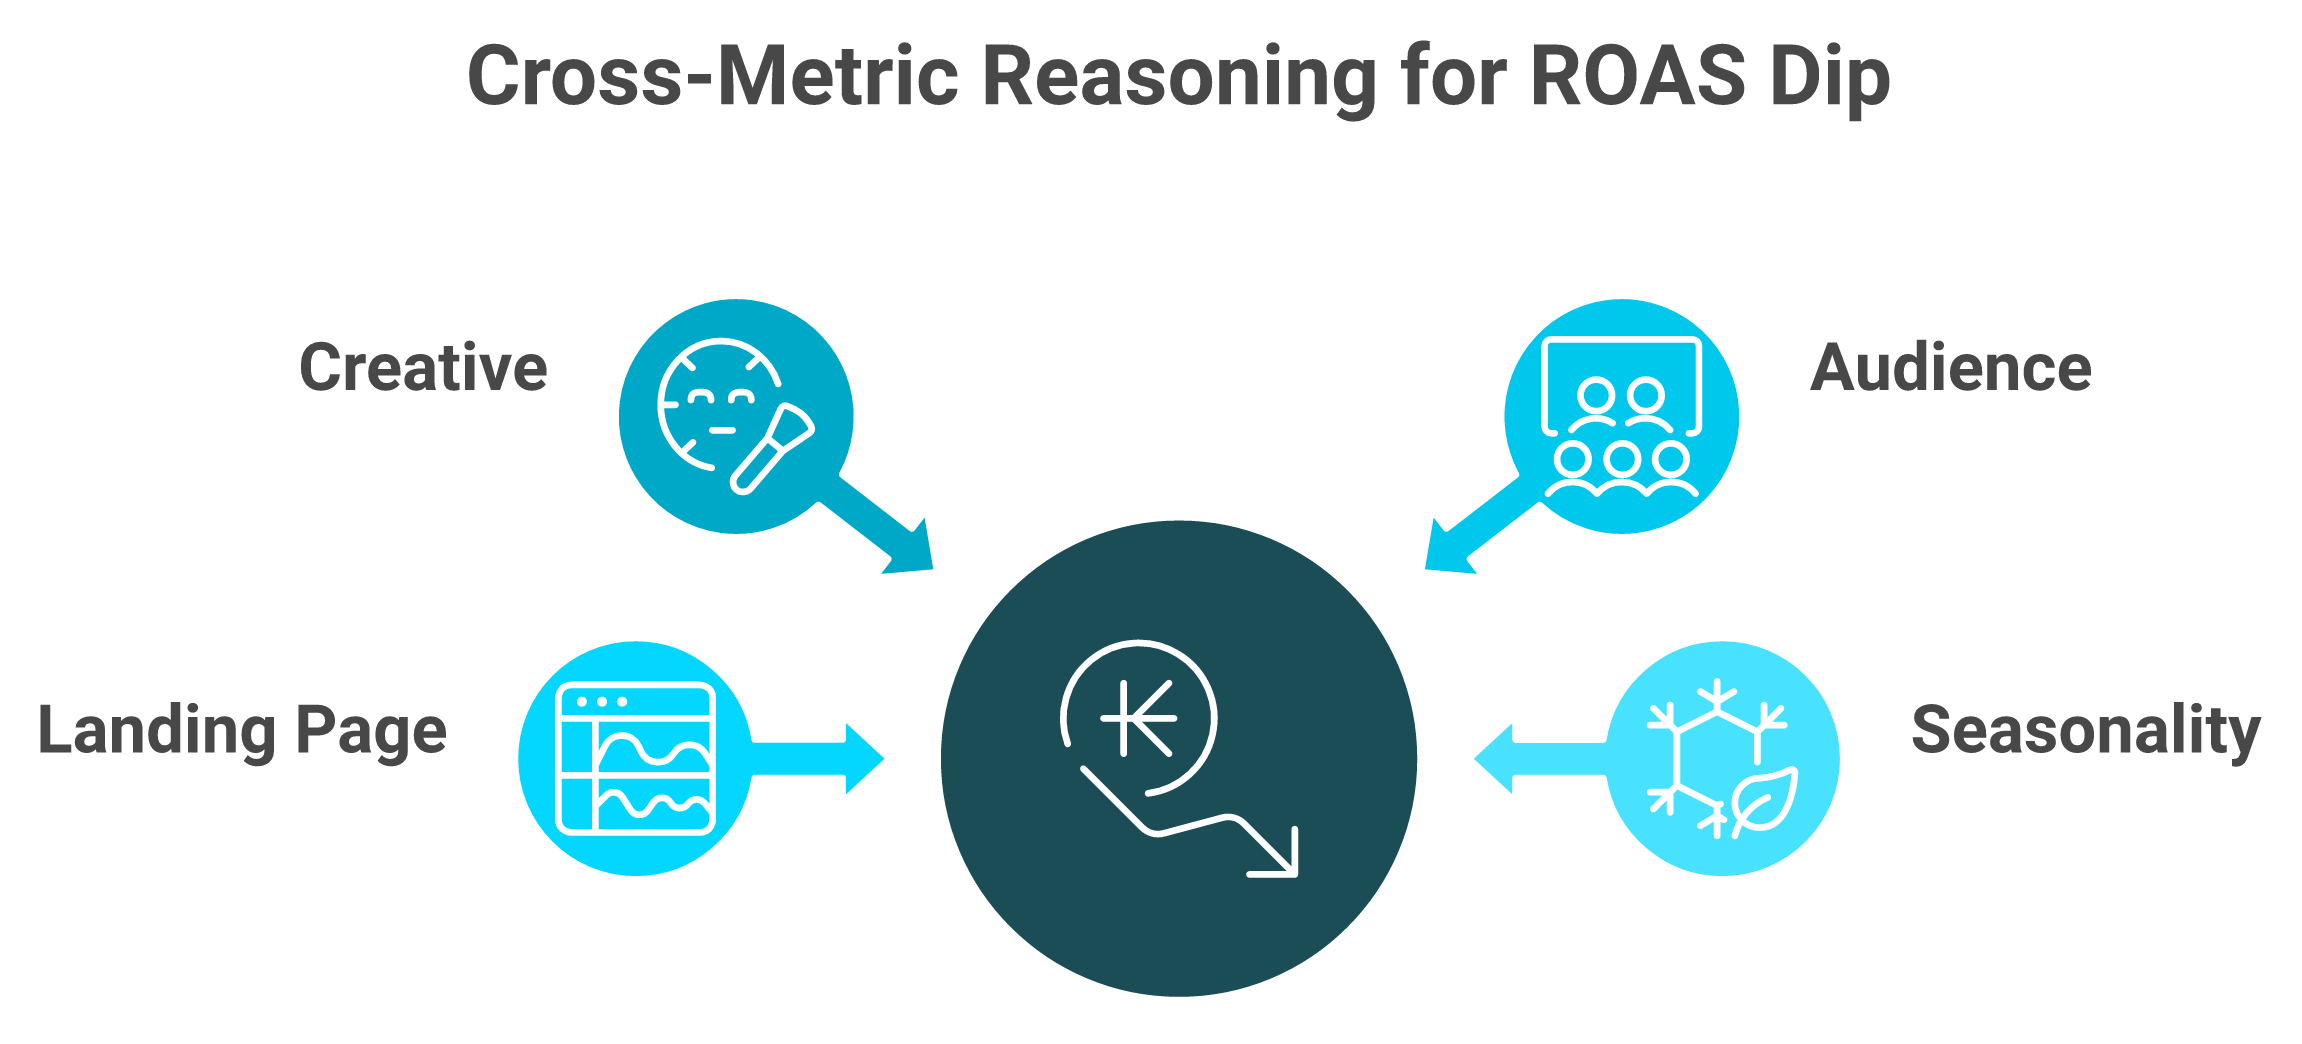
A forecast number is useless until it answers "so what do I do?" The skill is reasoning across sources. ROAS dipped, but is it the creative, the audience, the landing page, or seasonality? An insight names the cause, the consequence, and the move. That cross-metric reasoning, not a prettier dashboard, separates predictive analytics that makes money from predictive analytics that just decorates a screen.
🔍 A forecast is not an insight
Picture the classic Sunday-night scene. ROAS (return on ad spend) is down 18%, and you are toggling between four tabs trying to figure out why. A dashboard shows you the dip. It does not tell you the cause, which is the gap we cover in declining platform ROAS vs true profitability.
An insight closes that loop. It says the dip traces to a fatigued creative on one audience, the consequence is a 12% CAC rise, and the move is to rotate the ad. The standard read gets this backwards. Operators chase prettier charts when they need better reasoning, the heart of our marketing analysis and automation.
🧠 Reasoning beats reporting
The method is chaining metrics into a cause-and-move, across sources, not within one. This is where most "AI" tools fall short, because they let you chat with a single dashboard. Luca is built to reason across the relationships between metrics, the way a junior analyst would, and it pushes the finding to you instead of waiting for you to ask. We unpack this further in how AI can actually help you run your e-commerce business.
The proof that reasoning matters is what it surfaces that you would never query. Anthony Mink of Live Bearded ran his data and found that buying across three or four product categories, not purchase frequency, was the number-one predictor of lifetime value. His words: "I would have never thought product category diversity was the leading driver."
That is the payoff. You stop triangulating numbers at 11pm on Sunday. The reasoning comes to you, with the cause and the recommended move attached, and your job shifts from finding the problem to deciding on the fix.
Q8. How does Luca's architecture do predictive analytics, and where does it stop? [toc=8. Inside Luca]
Luca connects your sources (Shopify, Meta, Google, Klaviyo, accounting, and 3PL), normalizes them on ingestion so you skip the cleanup year, and reasons over the relationships between ecommerce metrics it was trained on. You ask in plain English, it forecasts, explains, and pings you when something breaks. It does not replace an attribution pixel, and it does not fit pre-data or enterprise-with-a-data-team stores.
⚙️ Ingestion, normalization, and the reasoning layer
The first thing Luca does is the boring thing that matters most. It normalizes and standardizes your data on ingestion, so the 554-versus-332 naming mess gets solved at the door. Plug in, ask, act. You can see the full picture across our use cases.
Then comes the part general AI cannot do well. We trained Luca on the relationships between ecommerce metrics, so it knows how ad spend, CAC, inventory, and churn move together. A generic chatbot guesses at those links. Luca reasons over them, which is the difference between confident hallucination and a grounded answer, the same rigor behind our data analysis and deep industry research.
💬 Plain English, proactive alerts, and capital on its own terms
You talk to it like a person. No SQL, no analyst, and no dashboard-building. Ask for a weekly CAC report with graphs and reasoning, and it arrives in Slack or email on schedule. It scans 24/7 and pings you when ROAS dips or inventory falls below your threshold, so the cohort-level vigilance happens without a cohort dashboard.
Luca also offers capital, and I want to position that honestly, on capital metrics alone. The pitch is not "we also have analytics." It is transparent rates, fast disbursal, and reliable repeat access, because the funding category is full of the opposite. If you are weighing providers, start with our Wayflyer alternatives.
"After being offered funding in writing with specific amounts, repayment terms, and confirmation that the deal was approved, Wayflyer abruptly reversed their decision at the last minute."
Geoff Brand Wayflyer Trustpilot Verified Review
"We signed a 3M loan deal, only for them to come back two weeks later... slashing our funding to 1M. Then, months later... they cut it again to 350K."
Xin Shui Uncapped Trustpilot Verified Review
⚠️ Where Luca stops
Now the honest boundary, because skipping it would cost trust. Luca is not an attribution pixel and does not replace one. It also is not for pre-data stores with too little history to reason against, or for enterprises that already run a full data team. If you are sub-$10K MRR or pure marketplace-only, this is not your tool yet, and I would rather tell you that now. When you are ready, our financial management features are where most operators begin.

.svg)
.webp)

.png)
