.svg)
.svg)

Q1. What is ecommerce performance analytics, really, and why are you "profitable on paper, broke in reality"? [toc=1. What It Is]
I watched a founder named Maya open her Monday dashboard last quarter. Revenue was up 8%. She smiled, then went quiet. "So what do I actually do with this?" she asked. The dashboard had no answer.
That gap is the whole problem. Most stores own dashboards that describe the past but never tell you the next move.
Ecommerce performance analytics is the practice of turning raw store, ad, and finance data into grouped, decision-ready scorecards (Funnel, Margin, and Retention) that tell you what to do next, not just what happened. Most dashboards stop at description ("revenue up 8%"), leaving operators profitable on paper but broke in reality. They never expose the eight costs hiding between a supplier invoice and the cash that actually lands in your bank.
📊 Description is not decision
Here is the trap. A dashboard says revenue climbed. It does not say which product quietly bled cash to get there. You feel busy and informed, yet your bank balance disagrees with your charts.
I call this the Monday morning Excel shudder. You open the sheet, get hit with a torrent of numbers, and still cannot name your single best move. Real operators feel this distrust in their gut, and the reviews back it up. This is exactly why so many e-commerce founders are drowning in data.
"To make decisions based on grounded data, it is really difficult to trust it 100% and it complicates decision-making."
Verified User in Retail, Mid-Market Google Analytics G2 Verified Review
"But most of all, the data just cannot be trusted. Google Analytics was telling us we had twice as much traffic as we actually do."
Gitai B., Web Analytics Lead Google Analytics G2 Verified Review
🧭 The three-scorecard spine
So I stopped chasing one giant dashboard. I group every metric into three scorecards instead. Funnel tells me if traffic converts. Margin tells me if each order actually makes money. Retention tells me if customers come back.
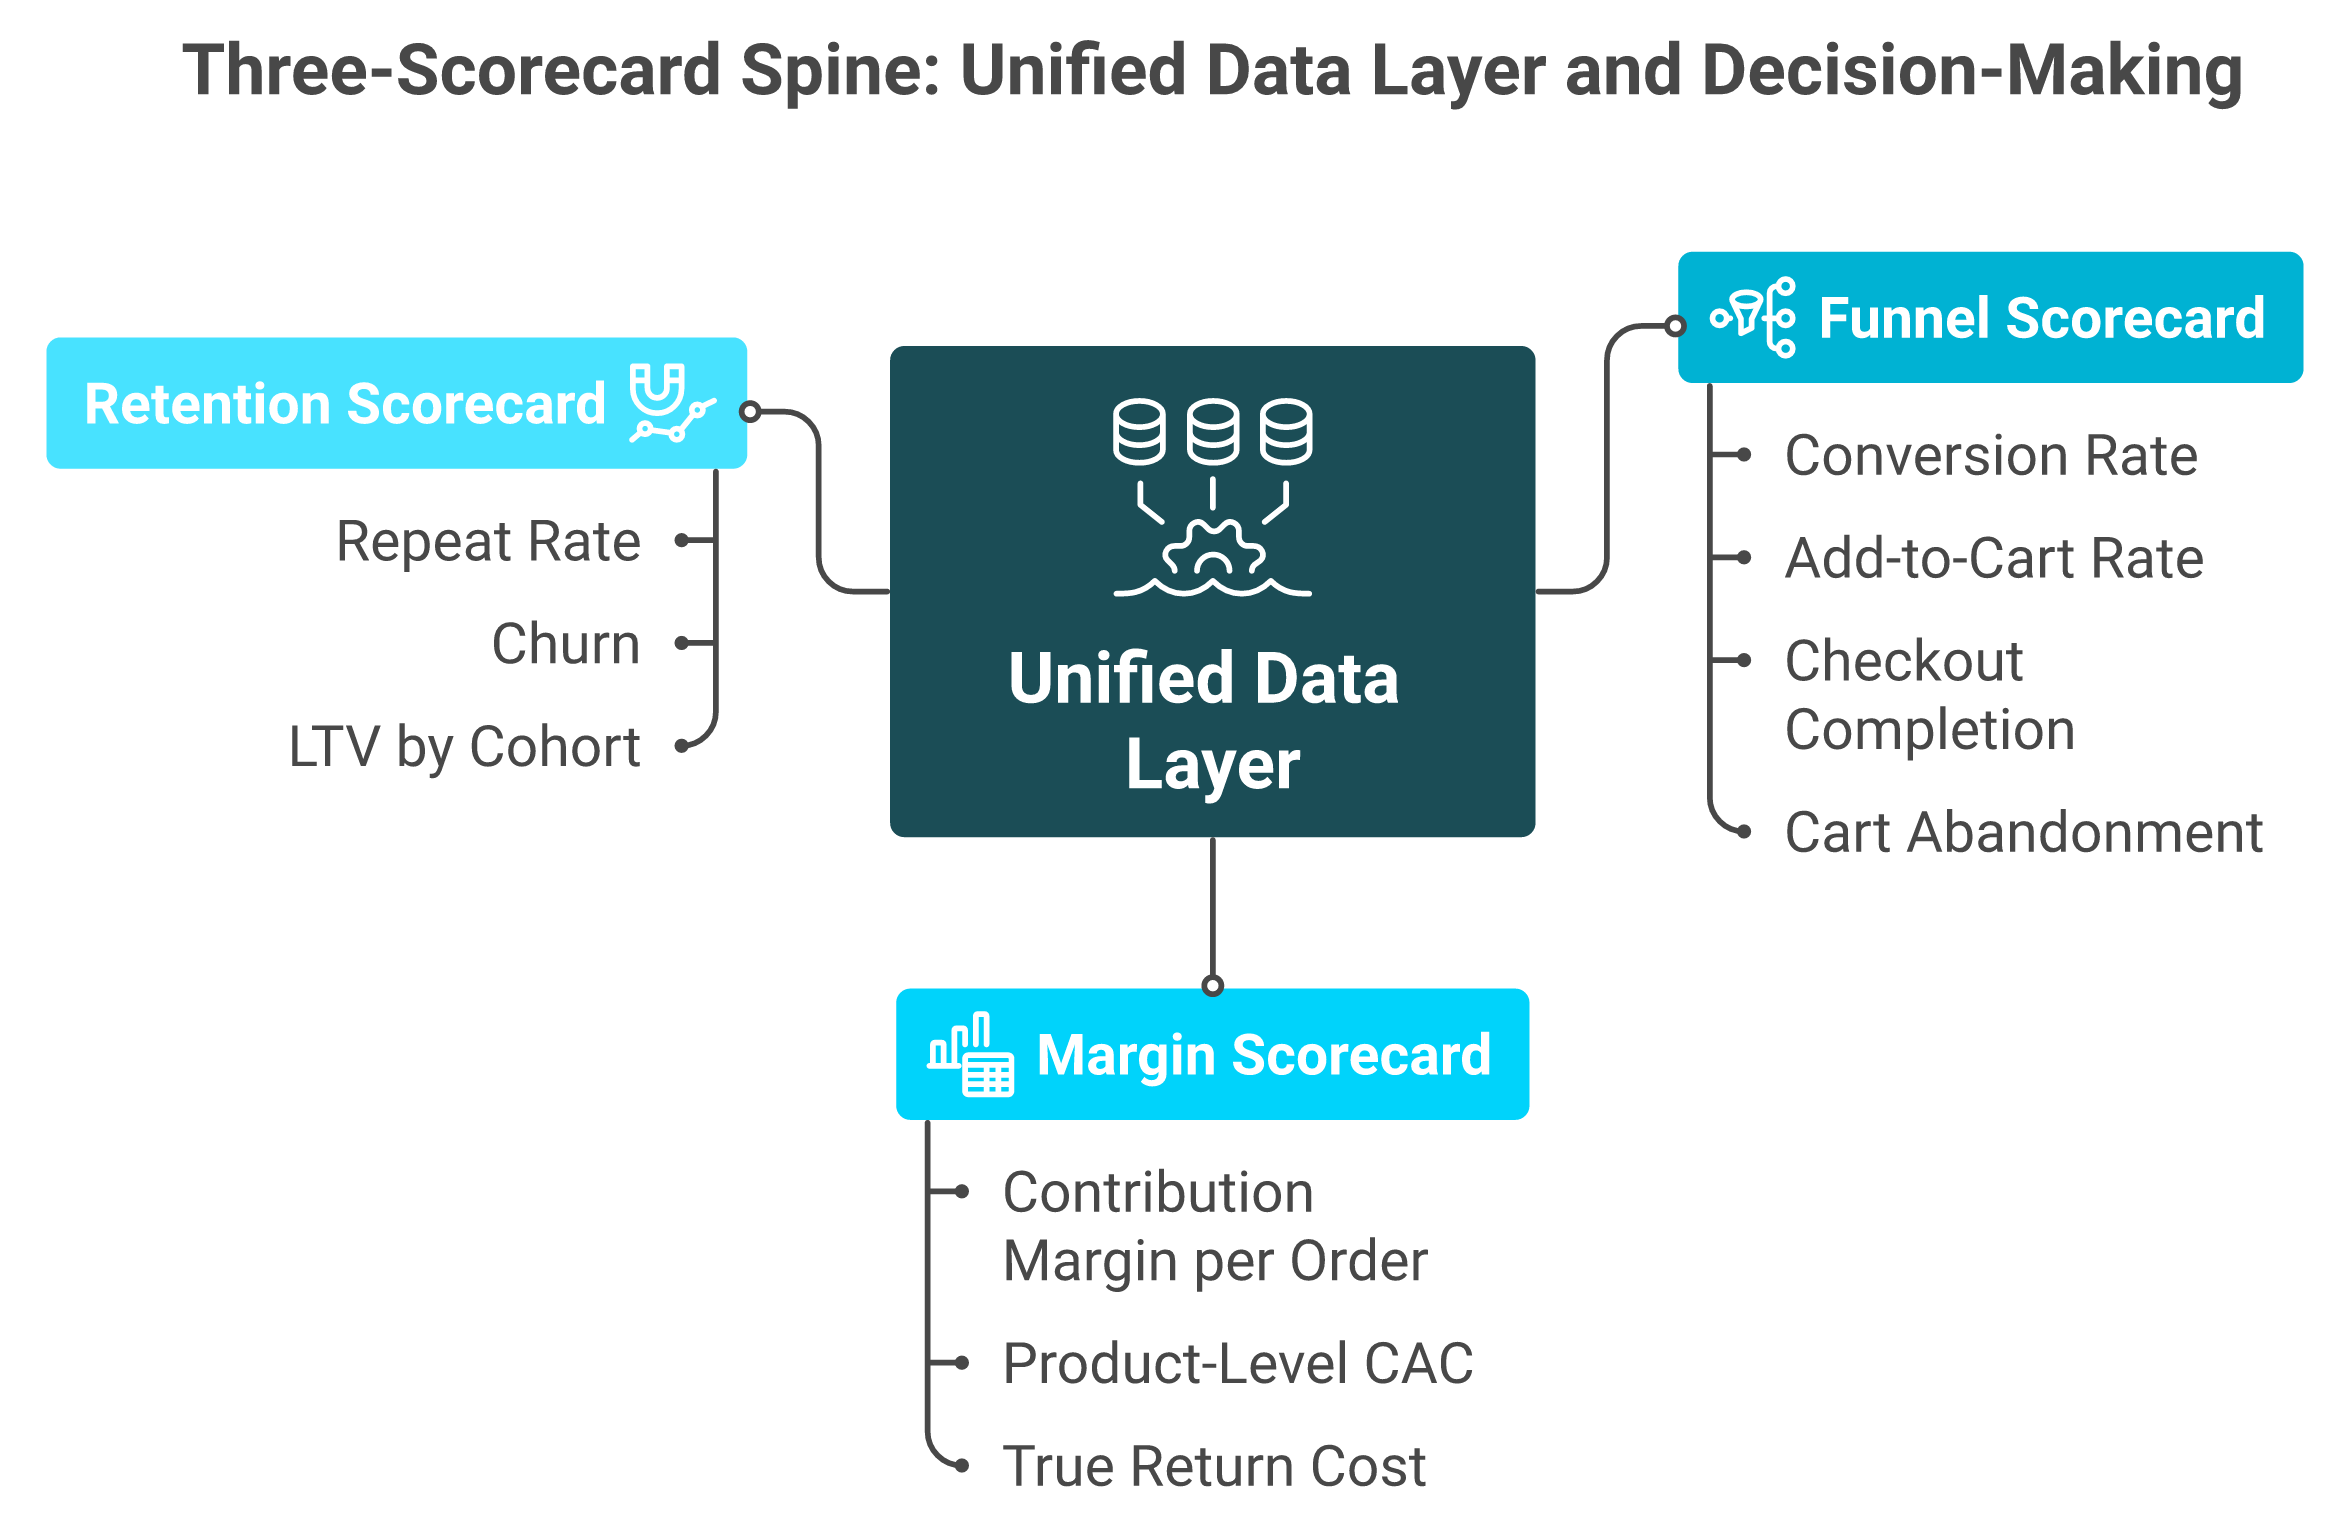
This grouping is the spine of everything that follows in this article. It turns "here is your data" into "here is your decision." A unified ecommerce analytics platform makes that grouping far easier to maintain.
⚠️ The "so what" test
My read right now is simple. If a number cannot change a decision this week, it is a vanity metric. The eight costs between supplier invoice and real profit are where stores quietly bleed, and no surface dashboard surfaces them.
This is the shift Luca was built around. We move operators from descriptive dashboards toward a prescriptive answer to the only question that matters on Monday: so what do I do now?
Q2. Which ecommerce KPIs actually matter, and how do you calculate each one? [toc=2. Core KPIs & Formulas]
A founder doing $400K a month told me he tracked 31 metrics. When I asked which one he acted on last week, he could not answer. That is the real KPI problem. It is not too few numbers. It is too many that change nothing.
The nine KPIs every store must compute are conversion rate (orders divided by sessions), AOV or average order value (revenue divided by orders), CAC or customer acquisition cost (acquisition spend divided by new customers), CLV or customer lifetime value (AOV multiplied by purchase frequency multiplied by lifespan), ROAS or return on ad spend (revenue divided by ad spend), cart-abandonment (1 minus checkouts divided by carts), churn, bounce rate, and CTR or click-through rate. Calculate each one consistently, and the geeky vanity numbers separate cleanly from the ones that move cash.
🧮 Calculate it the same way every time
Consistency matters more than the formula itself. If you change how you count "new customer" each month, your CAC trend is fiction. Pick a definition, write it down, and hold it.
One caution from the trenches. When you average lead times or order values, use the median, not the mean. Eliminate large outliers by basing "average" computations on the median, because one freak $9,000 order can make a mediocre week look great. The best way to track e-commerce unit economics starts with consistent definitions.
📐 The nine formulas and what each really tells you
- ✅ Conversion rate equals orders divided by sessions. Tells you if traffic and offer match. Leading indicator.
- ✅ AOV equals revenue divided by orders. Tells you basket size and upsell health. Leading indicator.
- ✅ CAC equals acquisition spend divided by new customers. Tells you what growth costs. Leading indicator.
- ✅ CLV equals AOV multiplied by purchase frequency multiplied by customer lifespan. Tells you what a customer is worth. Lagging indicator.
- ✅ ROAS equals ad revenue divided by ad spend. Tells you channel efficiency, not profit. Leading, but misleading alone.
- ✅ Cart-abandonment equals 1 minus (checkouts divided by carts). Tells you where checkout friction lives. Leading indicator.
- ✅ Churn equals customers lost divided by customers at start of period. Tells you retention leakage. Lagging indicator.
- ✅ Bounce rate equals single-page sessions divided by total sessions. Tells you landing relevance. Leading indicator.
- ✅ CTR equals clicks divided by impressions. Tells you creative and targeting fit. Leading indicator.
⚠️ Leading versus lagging
Here is the part most guides skip. Leading metrics (CTR, conversion rate, CAC) move first and warn you early. Lagging metrics (CLV, churn) confirm what already happened.
You steer with leading numbers, and you grade yourself with lagging ones. Luca handles the calculation plumbing in plain English, so you can ask "what is my product-level CAC this week" without building a single formula by hand.
Q3. What does "good" look like? Benchmark ranges for ecommerce performance metrics. [toc=3. Benchmarks: What Good Looks Like]
The first question every founder asks after seeing a number is "is that good?" It is also the question almost no top-ranking article answers honestly. Most just define the metric and walk away.
A "good" ecommerce conversion rate sits around 2% to 4%, AOV varies sharply by category, cart-abandonment averages roughly 70%, email churn under 5% is healthy, and new customers typically take about 12 months to break even. Benchmarks are context, not verdicts. Judge your numbers against your category and your margin structure, never against a single universal average.
📋 A working benchmark table
Treat these as guardrails, not grades. A supplement brand and a furniture brand live in different universes.
The 12-month payback number reframes everything. If it takes about a year to break even on a new customer, a "high" CAC is not automatically bad. It is only bad if your margin and repeat rate cannot carry it. Sound cash flow forecasting for e-commerce depends on getting this payback math right.
⚠️ Why a universal benchmark lies
I could be off on the exact ranges for your niche, and that is the point. The standard read treats benchmarks as scorecards. From what surfaces when you actually run this, they work better as direction, not judgment.
Be skeptical of anyone selling a benchmark as a "perfect mathematical algorithm" for your store. There is no magic conversion rate that applies to a candle brand and a mattress brand equally. Context is the whole game.
💰 The stakes behind the averages
The averages also hide brutal odds. A widely cited operator figure suggests a large share of ecommerce businesses fail within their first few months, often because they steer by surface revenue instead of payback math.
This is where benchmarking against yourself wins. Luca compares your metrics against your own historical baseline, not just a generic industry average, so "good" means good for your store, your season, and your margin.
Q4. How do you group those KPIs into Funnel, Margin, and Retention scorecards? [toc=4. The Three Scorecards]
Let me go back to Maya, because her story is the best argument I have for grouping. She slid an invoice across the table and said, "This is our best seller, 72% gross margin." Twenty minutes later she was crying.
We had calculated actual contribution margin, line by line, cost by cost. It came to 8%. She had spent two years scaling a product that was barely breaking even. The data existed the whole time. It was just never grouped into a decision.
Three scorecards beat thirty charts. The Funnel Scorecard groups conversion, add-to-cart, checkout, and abandonment, and its top lever is speed, since a 1-second delay can cut conversions by 7%. The Margin Scorecard groups contribution margin per order, product-level CAC, and the roughly $6.20 true cost of returns. The Retention Scorecard groups repeat rate, churn, and LTV by cohort and category.
🛒 The Funnel Scorecard: does traffic convert?
This scorecard answers one question. Of the people who arrive, how many pay, and where do the rest leak out? Group conversion rate, add-to-cart rate, checkout completion, and cart-abandonment on one screen.
Speed is the highest-leverage lever here. A 1-second delay in page loading can slash conversions by 7%, and navigation should be so intuitive that a first-time visitor finds what they want in under 30 seconds. Homepage dynamic content that adapts to visitor behavior gives that one-to-one feel and lifts the same funnel. Strong ecommerce website analytics show you exactly where that funnel leaks.
💸 The Margin Scorecard: does each order make money?
Maya's 72% was gross margin. It only told her what it cost to make the thing, never what it cost to sell it. The Margin Scorecard fixes that by tracking contribution margin per order.
The true cost of returns alone can hit $6.20 allocated per unit sold, once you add landed cost, storage, pick-pack-fulfill, shipping, payment processing, returns, customer service, and CAC. Group those, and your "best seller" either earns its crown or loses it. This is where disciplined financial management separates winners from cash burners.
🔁 The Retention Scorecard: do they come back?
Most founders obsess over buying frequency. The bigger lever often hides elsewhere. One operator found that anybody who bought body care jumped 50% to 100% in lifetime value, so product-category diversity, not frequency, drove LTV.
That changes the back-end marketing goal. You stop nagging people to rebuy the same item and start transitioning them from one product category into multiple. Track repeat rate, churn, and LTV split by cohort and category to see it. Layering in marketing analysis and automation turns that insight into a working nurture flow.
🚂 Why grouping wins
Think of it like two train tracks, inventory on one side and cash on the other. They have to move in parallel, or you go off the rails. Scattered charts hide the moment the tracks split.
Luca assembles all three scorecards from one connected data layer and ranks the single leak costing you the most this week. As Kunle Campbell put it, doubling traffic only lifted revenue 30%, because growth is cross-functional and a single-metric view misses the synchronicities.
Q5. Why is ROAS a mirage and gross margin "a lie," and what should you steer by instead? [toc=5. Beyond ROAS & Gross Margin]
Most operators worship two numbers. They check ROAS every morning, and they quote gross margin to investors. Both feel like truth. Both will quietly walk you off a cliff.
ROAS and gross margin flatter you. ROAS, return on ad spend, ignores the cost of selling. Gross margin only covers what it costs to make a product, not the downstream costs of selling it. Steer instead by contribution margin per order and blended MER, marketing efficiency ratio, the numbers that predict your bank balance. A "72% gross margin best-seller" can hide an 8% contribution margin.
🪞 Why ROAS does not exist
Here is the contrarian read. ROAS doesn't really exist as a profit signal, and on its own, CTR and ROAS are close to meaningless. They measure ad-account vanity, not money kept. The gap between declining platform ROAS and true profitability is where most stores lose the plot.
That is why any media buyer you trust needs financial competence. They have to see the real impact of ad dollars on profit, not just a flattering multiple inside Meta. The standard read gets this backwards.
💸 Gross margin is a lie
Gross margin only tells you what it costs to make the thing. It tells you nothing about what it costs to sell the thing. The eight costs between the supplier invoice and actual profit are where businesses bleed.
Run the full stack on one order:
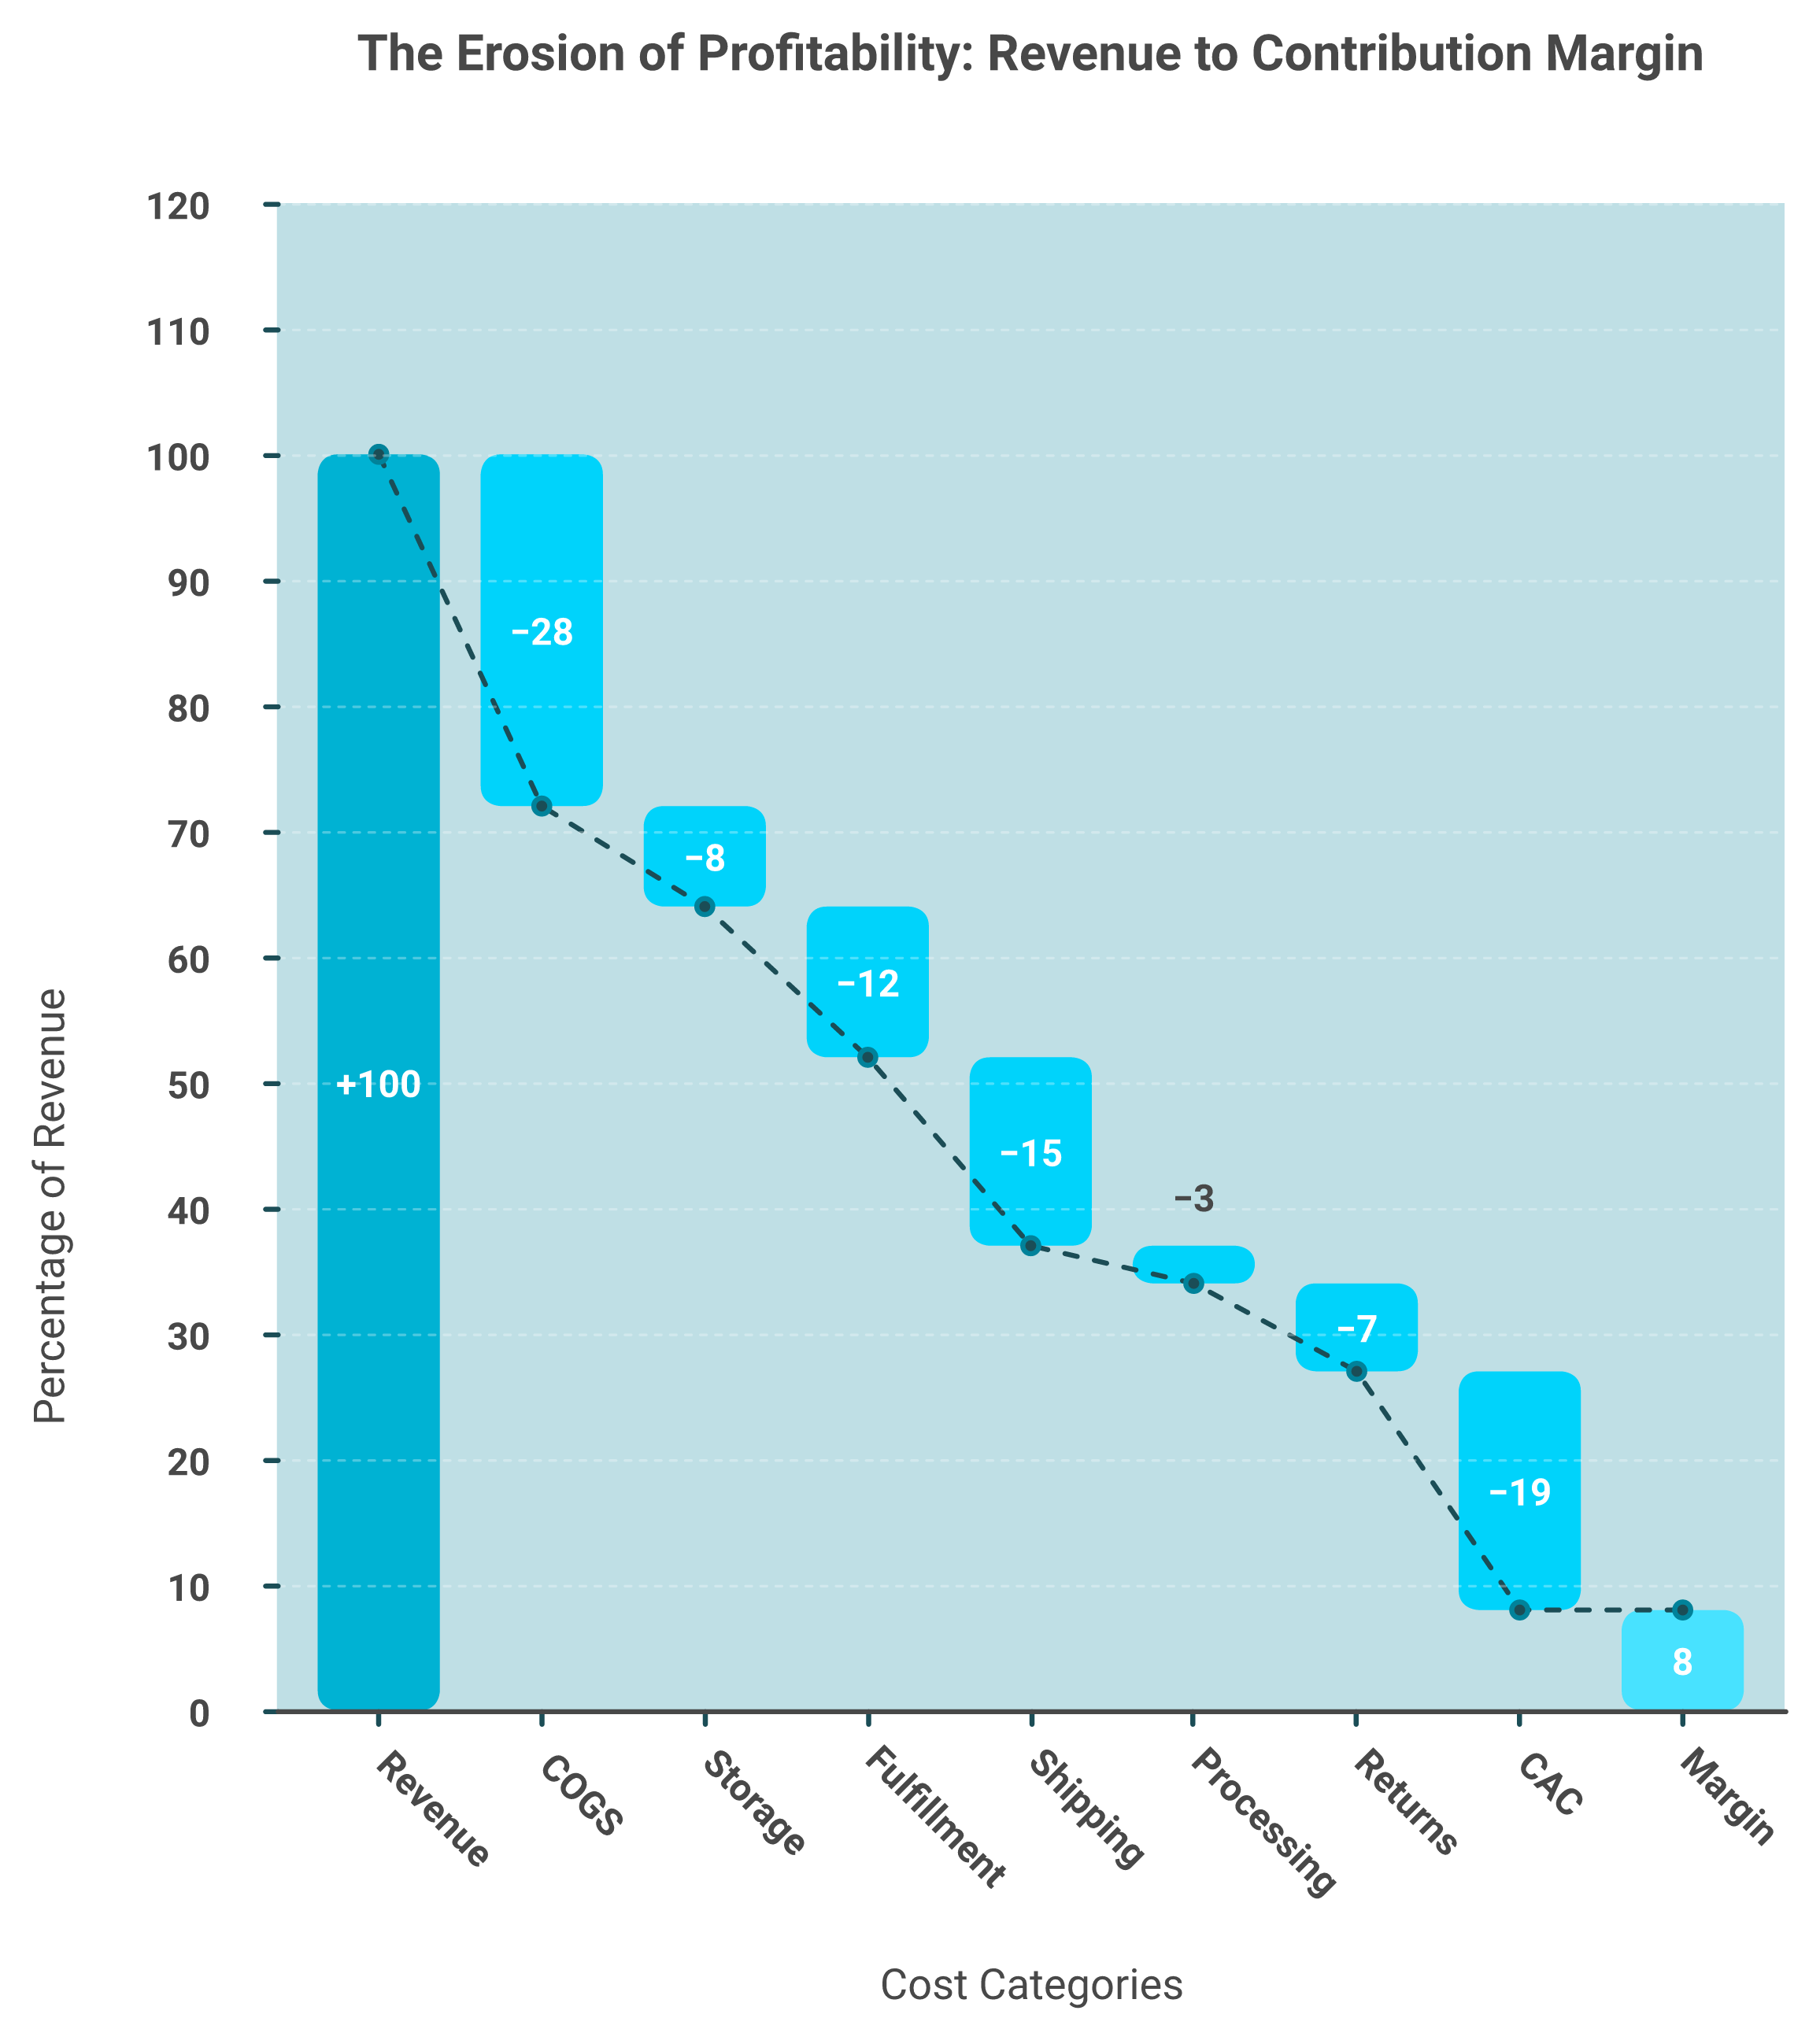
- ✅ Revenue collected
- ❌ Landed cost of goods
- ❌ Storage and warehousing
- ❌ Pick, pack, and fulfillment
- ❌ Shipping
- ❌ Payment processing
- ❌ Returns (often around $6.20 per unit sold)
- ❌ Customer service and CAC
⚠️ The CAC debate, settled
Some people argue CAC, customer acquisition cost, shouldn't sit in unit economics. They call it a marketing cost, not a product cost. My read: if you must spend to acquire a customer to sell that unit, it is a variable cost of that sale. Getting this right is the foundation of the best way to track e-commerce unit economics.
One caution. Do not use blended CAC for product decisions. Track it specifically for that product, or you will miss the audience friction hiding inside one SKU.
🧭 What to steer by instead
Swap your morning dashboard. Lead with contribution margin per order, then blended MER, then profit per order. Drop the "we're just reinvesting our profits" line, because it usually hides the fact that nobody measured the profit.
This is the exact gap Luca closes. Luca computes true contribution margin per SKU by reading your store, ad, and finance data together, so you never scale an 8%-margin product by accident.
Q6. Why don't your dashboards agree, and how do privacy and server-side tracking fix the attribution gap? [toc=6. Attribution Gap & Server-Side]
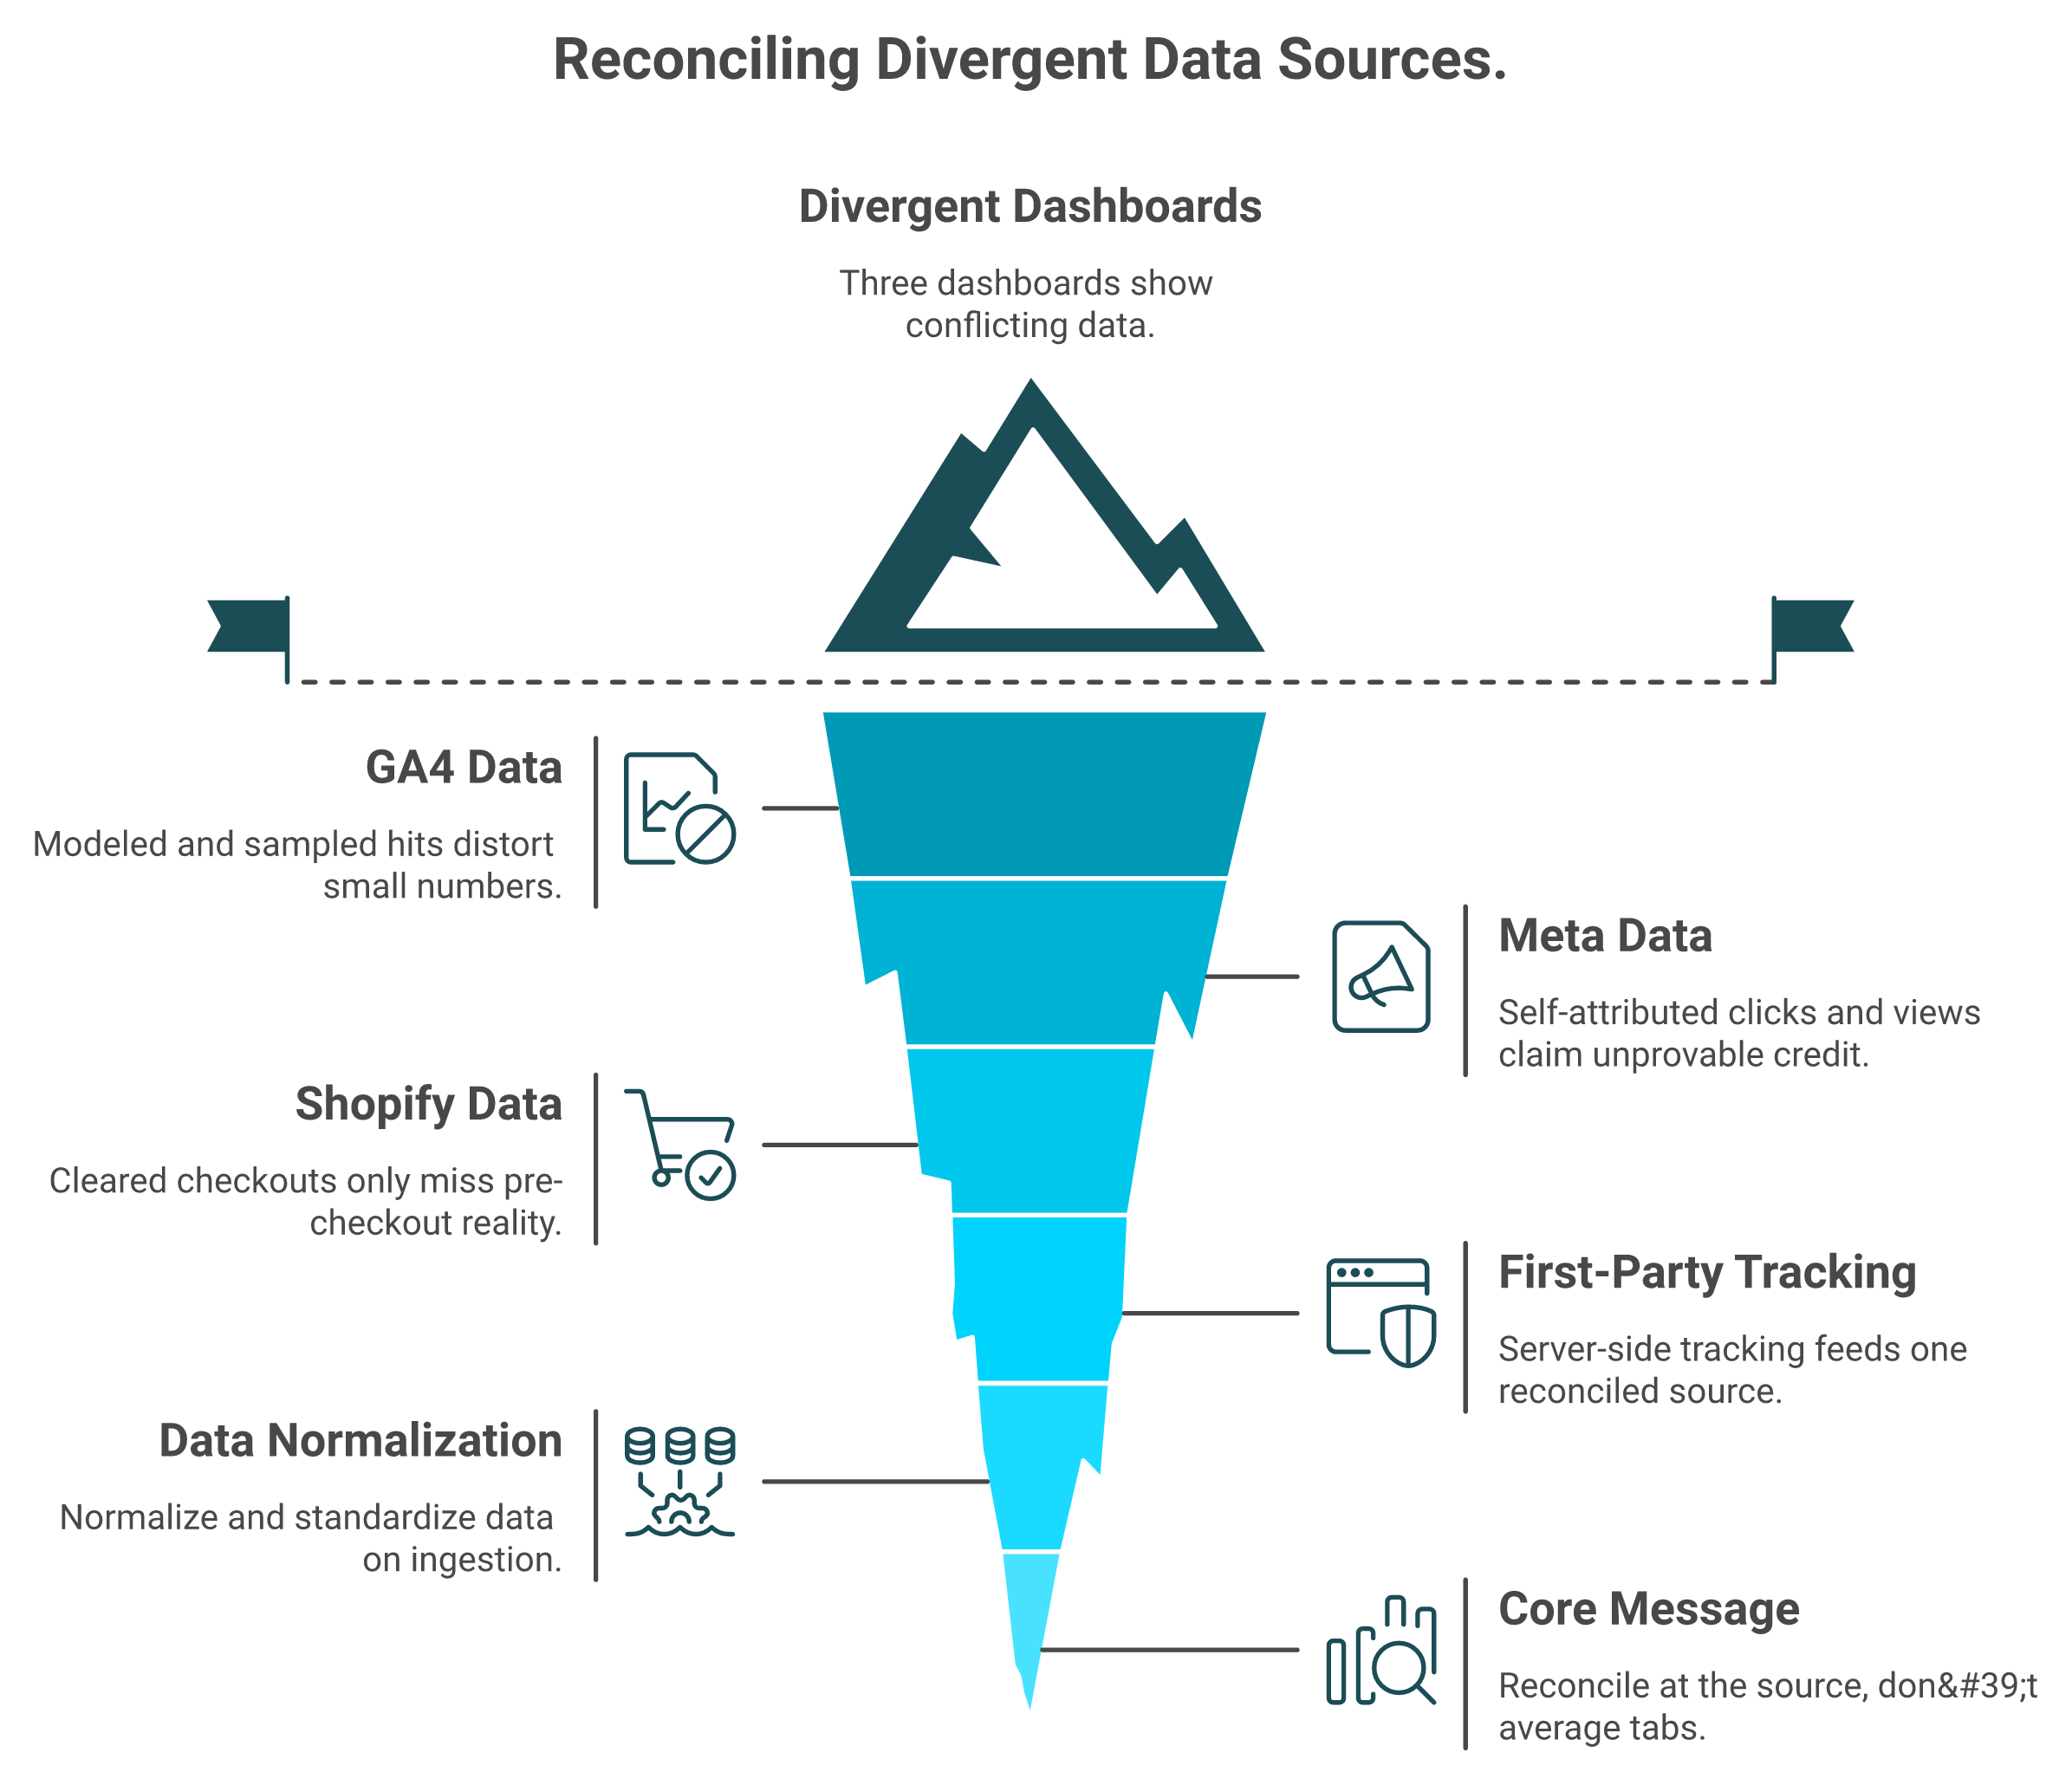
You open three tabs on a Monday. GA4 shows one revenue number, Meta shows a bigger one, and Shopify shows a third. All three claim to be right. You average them by gut and call it a decision.
Dashboards disagree because each measures differently. GA4 models and samples data. Ad platforms self-attribute generously. Shopify counts only cleared checkouts. With third-party cookies fading, the fix is first-party server-side tracking feeding one reconciled source of truth, not three tabs you triangulate by hand.
📊 Why each source tells a different story
The divergence is structural, not a bug you can patch. A clear-eyed look at the leading ecommerce analytics platforms shows the same split every time.
Operators feel this daily, and the reviews are brutal:
"The change to GA4 has been for the worse. There is data loss, for example, sessions do not match the session_start event. It is really difficult to trust it 100%."
Verified User in Retail, Mid-Market Google Analytics G2 Verified Review
"Daily revenue totals are wrong, entire order blocks are missing. Triple Whale shows orders from external marketplaces as if they were real conversions. Completely fake data."
XTRA FUEL Triple Whale Trustpilot Verified Review
⚠️ Bolted-on AI makes it worse
Adding AI on top of dirty data does not fix the data. One operator described built-in forecasting AI bluntly:
"Spinning in circles and telling you it can do things that it can't. AI is a great tool. Sidekick just acts like a tool."
u/uo4hy5m7, r/shopify Reddit Thread
🧱 The real fix: reconcile at the source
The durable fix is first-party server-side tracking plus normalizing and standardizing data on ingestion. Do that, and you skip the data-cleanup year. Plug in, ask, act. A well-built e-commerce tech stack reconciles before it reports.
Luca is an AI layer over your data warehouse. It reads reconciled first-party data and runs root-cause analysis on what's true, instead of inventing conversions from channels that never touched your store.
Q7. How is GenAI search changing ecommerce traffic, and how do you measure LLM-driven visibility? [toc=7. GenAI & LLM Traffic]
A founder asked me last month why his "direct" traffic was climbing while Google clicks fell. The answer surfaced fast. Shoppers were asking ChatGPT and Perplexity for recommendations, then typing his brand in directly.
AI engines are becoming a discovery channel, so a new metric matters: how often your brand appears in AI answers. Operators now run generative-engine-optimization (GEO) audits, sending dozens of prompts per AI engine and scoring mention frequency, to track an "AI visibility" score the way they once tracked rankings.
🤖 Why GA4 and Shopify miss it
Your standard tools barely capture this. An AI engine recommendation often shows up later as "direct" or branded search, so the credit gets lost. You feel the revenue, but you cannot see the source. This is one more reason AI can actually help you run your e-commerce business in ways legacy dashboards cannot.
That blind spot grows every quarter. If buyers increasingly start inside an AI chat, an untracked channel is quietly becoming a major one.
🔍 How to actually measure it
The practical method is concrete and repeatable. One operator team sent about 80 prompts per AI engine, gathered over 30,000 results, and analyzed how often the brand was mentioned. Pairing this with your marketing analysis and automation turns a one-off audit into an ongoing signal.
That produced a measurable "AI overview score" they could track month over month, and theirs rose versus the prior period. Build that into your reporting now, before competitors treat it as standard. I track this for our own stores, and the trend line is hard to ignore.
Q8. What are the best ecommerce performance analytics tools in 2026? [toc=8. Best Analytics Tools]
Every founder I meet has a tool graveyard. They bought an attribution suite, a dashboard builder, and a heatmap tool, then still export to a spreadsheet to make a decision. The problem is rarely the tools. It is that none of them reason.
The leading ecommerce analytics tools in 2026 span AI-native layers, attribution suites, product analytics, and BI dashboards. The right pick depends on whether you need raw reporting, behavior analysis, or a reasoning layer that extracts the relevant data, finds root cause, simulates, and pushes proactive reports to Slack and email.
⭐ The 2026 shortlist
1.1 Luca. An AI-native analytics layer over your data warehouse. You ask questions in plain English, no SQL or analyst required. It connects sources, finds root cause, simulates scenarios, and sends agentic weekly reports with reasoning to Slack and email. Most analytics tools added AI. Luca is AI.
1.2 Google Analytics (GA4). Free, ubiquitous web analytics. Strong for traffic and funnel basics, weak on fidelity, with sampling and a steep learning curve. If you run it, learn how to add Google Analytics to Shopify cleanly.
1.3 Shopify Analytics. Native store reporting. Best for clean first-party order data, limited for cross-channel attribution. Our Shopify analytics dashboard explainer covers its real limits.
1.4 Triple Whale. Marketing attribution and dashboards for DTC. Strong creative reporting, but integration and data-accuracy complaints are common.
1.5 Polar Analytics. Cross-source dashboards and reporting. Flexible, though setup mishaps can ripple into ad platforms.
1.6 Hotjar. Heatmaps and session recordings. Best for qualitative UX, not financial analytics.
1.7 Looker Studio / Glew.io. BI and dashboarding. Powerful for custom reports, but you build and maintain them yourself.
📋 Quick comparison
Verified buyers keep flagging the same gaps:
"It has been unable to deliver on the promise to provide any insights or accurate data to our business, and we end up reverting back to direct data sources like Meta, Shopify, Recharge."
Matt Huttner Triple Whale Trustpilot Verified Review
"They told Google to calculate page views as conversions. The data sent back to Google is wrong."
David Banks Triple Whale Trustpilot Verified Review
My honest take. If you are sub-$10K monthly revenue or marketplace-only, start with free native tools. Once you run multi-channel and need a reasoning layer, Luca earns its seat among the best Shopify analytics apps.
Q9. Should analytics stop at reporting, or move from descriptive dashboards to prescriptive, AI-native reasoning? [toc=9. Descriptive vs Prescriptive]
Why do we accept tools that stop at "so what?" Your dashboard says revenue dropped 8%. Then it goes silent, and you spend two hours hunting for the reason yourself.
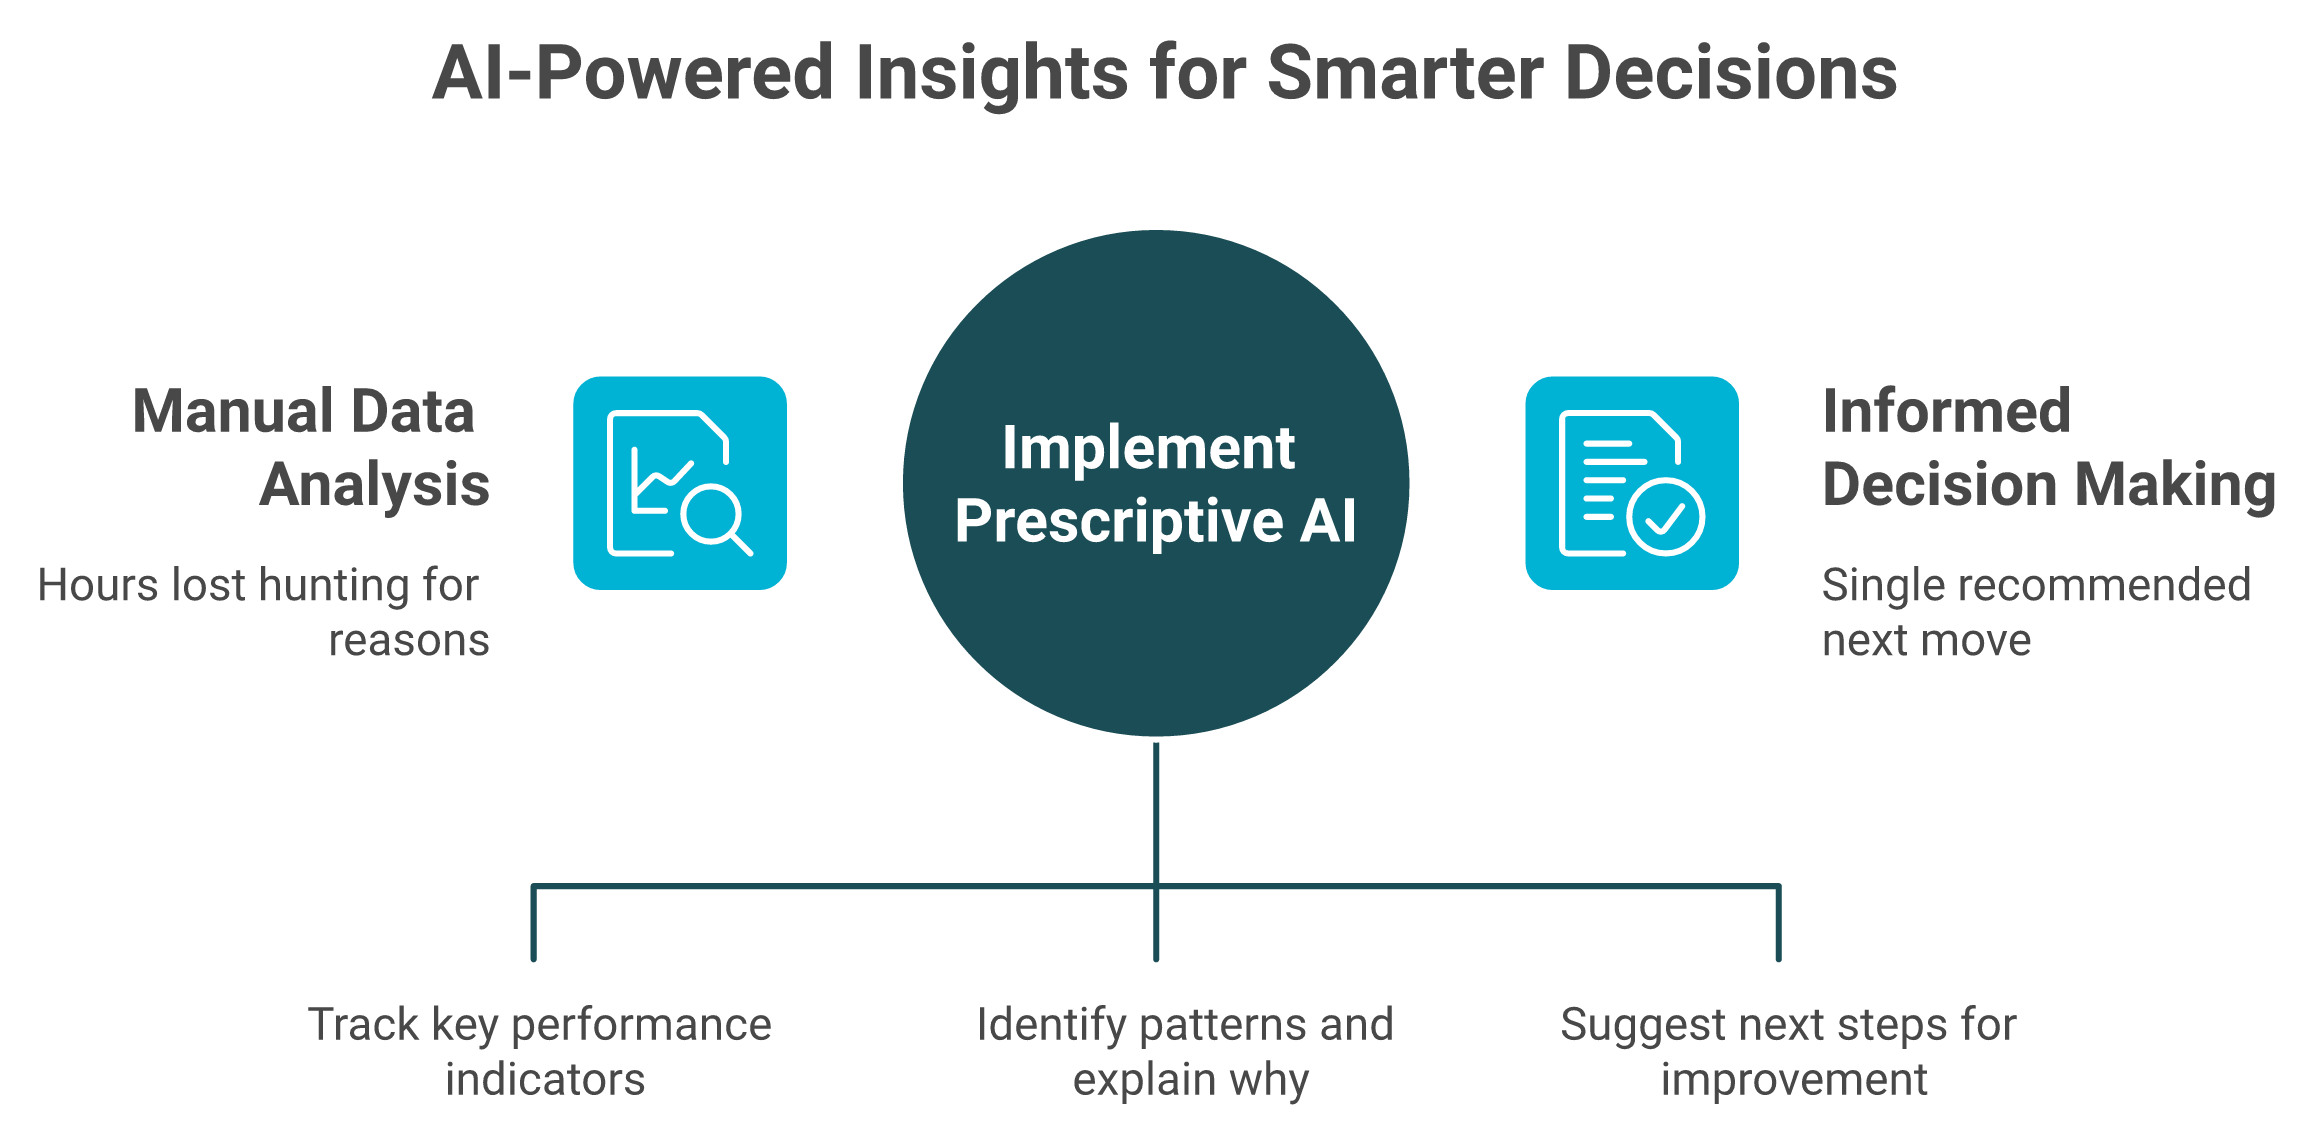
Descriptive analytics says revenue dropped 8%. Prescriptive analytics says which SKU, why, and what to do today. The real shift is freeing teams from manual reporting to acting on insight, moving from monitoring to recommending. Prescription has limits, though. Trust AI for pattern-finding, but keep human judgment for brand "soul" and taste-driven categories like fashion.
🧠 From monitoring to recommending
The best change I have watched a team make was small. They stopped spending hours building a business intelligence dashboard. Instead, they freed people to act on the insights already sitting inside the report. This is the core of what an AI co-founder for e-commerce actually does.
That is the move. Descriptive KPIs and dashboards are fine, but they end at "okay, perfect, but then so what?" One operator fed a full year of sales data into an AI, and it told them what to slot at hip height versus head height, saving months of warehouse work. That kind of operational troubleshooting used to take a consultant.
🤖 Adoption is human, not technical
The unlock is often a mindset, not a model. One founder gave ChatGPT a name, called it Harry, and showed new staff how to ask it questions. That alone cut a hundred repeat questions a day. The same principle drives agentic AI for ecommerce founders.
I have seen the cost of doing it the hard way too. Ari Tulla spent about $10 million building proprietary systems to turn data into meaning, then watched LLMs arrive and do it roughly 10 times better.
⚠️ Where prescription breaks
Here is the twist the category avoids. More data is not always better judgment. Some founders admit they got too data-driven and lost touch with the emotional side, the soul of the business.
So I hedge this. Fashion and taste-led categories are not a one or a zero. Trust AI for patterns, but keep a human on brand feel, because a model does not know your customer the way you do.
⭐ Why this is the leverage
Most analytics tools added AI as a feature. Luca is AI. It reasons across your data, recommends a next move, and explains the why, while leaving the final call to you.
That is the next 18 months for ecom, in my read. The winners will not stare at more charts. They will act on fewer, smarter recommendations, the way AI can actually help you run your e-commerce business.
Q10. When you need growth capital, how does Luca compare with revenue-based financing providers? [toc=10. Capital: Luca vs RBF]
I have sat with founders the morning after a funding offer got pulled. The container was at the port. The supplier needed payment. The "approved" deal had quietly vanished. That scene is far too common in revenue-based financing.
When you need capital, the metrics that matter are cost (effective rate), disbursal time, repayment flexibility, and whether the offer actually holds. Revenue-based financiers, providers who advance cash against future sales, routinely lure operators with approvals, then reverse or slash them at the worst moment. Judge any provider, Luca included, on rate, speed to cash, term clarity, and underwriting reliability, not on a sales pitch.
💸 The bait-and-switch tax
The biggest hidden cost is not the rate. It is the reversal. An approved offer that disappears can break your whole quarter, which is why so many operators hunt for Wayflyer alternatives.
The receipts are damning:
"We signed a 3M loan deal, only for them to come back two weeks later saying they were slashing our funding to 1M. Then, months later, they cut it again to 350K."
Xin Shui Uncapped Trustpilot Verified Review
"After being offered funding in writing with specific amounts, repayment terms, and confirmation that the deal was approved, Wayflyer abruptly reversed their decision at the last minute."
Geoff Brand Wayflyer Trustpilot Verified Review
⏰ The metrics that actually matter
Strip away the sales gloss, and judge capital on four things. Sound working-capital planning depends on getting all four right.
Reliability is the metric operators forget until it burns them, and it pushes many toward Clearco alternatives:
"Despite no change in our cash position or risk profile, we started facing stricter cash-on-hand demands that made little sense."
Melissa Clearco Trustpilot Verified Review
💰 How Luca competes on capital
Money follows speed. Luca's capital offer is built to hold and to land fast, so a confirmed amount stays confirmed when the container is at the port. The full reasoning sits in our intelligence-capital thesis.
I will be straight: below very early revenue, traditional options may still fit, and you should always compare all-in cost. If you want the head-to-head, see Luca AI versus Wayflyer.
Q11. What does a profit-first analytics stack look like on Monday morning, and what do you do first? [toc=11. Your Monday Workflow]
Picture your current Monday. Thirty browser tabs, three revenue numbers that disagree, and a coffee going cold while you hunt for one clear move. That is the before.
Start Monday with three screens, not thirty charts. Funnel: conversion, add-to-cart, checkout, abandonment. Margin: contribution margin per order, product-level CAC, true return cost. Retention: repeat rate, churn, LTV by cohort and category. Reconcile them against one first-party source so GA4, Meta, and Shopify stop arguing, then ask which single lever banks cash this week.
✅ Your do-this-first checklist
Build it once, then run it every Monday in under fifteen minutes. The right ecommerce management software makes this a habit, not a chore.
- Open the Funnel Scorecard. Find the biggest leak between visit and checkout.
- Open the Margin Scorecard. Confirm your "best seller" actually clears contribution margin.
- Open the Retention Scorecard. Check repeat rate and one category-crossover path.
- Reconcile all three against a single first-party source of truth.
- Pick one lever. Act on it this week. Ignore the rest.
That last step matters most. The goal is not more numbers. It is one decision that moves money, the same discipline behind strong sales performance tracking.
🚂 Keep both train tracks moving
Run inventory and cash on parallel tracks. When your scorecards flag a winning SKU, the next question is whether you have the cash to restock it before momentum fades. That is where funding to scale your campaigns meets your cash flow forecast.
This is where Luca closes the loop. It assembles the three scorecards from one connected data layer, pings you when ROAS dips or inventory runs low, and keeps the capital question one conversation away.
💬 What I am sitting with
Here is the question I keep turning over. As AI co-founders mature by 2027, will the morning dashboard disappear entirely, replaced by a single proactive message that says "here is your one move today?"
I think it might. If you are testing that future on your own store, tell me which lever you are chasing this quarter, and we will help you build the scorecard around it.

.webp)
.svg)
.webp)

.png)
