Ecommerce Business Intelligence: KPI Hierarchy, Data Stack Architecture, Tooling Workflows, And Rollout Playbook
13
mins read
TL;DR
Ecommerce business intelligence in 2026 is no longer dashboards, it is a reasoning layer that runs RCA, simulates scenarios, and pushes agentic reports across Shopify, Meta, Klaviyo, Stripe, and Xero. Most BI stacks quietly fail past €3M because vertical tools force the founder to be the manual integration layer, costing 10 to 15 hours weekly and 15 to 20 percent revenue variance. CM3 belongs at the apex of the KPI hierarchy, with MER and new-customer profit beneath, and channel ROAS demoted to a diagnostic tile rather than a decision metric. A custom warehouse plus analyst team costs €180k to €350k in year one, while an AI-native reasoning layer delivers answers in week one for under €30k annually. Capital choice should be evaluated on rate, disbursal, advance rate, personal-guarantee terms, and underwriting transparency, not on marketing pages from Wayflyer, Clearco, 8fig, or Stripe Capital. A 30-day plan moves brands from fragmented BI to agentic reasoning: audit, connect, replace one manual report, and turn on agentic Slack briefs.
Q1. What Is Ecommerce Business Intelligence In 2026, And Why Has The Definition Shifted From Dashboards To Reasoning? [toc=1. BI Definition Shift]
The 2026 shift moves ecommerce BI from displaying numbers to reasoning across them.
A founder doing roughly $400K a month on Shopify pinged me last Monday at 8:47 AM. His MER (Marketing Efficiency Ratio, total revenue divided by total ad spend) had dipped from 3.1 to 2.4 over the weekend. He had four tabs open: Meta, GA4, Triple Whale, and a Google Sheet from his ops lead.
He still did not know why.
That is the gap this article is about. The dashboard era told you what happened. The 2026 era has to tell you why it happened, what is influencing it, and what to do before noon.
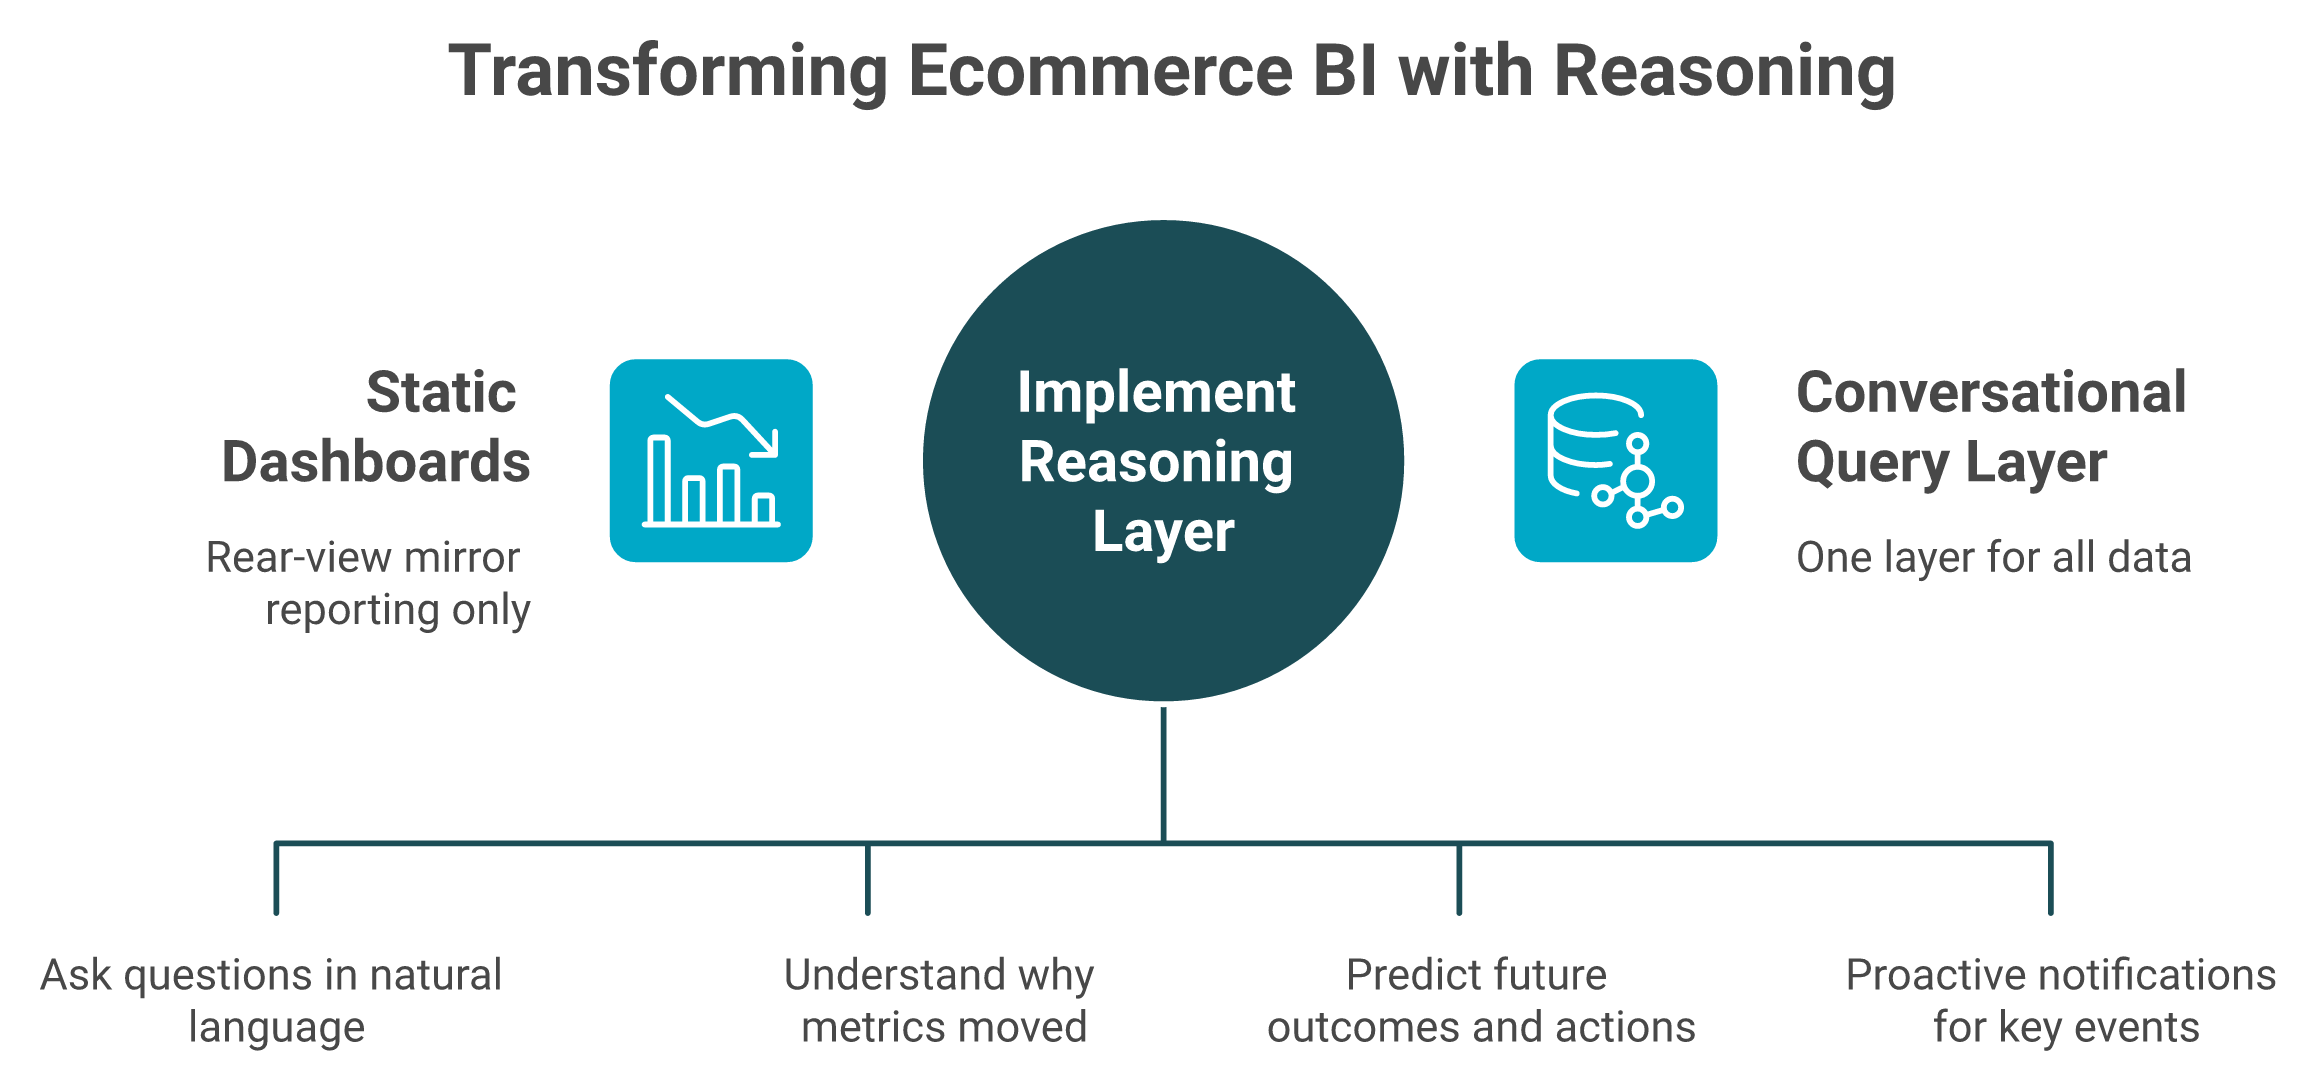
Ecommerce business intelligence in 2026 is no longer a dashboard you open on Monday morning. It is a reasoning layer that sits over your unified warehouse, Shopify, Meta, Klaviyo, Stripe, and Xero, and answers in plain English: what changed, why it changed, what is influencing it, where the bottleneck is, and what the next move should be. Static reporting is the floor. Agentic, simulation-capable reasoning is the new ceiling. Most founders are drowning in data they cannot reason against.
The Monday Morning Excel Shudder
Most scaling brands still run BI through 8 to 12 disconnected tools. Founders export CSVs, pivot them, and call that "weekly reporting."
The 2025 Shopify Commerce Trends report flagged that DTC operators routinely lose visibility on paid traffic across post-iOS attribution gaps. Meanwhile, a Klaviyo benchmark study put email-attributed revenue and ad-attributed revenue in the same brand 18 to 30 percent apart, depending on the window. The numbers do not reconcile, and the founder becomes the integration layer.
Why Triple Whale, GA4, And Looker Are Rear-View Mirrors
These tools display history. They do not reason about it. Operators have started saying so on the record.
"Daily revenue totals are wrong, entire order blocks are missing, and every week we have to open new support tickets just to get our numbers halfway close to what our channel actually reports." XTRA FUEL Triple Whale Trustpilot Verified Review
"It is becoming very opaque, it doesn't have real-time, the sampling is increasingly wild, and now it applies a threshold." Verified User in Retail Google Analytics G2 Verified Review
The Shift From Data Possession To Data Reasoning
✅ The new advantage is not who owns the most data. ✅ It is who can reason across it the fastest. ❌ Dashboards display tiles. ✅ Reasoning layers run root-cause analysis, simulate scenarios, and surface influencing components. ❌ Most tools added an AI tab last year and called it a roadmap.
Ari Tulla at ELO Health spent close to $10M building a proprietary algorithmic platform. When LLMs landed, his team rebuilt it on a general reasoning engine and saw forecasting accuracy jump roughly 10x. The lesson is uncomfortable for vendors: the moat moved.
What "Reasoning Layer" Actually Means In Practice
In our work with Shopify operators, we built Luca as an AI layer that sits over the unified warehouse. It pulls the relevant slice of data on demand. It runs RCA (root cause analysis) on metrics that move. It simulates outcomes. It identifies the influencing components behind a CAC spike or a return-rate jump.
A founder asks, "Why did MER drop on Tuesday?" The reasoning layer pulls Meta CPMs, Shopify cohort data, Klaviyo flow performance, and shipping delays in one pass. It returns the answer, the math, and the next move. This is the agentic AI workflow ecommerce founders are starting to expect.
That is the shift. From displaying numbers to explaining them.
Q2. Why Do Most Ecommerce BI Stacks Quietly Fail Once A Brand Crosses €3M In Revenue? [toc=2. Stack Failure At Scale]
It is 11 PM on a Thursday. A €4M Shopify founder has 47 spreadsheet tabs open. Meta says revenue was €112K this week. Shopify says €94K. Xero says only €71K cleared the bank.
Past €3M, vertical tools force the founder to become the integration layer the stack lacks.
She is not lazy. She is not unskilled. The architecture is broken.
The Root Cause: Vertical-By-Design Tooling
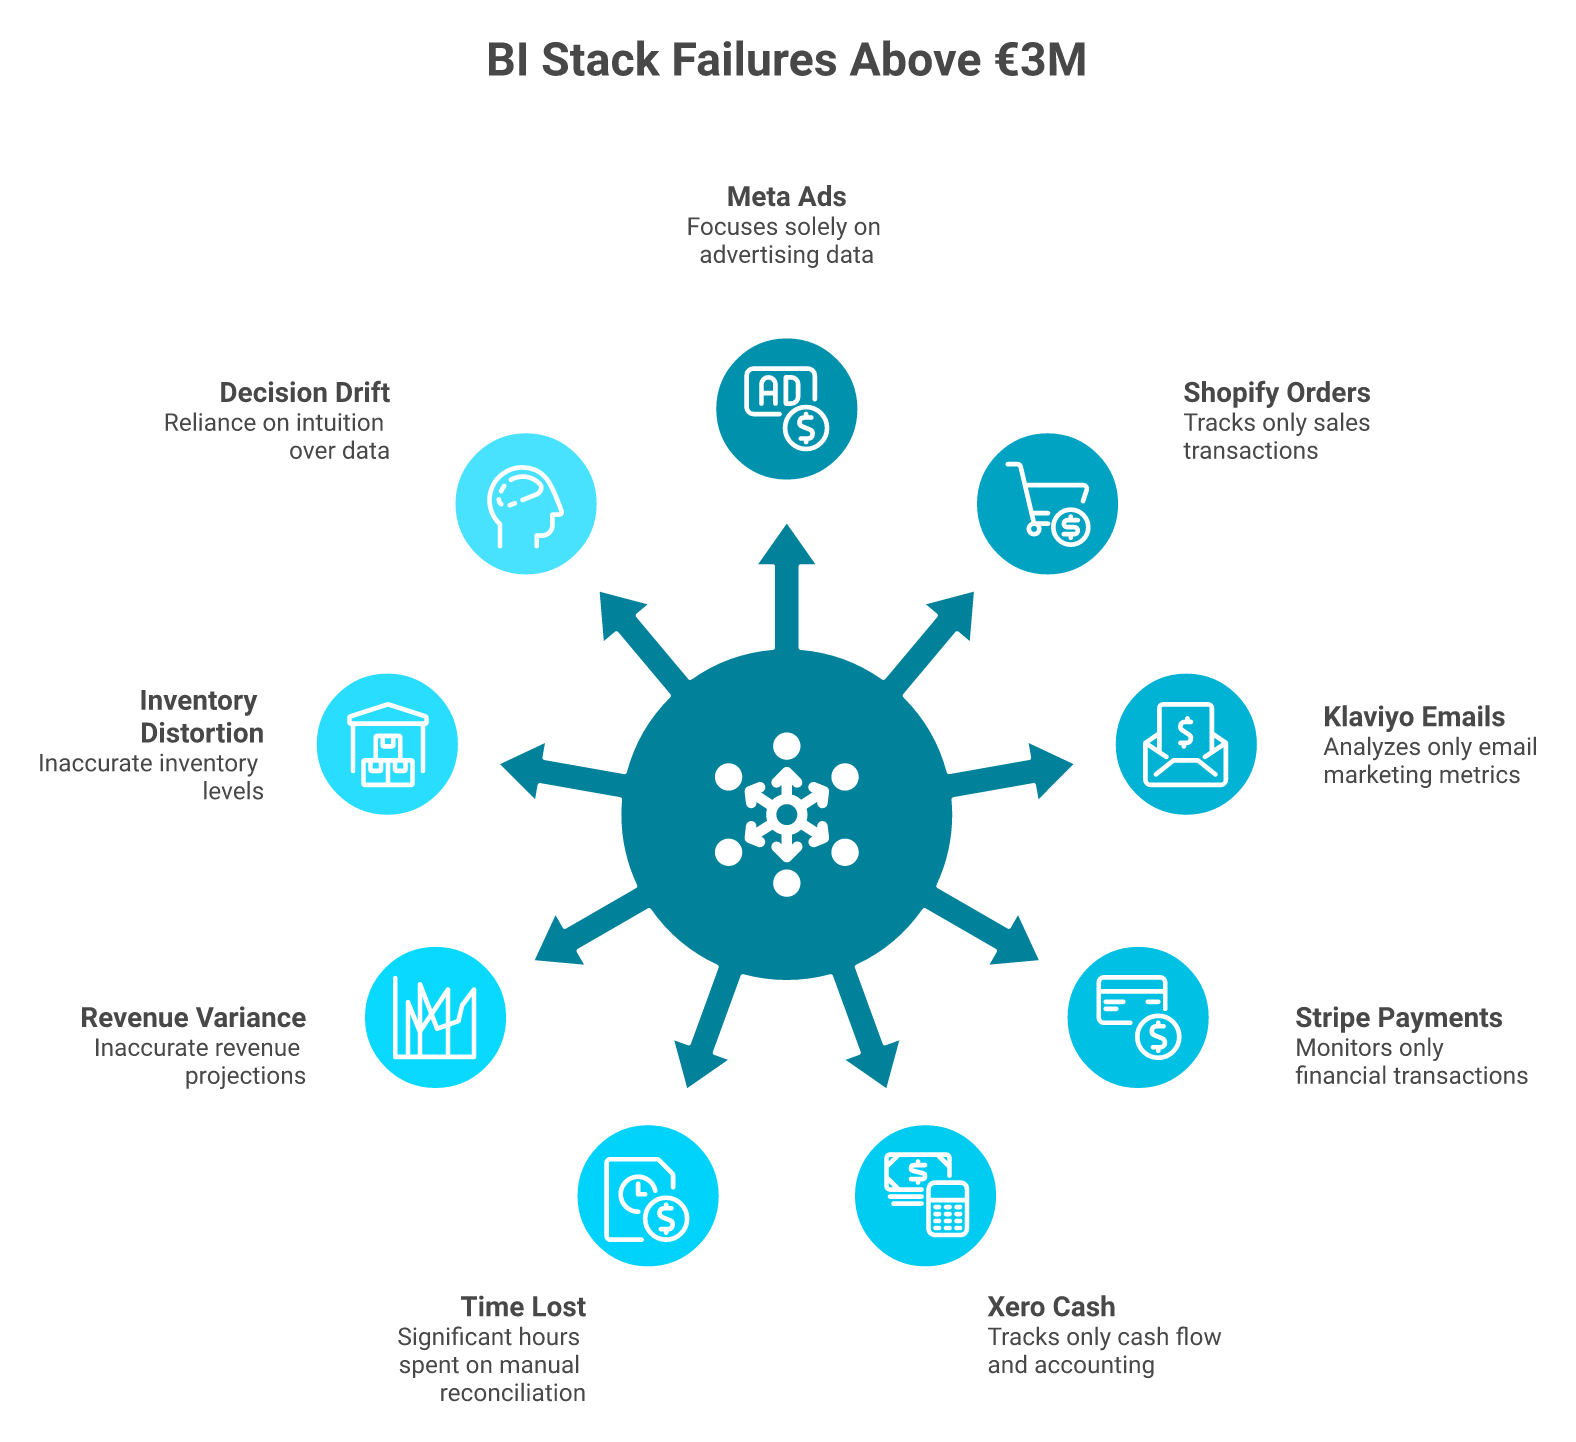
Each tool was built to win a single category. Meta sees ads. Shopify sees orders. Klaviyo sees email. Xero sees cash.
None of them were built to reason across the others. ⚠️ The founder becomes the manual integration layer. ⚠️ At €1M, that costs an hour a week. At €3M, it costs a hire. A clean ecommerce tech stack resolves this only when a reasoning layer sits on top.
"Anyone elses struggling to trust Shopify analytics... Reviews are mixed and sometimes feel fake." Anonymous, r/ShopifyeCommerce Reddit Thread
The Hidden Costs Most Founders Underprice
The tax shows up in five places.
⏰ Time: 10 to 15 hours a week of manual reconciliation across the leadership team
💸 Variance: 15 to 20 percent disagreement between platform-reported and actual revenue
💰 Inventory distortion: roughly 6 percent of revenue lost to stockouts and overstocks across global retail
❌ Missed scaling windows: by the time the report runs, the creative is fatigued
⚠️ Decision drift: leaders default to gut feel because the numbers conflict
Ken Price at Blake Mill summed it up better than I can: managing merchandising data without an intelligence layer is "drinking from a fire hydrant."
What The Right Architecture Looks Like
✅ Sources flow into one warehouse. ✅ Definitions of contribution margin, MER, and cohorts live in a semantic layer. ✅ A reasoning layer sits on top. ✅ Insights push back into Klaviyo segments and Meta audiences. ❌ Most brands stop at sources and dashboards.
How A Reasoning Layer Closes The Gap
In our work with sub-€10M DTC brands, the pattern repeats. We plug Shopify, Meta, Klaviyo, Stripe, and Xero into one normalized layer. The founder asks one question. The system returns the cross-platform answer in seconds. Many of these brands evaluate ecommerce analytics platforms before realizing the architecture is the problem, not the vendor.
That is the move from a 3-hour CSV session to a 5-second answer. Not because the tool is faster. Because the architecture is horizontal.
"Worst customer service I have ever experienced. They show no sign of actually trying to help. What a disgusting company with the prices they charge." Lars Volkers Triple Whale Trustpilot Verified Review
That review is not unusual. Operators paying €1,500 to €4,000 a month for a single-vertical analytics tool are starting to ask whether the architecture, not the vendor, is the problem. The same skepticism shows up across Triple Whale alternatives conversations on Reddit and X.
Q3. What Does The Right KPI Hierarchy Look Like, And Why Should Contribution Margin Sit At The Apex, Not ROAS? [toc=3. KPI Hierarchy]
Most KPI lists you find on Shopify blogs read like a buffet. Twenty-six metrics, no order, no apex. That is the problem.
If everything is a KPI, nothing is.
The 2026 KPI hierarchy puts CM2 / CM3 (Contribution Margin after variable costs and channel costs) at the apex because it is the only metric that survives every channel mix, return rate, and CAC swing. Beneath sit MER and new-customer profit, the operator-grade ROAS. Then LTV/CAC and cohort retention. Then cash conversion cycle. ROAS becomes a diagnostic tile, not a decision metric. This is the same logic operators apply when they track ecommerce unit economics at scale.
CM3 at the apex, ROAS demoted to diagnostic, the KPI hierarchy that holds at scale.
Step 1: Define The CM Stack Cleanly
Three layers, three questions.
The Contribution Margin Stack
Layer
Formula
What It Answers
CM1
Revenue, COGS, payment fees
Is the unit profitable?
CM2
CM1, shipping, fulfillment, returns
Is the order profitable?
CM3
CM2, ad spend, agency fees
Is the customer profitable?
CM3 is the apex because it is the only number that ties a marketing decision to a P&L line.
Step 2: Anchor To Real Benchmarks
Admetrics' 2024 DTC contribution margin benchmark put CM3 above 20 percent as scalable, 30 to 50 percent as healthy, and below 15 percent as fragile. Eightx's April 2026 vertical breakdown showed apparel hovering near 22 percent CM3 and supplements pushing 38 percent.
✅ Use these as guardrails, not gospel. ⚠️ Your category, your AOV, your return rate all move the line.
Step 3: Layer In MER And New-Customer Profit
Andrew Faris (4x400, AJF Growth) has been hammering this point on the 2x eCommerce podcast for three years: in-platform ROAS is an artifact, new-customer profit is the north star. The deeper read on why platform ROAS keeps drifting from true profitability is worth a separate sit-down.
Why MER Beats Channel ROAS
Blended MER captures the halo effect platform pixels miss
New-customer profit isolates acquisition health from repeat-customer noise
Together they tell you whether to scale, hold, or cut
Step 4: Cohort Retention And Cash Conversion
Below MER sit the leading indicators.
LTV/CAC by cohort: tells you if today's customer is worth more than yesterday's
90-day repeat rate: the earliest signal of product fit decay
Cash Conversion Cycle (days from cash out to cash back): the constraint that decides if you can scale at all
Anthony Mink at Live Bearded ran an AI analysis on his cohort data and found something uncomfortable. Customers who bought from three or more product categories had roughly 100 percent higher LTV than customers who simply bought more frequently from one category. Diversity of basket beat frequency. Most cohort dashboards do not even surface that cut.
Step 5: The Hierarchy On One Page
2026 Ecommerce KPI Hierarchy
Tier
Metric
Cadence
Apex
CM3
Daily
Strategic
MER, New-Customer Profit
Daily
Leading
LTV/CAC, 90-day cohort retention
Weekly
Constraint
Cash Conversion Cycle, Days of Inventory
Weekly
Diagnostic
Channel ROAS, CTR, AOV
Hourly to daily
What This Means On Monday Morning
Stop opening Meta first. Open the CM3 tile first. If CM3 holds, channel ROAS is noise. If CM3 drops, the dashboard tells you what changed. The hierarchy tells you whether to act.
In our work with operators, the brands that promote CM3 to apex stop chasing ghost ROAS within two weeks. The ones who keep ROAS at the top keep firefighting. The same pattern shows up across best Shopify analytics apps evaluations: the tool matters less than the metric the team agrees to lead with.
Q4. How Should A Modern Ecommerce Data Stack Be Architected, Sources, ELT, Warehouse, Semantic Layer, BI, And Reverse ETL? [toc=4. Data Stack Architecture]
A modern ecommerce data stack has six layers: sources (Shopify, Meta, Klaviyo, Stripe, and Xero), ELT (Fivetran, Airbyte), warehouse (BigQuery, Snowflake), semantic layer (where CM, MER, and cohort definitions are codified), BI / reasoning, and reverse ETL (pushing insights back into Klaviyo segments or Meta audiences). Most brands invest in layers 1 and 2, ignore the semantic layer, and have no reverse-ETL loop. That is why dashboards proliferate while decisions stall.
Layer 1: Sources, The Cleanest Part Of The Stack
Shopify for orders. Meta and Google for ads. Klaviyo for email and SMS. Stripe for payments. Xero or QuickBooks for cash.
These are usually fine. The schemas are stable. The APIs are documented. The trouble starts above them. Founders running ecommerce website analytics alongside Shopify-native reports are the first to feel the friction.
Layer 2: ELT, Where Most Brands Stop
ELT (Extract, Load, Transform) tools like Fivetran and Airbyte move raw data into a warehouse. ✅ This solves transport. ❌ It does not solve meaning. ⚠️ Two pipelines from Meta can deliver two different revenue numbers depending on attribution windows.
Layer 3: The Warehouse, The Underused Asset
BigQuery or Snowflake gives you a single place where every row of data lives. Cost is often 200 to 800 dollars a month at sub-€10M scale.
Most operators I talk to have the warehouse but barely query it. The team that wrote the dbt models left. The dashboards drift.
Layer 4: The Semantic Layer, The Real Battleground
This is where definitions get codified. What counts as a "new customer." How CM3 is calculated. What "active" means in a cohort.
Without a semantic layer, every dashboard can show a different number for the same metric. With one, the whole company speaks the same language.
Why Semantic Layers Matter
Definitions live in code, not in someone's head
New tools plug in without redefining metrics
AI reasoning has a stable substrate to reason against
Layer 5: BI / Reasoning, Where The Category Just Split
Old BI: dashboards. Looker, Tableau, and Power BI. ❌ Static, query-on-demand, engineering-heavy.
New reasoning layer: AI sitting on the warehouse. ✅ Plain-English questions, RCA, simulation, anomaly detection, and agentic push reports. The shortlist of ecommerce analytics tools that also fund your campaigns is short for a reason.
"A good company would be able to offer you a trial, knowing you would stay. Northbeam tries to make you pay 3 months up front." Tobias Teigen Northbeam Trustpilot Verified Review
The vendors that demand 3-month commitments are doing it because their value takes 3 months to surface. A real reasoning layer earns the seat in week one.
Layer 6: Reverse ETL, The Forgotten Loop
Reverse ETL pushes insights from the warehouse back into the operational tools. The "VIP cohort with 3+ category purchases" segment lands inside Klaviyo. The "high-LTV lookalike" lands inside Meta. The "stockout-risk SKU list" lands inside the WMS.
Without reverse ETL, insight stops at the dashboard. With it, the loop closes.
Where Luca Sits In The Stack
We built Luca as the layer 5 reasoning engine that talks fluently to layers 3 and 4 without forcing operators to hire a data engineer. Plain-English questions return executive-grade answers with the underlying SQL visible if you want it. Outlier alerts push to Slack and email on the cadence the operator sets. The deeper architectural read sits in our intelligence and capital thesis.
That is the architecture. Six layers, one language, zero CSV exports.
Q5. Which Ecommerce BI And Analytics Tools Actually Compete In 2026, Triple Whale, Polar, Northbeam, Glew, GA4, Looker, And Luca Compared? [toc=5. BI Tools Compared]
A founder doing roughly $2M a year on Shopify asked me last month which analytics tool to pick. He had a free GA4 account, a Triple Whale trial expiring Friday, and a Polar quote on his desk.
He did not need a feature list. He needed a clean architectural read.
Triple Whale and Northbeam lead on attribution. Polar suits Shopify-native reporting. Glew offers pre-built ecommerce dashboards. GA4 is free but session-based. Looker is enterprise-grade but engineering-heavy. Luca is structurally different, an AI reasoning layer that sits on your warehouse, performs root-cause analysis, simulates scenarios, identifies influencing components, and pushes agentic reports to Slack and email automatically. Pick by what your team can actually operate. The shortlist of ecommerce analytics platforms worth your time is shorter than vendor pages suggest.
What Each Tool Is Actually Good At
Each vendor wins a clear job. ✅ Triple Whale wins post-iOS attribution dashboards. ✅ Northbeam wins MMM-grade attribution above $500K monthly spend. ✅ Polar wins Shopify-native pre-built reporting. ✅ Glew wins out-of-the-box ecommerce dashboards. ✅ GA4 wins free session and event tracking. ✅ Looker wins enterprise BI with a data team behind it. Operators comparing best Shopify analytics apps usually start here before the trade-offs surface.
Where Each Tool Actually Breaks
The trade-offs show up in production.
❌ Triple Whale: pricing creep, attribution accuracy disputes, and support gaps
❌ Northbeam: 3-month minimum commitments before value lands
❌ Polar: limited cross-functional finance and ops reasoning
❌ Glew: dashboards over reasoning, light on RCA
❌ GA4: session-based modeling, sampling, and attribution lag
❌ Looker: requires SQL, dbt, and an analytics engineer
"Daily revenue totals are wrong, entire order blocks are missing, and every week we have to open new support tickets just to get our numbers halfway close to what our channel actually reports." XTRA FUEL Triple Whale Trustpilot Verified Review
"A good company would be able to offer you a trial, knowing you would stay. Northbeam tries to make you pay 3 months up front." Tobias Teigen Northbeam Trustpilot Verified Review
Operators chasing Triple Whale alternatives echo the same pricing and support patterns on Reddit and X.
Where Luca Sits, Architecturally
✅ Luca is an AI reasoning layer over your unified warehouse, not another vertical dashboard. ✅ It runs RCA, simulation, and influencing-component analysis on plain-English questions. ✅ It pushes agentic reports to Slack, email, and app on the cadence the operator sets. ❌ It is not a fit if you only need a marketing-attribution dashboard. ✅ Most analytics tools added AI. Luca is AI.
Side By Side Read
2026 Ecommerce BI Tools, Architectural Comparison
Dimension
Triple Whale
Northbeam
Polar
Glew
GA4
Looker
Luca
Architecture
Vertical app
Vertical app
Vertical app
Vertical app
Session tracker
BI on warehouse
AI reasoning on warehouse
Query model
Pre-built tiles
Pre-built tiles
Pre-built reports
Pre-built dashboards
Reports + Explore
SQL / LookML
Plain English
RCA built-in
❌
Limited
❌
❌
❌
❌
✅
Simulation
❌
❌
❌
❌
❌
❌
✅
Anomaly alerts
Limited
✅
Limited
❌
❌
❌
✅
Agentic Slack reports
❌
❌
❌
❌
❌
❌
✅
Setup
Days
Weeks
Days
Days
Hours
Months
10 minutes
Who Should Pick What
Pick Triple Whale or Polar if you only need marketing attribution and one team uses it. Pick Northbeam if you are above $500K monthly ad spend and need MMM. Pick Looker if you have an in-house data team. Pick Luca if you want a reasoning layer that connects marketing, finance, and operations without hiring an analyst. The deeper read on analytics tools that also fund your campaigns tightens the shortlist further.
Q6. Build Versus Buy, When Is A Custom Warehouse Plus Analyst Team Worth It Versus An AI-Native Reasoning Layer? [toc=6. Build Vs Buy]
A Head of Finance at a $40M omnichannel brand told me last quarter that her board kept asking why the data team had grown to four full-time hires while leadership still got conflicting MER numbers in Tuesday syncs. The build had become the bottleneck it was meant to solve.
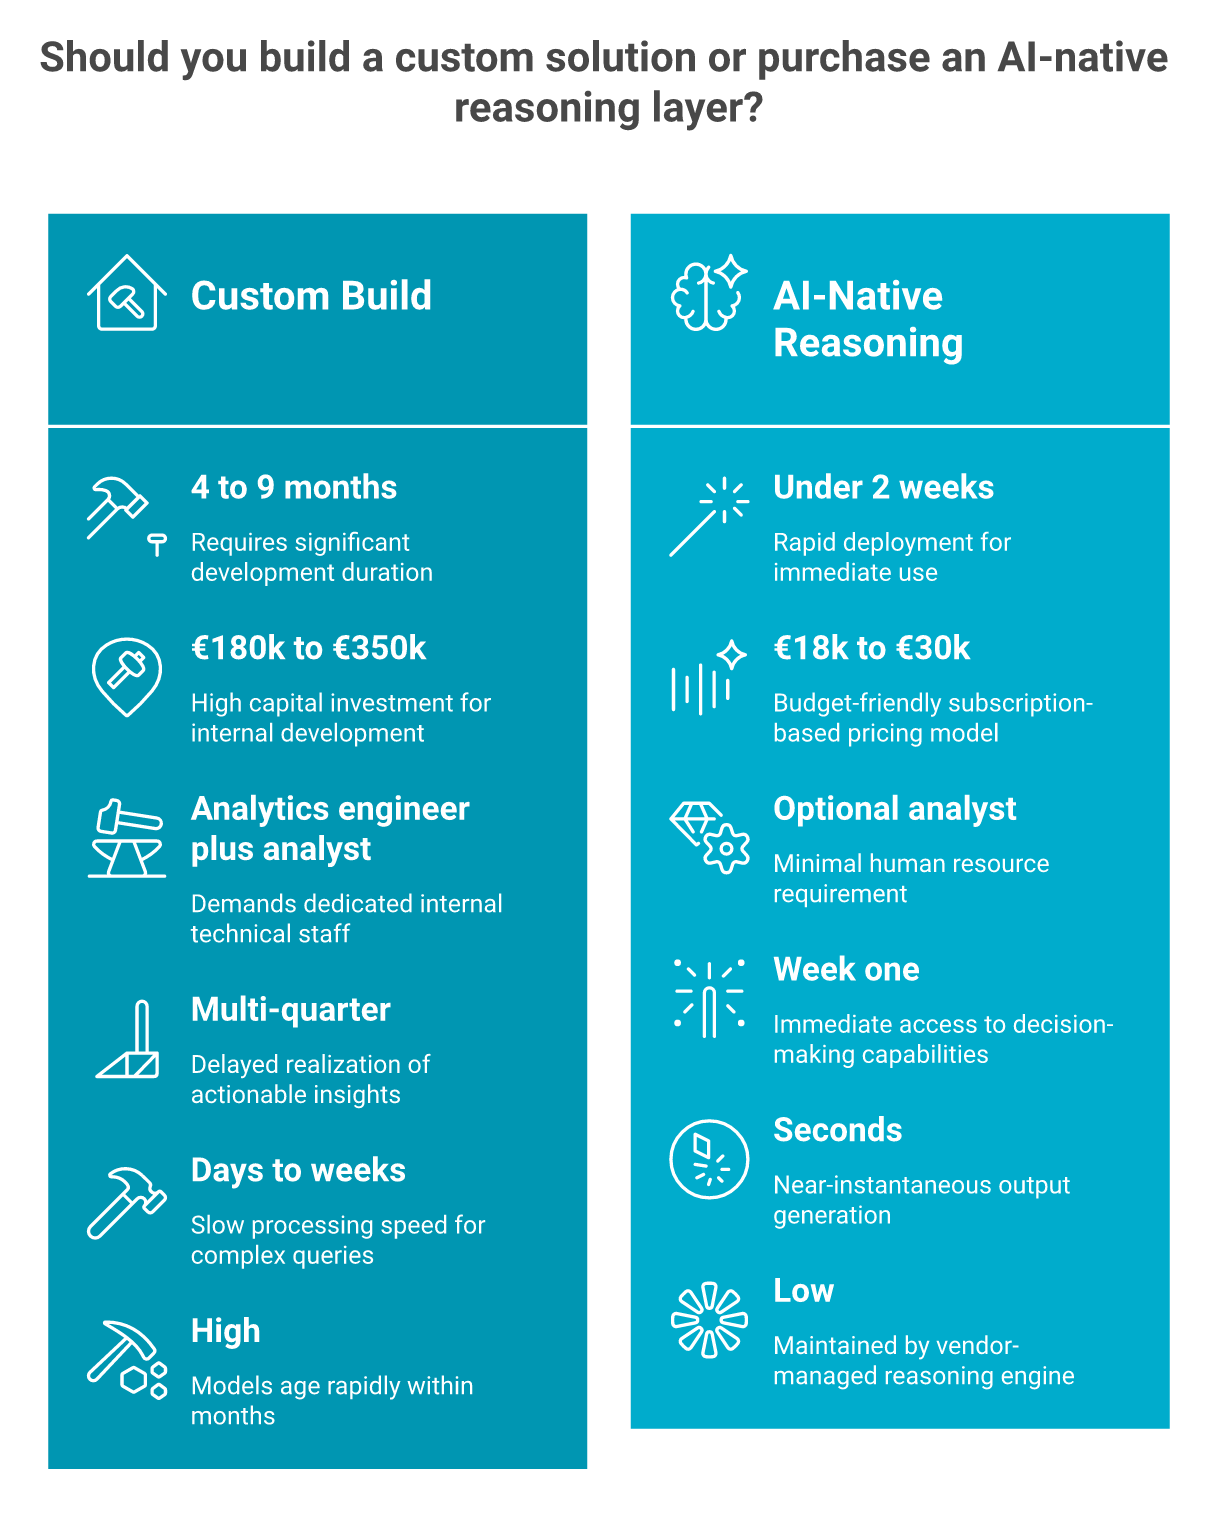
A custom warehouse with Fivetran, dbt, BigQuery, and a two-person analytics team costs €180k to €350k in year one before delivering a single decision. An AI-native reasoning layer delivers answers in week one for under €30k annually. Build only when data complexity or proprietary models justify it. For 95 percent of DTC brands under €50M, AI-native platforms now beat custom builds on speed, accuracy, and total cost of ownership. The same logic shows up across ecommerce management software evaluations.
The Wrong Way To Decide
Most founders pick on the wrong axis.
❌ Cheapest tool wins
❌ Most integrations wins
❌ Whoever the agency recommends wins
❌ Whatever the last analyst hire used wins
The Right 7-Point Framework
Score each option from 0 to 2.
Build Versus Buy Decision Framework
Criterion
Question
Data sources covered
Does it pull marketing, commerce, finance, and ops?
Query model
Plain English or SQL only?
Root cause analysis
Can it explain why a metric moved?
Simulation
Can it model "what if I shift €20K to TikTok"?
Anomaly detection
Does it surface outliers without me asking?
Setup time
Hours or months to first answer?
Total cost of ownership
All-in cost across year 1 to year 3
Build Versus Buy By The Numbers
Year-one costs, real ranges I have seen across pilots and operator conversations.
Year One Cost Comparison: Custom Build Vs AI-Native Layer
Line Item
Custom Build
AI-Native Reasoning Layer
ELT (Fivetran or Airbyte)
€15k to €30k
Included
Warehouse (BigQuery, Snowflake)
€4k to €15k
Included
Modeling (dbt, semantic)
€20k to €40k
Included
BI seats (Looker, Tableau)
€10k to €25k
Included
Analytics engineer plus analyst
€130k to €220k
Optional
Time to first decision
4 to 9 months
Under 2 weeks
Year 1 total
€180k to €350k
€18k to €30k
⚠️ The build path can still be right for brands above €50M with proprietary algorithmic IP. ✅ Below that line, AI-native reasoning layers win on every axis that matters to the operator.
The Cautionary Tale
Build or buy: the year-one math for sub-€50M DTC brands rarely justifies a custom stack.
Ari Tulla at ELO Health spent close to $10M on a custom algorithmic platform. When LLMs arrived, his team rebuilt on a general reasoning engine and saw forecasting accuracy jump roughly 10x. The custom build aged in months, not years.
The Hidden Tax Most CFOs Underprice
Build costs are not the line item that hurts. The hidden tax is decision latency.
💸 Every week without a clean CM3 number is a week of misallocated ad spend
⏰ Every analyst ticket waiting in the queue is a creative refresh that ships late
⚠️ Every reconciliation meeting is the leadership team litigating reality instead of acting on it
How Luca Scores On This Framework
✅ Data sources: 20-plus, including Shopify, Meta, Klaviyo, Stripe, and Xero. ✅ Query model: plain English, no SQL. ✅ RCA: built-in. ✅ Simulation: scenario modeling on demand. ✅ Anomaly detection: 24/7 scanning with Slack and email push. ✅ Setup: roughly 10 minutes. ✅ TCO: under €30k annually for sub-€10M brands. The same operating model underpins agentic AI for ecommerce founders.
The Meta-Insight
The wrong question is "build or buy?" The right question is "how fast does my decision latency get below one day?" Every month spent building is a month the dashboard does not pay for itself.
Q7. What Do The Four Essential Ecommerce Dashboards Actually Look Like, Executive, Marketing, Retention, And RFM? [toc=7. Four Essential Dashboards]
The mistake I see most often is brands building 14 dashboards no one reads. The win is four dashboards that drive Monday-morning action.
Every scaling DTC brand needs four. Executive: CM3, MER, cash runway, and days-of-inventory, refreshed daily. Marketing: new-customer profit by channel, creative-level CTR/CPA, and blended ROAS, hourly. Retention: cohort retention curves, repeat rate, and 90-day LTV, weekly. RFM: Recency-Frequency-Monetary segments tied to email and SMS flows, daily. The cleanest reference for these views still lives in the Shopify analytics dashboard explained walkthrough.
Dashboard 1: Executive (Daily, 6 Tiles)
The CEO and CFO open this one.
⭐ CM3 (Contribution Margin after ad spend)
⭐ MER (Marketing Efficiency Ratio: total revenue / total ad spend)
RFM, Recency, Frequency, and Monetary value, the cleanest way to segment VIPs.
⭐ R-F-M segment counts (Champions, Loyal, At Risk, and Lost)
⭐ Revenue contribution per segment
⭐ Klaviyo flow performance per segment
⭐ At-Risk segment recovery rate
Why These Four Beat Fourteen
Each dashboard answers one question only. Executive answers "are we healthy?" Marketing answers "where do we put the next dollar?" Retention answers "is the customer worth more this quarter than last?" RFM answers "who do we email tonight?"
How A Reasoning Layer Replaces Dashboards
In our work with operators, we watched brands move from 14 dashboards to 4 and recover roughly 70 percent of reporting time. Luca lets a founder ask the same question conversationally instead of opening a tile, "what's my CM3 by channel this week, and which creative dragged it down?" The dashboard returns inline with the math and the next move. Founders running best AI tools for Shopify owners are converging on this same workflow.
That is the shift from displaying data to using it.
Q8. Is Your Current BI Stack Already Costing You Money? A 9-Point Self-Audit [toc=8. BI Stack Self-Audit]
If you cannot answer "what is my contribution margin by channel right now" in under 60 seconds, your BI stack is costing you money. The audit covers nine criteria including cross-functional reasoning, proactive alerts, scenario simulation, root-cause analysis, zero-SQL access, anomaly detection, normalization on ingestion, and cohort visibility. Score below 5 and fragmentation is the silent tax on your velocity, likely 5 to 15 percent of margin annually. The pattern repeats across the operators we surveyed in why ecommerce founders are drowning in data.
The 9-Point Stack Audit
Tick the box if the answer is a clear yes.
☐ I can answer "what is my CM3 by channel right now" in under 60 seconds.
☐ My system alerts me to CAC spikes or inventory shortfalls without me asking.
☐ I can simulate "if I shift €20K to TikTok, what happens to cash in 90 days?"
☐ I can run RCA on a metric drop without opening five tabs.
☐ My team gets answers without writing SQL.
☐ My data is normalized on ingestion, no manual cleanup before queries.
☐ My marketing, finance, and ops data live in one queryable layer.
☐ I see cohort retention without building it from scratch each week.
☐ I get a weekly executive brief auto-generated with reasoning, not just charts.
Score Interpretation
BI Stack Maturity Score
Score
What It Means
7 to 9
⭐ Mature stack, focus on optimization
4 to 6
⚠️ Critical gaps, decisions running on incomplete data
0 to 3
💸 Fragmentation tax, manual processes dominate
What The Pattern Looks Like In The Wild
Most operators I talk to score 2 or 3 on first audit. They have Shopify, Meta, and a spreadsheet, and that is it.
"Anyone elses struggling to trust Shopify analytics... Reviews are mixed and sometimes feel fake." Anonymous, r/ShopifyeCommerce Reddit Thread
"Worst customer service I have ever experienced. They show no sign of actually trying to help. What a disgusting company with the prices they charge." Lars Volkers Triple Whale Trustpilot Verified Review
How Most Brands Close The Gap
In our pilots, brands move from 2 or 3 checked boxes to 9 of 9 within the first week. The lift comes from one architectural change, replacing dashboards with a reasoning layer that answers in plain English. ✅ Plug in. ✅ Ask. ✅ Act. The same pattern shows up in what Luca AI does as an AI co-founder for ecommerce.
If you scored below 5, run a 15-minute gap assessment before buying another tool.
Q9. What Does The AI Era Add To Ecommerce BI, Copilots, Anomaly Detection, Agentic Reports, And Simulation? [toc=9. AI Era Capabilities]
The AI era adds four capabilities legacy BI cannot match. Natural-language copilots replace SQL. Anomaly detection surfaces CAC spikes and stockouts before they hit the P&L. Agentic reporting pushes customized briefs to Slack and email on a cadence you set. Simulation models "if I shift €20K to TikTok, what happens to CM3 in 30 days?" Together they collapse a week of analyst work into a 5-second conversation. This is the operating shift behind agentic AI for ecommerce founders.
Capability 1: Natural-Language Copilots
The copilot replaces the dashboard tile and the SQL query. A founder types, "what's my new-customer profit by channel for the last 14 days?" The system pulls from Shopify, Meta, and Google in one pass and returns the answer, the math, and the next move.
Pull-based dashboards wait for you to look. Push-based AI scans the data 24/7 and pings only when it matters.
The system learns your normal patterns over months. It flags only the deviations that cross a real threshold.
What Anomaly Detection Catches
⚠️ ROAS drops below your set threshold
⚠️ Inventory falls below safety stock for top SKUs
💸 CAC spikes above 30-day baseline
⏰ Refund rate jumps above seasonal pattern
💰 Margin erosion on a specific product or channel
Capability 3: Agentic Reporting
This is the unglamorous capability that saves the most time. Set a goal once, and the system generates and pushes the report on the cadence you choose.
Example task: "Send me a Monday 8 AM CAC report by channel, with graphs, reasoning, and recommended budget shifts." It lands in Slack before standup. This is the same loop driving AI for ecommerce cash flow forecasting.
"We were profitable on paper but couldn't fund our next inventory order. Nobody told us our cash conversion cycle was 58 days." Anonymous, r/ecommerce Reddit Thread
Capability 4: Simulation And Scenario Modeling
The fourth capability is the one most analyst teams cannot deliver. Simulation models the downstream cash, margin, and inventory impact of a decision before you make it.
A founder asks, "if I scale this Meta campaign by €15K next week, what happens to my cash position end of month?" The system models ad spend, expected new-customer profit, and inventory drawdown in one pass.
Why This Collapses Decision Latency
Old workflow: pull data, build pivot, ask analyst, wait two days, and decide. New workflow: ask in plain English, and get the answer plus the simulation in seconds.
Kendra Reichenau at Heartland America frames AI as a velocity tool, producing 2 to 3x more decisions and content without growing headcount. ✅ The team that ships decisions fastest wins the quarter. The deeper read sits in what is an AI co-founder for ecommerce.
Where Luca Fits
In our work with operators, we built Luca to do all four out of the box. Plain-English copilot. 24/7 anomaly scanning with Slack and email push. Agentic weekly reports with reasoning. Scenario simulation across marketing, finance, and operations. ✅ Most analytics tools added AI. ✅ Luca is AI.
The comparison anchor is simple. A junior analyst plus a senior data engineer costs €130K to €220K a year. A reasoning layer doing the same work costs under €30K and answers in seconds.
Q10. What Does A Stage-Based Rollout Playbook Look Like, From €1M To €50M? [toc=10. Stage-Based Rollout]
From €1M to €3M, focus on a single source of truth for CM and MER, no warehouse needed. From €3M to €10M, layer cohort retention, automated anomaly alerts, and agentic weekly reports. From €10M to €25M, add scenario simulation and cross-channel attribution. Above €25M, deploy full agentic orchestration with proactive intelligence governing daily decisions. Skip stages and you buy complexity. Skip the playbook and you buy tools you cannot integrate. The same staging logic shapes a sound ecommerce tech stack.
Step 1: €1M to €3M, Get To One Source Of Truth
The job at this stage is clarity, not sophistication. You do not need a warehouse. You need a single layer that connects Shopify, Meta, Klaviyo, and Stripe.
This is where most brands get stuck. The data volume grows, the founder runs out of hours, and the spreadsheet breaks.
⭐ Cohort retention curves by acquisition channel
⭐ Anomaly alerts for CAC, ROAS, and inventory
⭐ Agentic weekly reports with reasoning
⭐ Klaviyo flow performance by RFM segment
Klaviyo's 2025 benchmark report showed scaling brands recover roughly 15 to 25 percent more email-attributed revenue when cohort and RFM data are unified at this stage.
Step 3: €10M to €25M, Layer In Simulation
Now the stakes per decision are six-figure. Scenario modeling earns its keep.
✅ Cross-channel attribution beyond last-click
✅ Scenario simulation for budget shifts and inventory orders
At this scale, the decisions are too many for any single team. Proactive intelligence runs in the background and pings only when human judgment is required.
⭐ Pre-market analysis and seasonal staffing signals
⭐ Automated briefs to every function lead
The Stage-By-Stage Tooling Map
Stage-Based BI Rollout Map
Revenue
Architecture
Reporting Model
Tools
€1M to €3M
Unified reasoning layer
Plain-English queries
Reasoning layer + native source apps
€3M to €10M
Reasoning layer + cohort views
Push alerts + agentic weekly
Reasoning layer + Klaviyo flows
€10M to €25M
Reasoning layer + scenario engine
Simulation + forecasting
Reasoning layer + cross-channel attribution
€25M+
Full agentic orchestration
Continuous monitoring
Reasoning layer + ops forecasting
What Skipping Stages Costs
I have watched €4M brands try to deploy enterprise BI stacks. Six months later, they have a warehouse, two unfinished dashboards, and the same Monday spreadsheet.
In our pilots, brands compress 18-month roadmaps into roughly four weeks because the reasoning layer absorbs the work three separate stages used to require. ✅ Plug in. ✅ Ask. ✅ Act.
Q11. When Insights Surface A Capital Need, How Should You Choose Between Wayflyer, Clearco, 8fig, Stripe Capital, And Luca? [toc=11. Capital Provider Comparison]
It is Sunday night. A bootstrapped founder doing $4M ARR is staring at a Wayflyer renewal offer, a $180K inventory PO due Wednesday, and a cash gap that says yes-or-no by Tuesday morning. The decision is not which tool to use. It is which capital partner will not punish him for taking the money. The deeper read sits in our breakdown of funding to scale ecommerce marketing campaigns.
On capital metrics alone, Wayflyer typically prices at 6 to 12 percent factor fees with 24 to 72-hour disbursal but requires opaque underwriting and UCC filings. Clearco offers similar pricing with slower approvals and a pay-down structure that starts before goods land. 8fig structures dynamic plans but locks weekly remittance. Stripe Capital is fastest for Stripe-native brands but caps offers at platform-volume ceilings. Luca disburses in under 24 hours with dynamically-priced rates tied to live business health, no personal guarantees, and transparent underwriting visible inside the same chat. Operators stress-testing Wayflyer alternatives often land here first.
What Each Provider Charges On The Five Capital Metrics
Capital Provider Comparison On Five CFO Metrics
Provider
Cost of Capital
Disbursal Time
Advance Rate
Personal Guarantee
Underwriting Transparency
Luca
Dynamic, tied to live health
Under 24 hours
Up to 80%
❌ Not required
✅ Visible in chat
Wayflyer
6 to 12% factor fee
24 to 72 hours
Up to 80%
⚠️ UCC filings
❌ Opaque
Clearco
6 to 12% factor fee
1 to 2 weeks
Up to 70%
❌ Not required
❌ Opaque
8fig
5 to 12%, weekly remittance
3 to 7 days
Up to 60%
⚠️ Varies
⚠️ Partial
Stripe Capital
Fixed factor fee
Same day
Capped by Stripe volume
❌ Not required
⚠️ Fixed offer
Where Each One Breaks In The Field
The contracts and the customer-service trail tell the real story. The same patterns surface across Clearco alternatives conversations.
"Read their terms and contract carefully. They said their offer is not secured, which is false, they still will file UCC. They can deem you in default for any reason at their discretion. They can enter your building and take your property in excess of the value of what is owed." Zachary Piech Wayflyer Trustpilot Verified Review
"Clearco vendor financing is a great opportunity to fund inventory purchases, but it comes with 3 material flaws. You immediately start paying off the entire balance even if you have only drawn down a small component." Scott Clearco Trustpilot Verified Review
"We signed a 3M loan deal, only for them to come back two weeks later saying, oops, our C-suite decided to focus on Amazon deals, and slashing our funding to 1M." Xin Shui Uncapped Trustpilot Verified Review
How Luca Competes On Capital Metrics
✅ Disbursal under 24 hours. ✅ Dynamic pricing that re-rates as your business performs. ✅ Up to 80 percent advance rate on eligible revenue. ❌ No personal guarantees. ✅ Underwriting math visible to the operator, not buried in a black-box model. ✅ No weekly remittance trap that pulls cash before goods arrive. The full head-to-head sits in Luca AI vs Wayflyer.
Who Should Pick What
Pick Wayflyer if you are above $5M GMV with clean Meta data and accept UCC filings. Pick Stripe Capital if you process most revenue through Stripe and want a fixed offer. Pick Clearco for non-inventory growth spend if you can wait. Pick 8fig if you want a structured plan and accept weekly remittance. Pick Luca if you want transparent dynamic pricing, fast disbursal, and no personal guarantee.
Q12. What Should You Do On Monday Morning, A 30-Day Action Plan To Move From Fragmented BI To Agentic Reasoning? [toc=12. 30-Day Action Plan]
Week 1: audit your stack against the 9-point checklist and document CM, MER, and CCC baselines. Week 2: connect Shopify, Meta, Stripe, and Xero into a unified reasoning layer and validate against existing dashboards. Week 3: replace one weekly manual report with a proactive anomaly alert and one scenario simulation. Week 4: enable agentic Slack reports and review your first AI-generated executive brief. Disruption: zero. Hours recovered: roughly 40. The framework draws on the same principles behind calculating working capital for ecommerce business needs.
Week 1: Audit And Baseline
Start with the 9-point self-audit from Q8. Score your stack honestly. Document your current numbers.
⭐ Current CM3 by channel (last 30 days)
⭐ Current blended MER
⭐ Current Cash Conversion Cycle in days
⭐ Current hours per week spent on reporting
Week 2: Connect And Validate
Plug your sources into a unified reasoning layer. Validate the numbers against the dashboards you trust.
OAuth integrations for Shopify, Meta, Klaviyo, Stripe, and Xero typically take under 10 minutes. ✅ No SQL. ✅ No data engineer. ✅ No multi-week migration. The same connect-and-validate approach shows up in adding Google Analytics to Shopify.
Week 3: Replace One Manual Report
Pick the report that costs you the most hours every week. Replace it with one anomaly alert and one scenario simulation.
⏰ Alert example: "Ping me if ROAS drops below 1.8 on any campaign with over €500 daily spend."
💰 Simulation example: "If I shift €15K from Meta to Google next week, what is the 30-day CM3 impact?"
Week 4: Turn On Agentic Reports
Set the cadence. Pick the channels.
⭐ Monday 8 AM Slack: weekly CM3 by channel with reasoning
Two questions come up every time. Both have clean answers.
✅ Data security: SOC 2 Type II, AES-256 encryption at rest and in transit, GDPR compliant, no model training on your data
✅ Switching cost: 10-minute OAuth, no migration, run parallel to existing dashboards for 30 days
Read the full privacy policy for the underwriting and data-handling specifics.
What 30 Days Looks Like, Side By Side
30-Day BI Transformation Outcomes
Metric
Week 0
Week 4
Hours on reporting
12 to 15
1 to 2
Time to answer "CM3 by channel"
30 to 60 minutes
Under 60 seconds
Anomaly detection lead time
7 to 14 days late
Real-time
Decisions per week
3 to 5
8 to 12
In our pilots, brands recover 10 to 15 hours a week and catch margin leaks 2 to 3 weeks earlier than manual monitoring. The work was always there. The architecture was the bottleneck.
What I'm Thinking About Next
I keep coming back to one question. By 2027, will the BI stack still be a "tool" the operator opens, or will it have collapsed into a teammate the operator chats with?
My read right now is the second. The brands that already replaced dashboards with reasoning are not slowing down. They are deciding faster, sleeping better, and hiring fewer analysts. ⏰ The window where "BI" means a dashboard subscription is closing.
I could be off on the timing. But the direction feels settled.
If you are running a Shopify store between €1M and €50M and want to compare your current stack against the 9-point audit, I will read the email. ✅ Send me your Monday spreadsheet. ✅ I will tell you which two of the nine you can fix this week. Drop us a note and we will run the assessment together.
FAQ's
What is ecommerce business intelligence in 2026, and how is it different from traditional analytics dashboards?
We define ecommerce business intelligence in 2026 as a reasoning layer that sits over a unified warehouse and answers founder questions in plain English, not a dashboard you open on Monday morning.
The shift is architectural, not cosmetic. Traditional dashboards display history. A reasoning layer runs root cause analysis, simulates scenarios, surfaces influencing components, and pushes agentic reports to Slack and email automatically.
Old model: SQL queries, pivot tables, and static tiles
New model: conversational queries, RCA, simulation, and 24/7 anomaly detection
Outcome shift: from displaying numbers to explaining and acting on them
We built Luca to behave as that reasoning layer for DTC operators between €1M and €50M. The deeper architectural read sits in our piece on what an AI co-founder for ecommerce actually does. The bottom line is simple. Most analytics tools added AI last year. The reasoning-layer category was built as AI from day one.
Why does my BI stack feel broken after we crossed €3M in revenue?
We see this pattern weekly. At €1M, founders can hold the data in their head. By €3M, the cracks become structural and expensive.
The root cause is vertical-by-design tooling. Meta sees ads. Shopify sees orders. Klaviyo sees email. Xero sees cash. None of them reason across the others, so the founder becomes the manual integration layer.
10 to 15 hours weekly lost to reconciliation across the leadership team
15 to 20 percent disagreement between platform-reported and actual revenue
Inventory distortion that erodes roughly 6 percent of revenue across global retail
Decision drift, where leaders default to gut feel because numbers conflict
The fix is not another vertical app. It is a horizontal reasoning layer that normalizes data on ingestion and answers cross-functional questions instantly. We unpack the pattern more deeply in why ecommerce founders are drowning in data. Operators evaluating their architecture against ours typically score 2 or 3 on our 9-point audit before they upgrade.
Should contribution margin or ROAS sit at the apex of our KPI hierarchy?
We place CM3, contribution margin after ad spend, at the apex. ROAS belongs as a diagnostic tile, not a decision metric.
Channel ROAS distorts every meaningful tradeoff because it ignores returns, fulfillment, agency fees, and halo effects. CM3 is the only number that ties a marketing decision to a P and L line.
Apex: CM3, refreshed daily
Strategic: MER and new-customer profit
Leading: LTV/CAC by cohort and 90-day retention
Constraint: Cash Conversion Cycle and Days of Inventory
Diagnostic: channel ROAS, CTR, and AOV
Brands that promote CM3 to apex stop chasing ghost ROAS within two weeks. The ones who keep ROAS at the top keep firefighting. We extend the read in our breakdown on tracking ecommerce unit economics. The hierarchy is not academic. It decides what the leadership team argues about every Tuesday morning.
Build versus buy: when does a custom warehouse and analyst team beat an AI-native reasoning layer?
We have run this math across pilots and operator conversations. For 95 percent of DTC brands under €50M, AI-native reasoning layers beat custom builds on every axis that matters.
A custom stack with Fivetran, dbt, BigQuery, and a two-person analytics team costs €180k to €350k in year one before delivering a single decision. An AI-native reasoning layer delivers answers in week one for under €30k annually.
Build only when proprietary algorithmic IP justifies it
Buy when decision latency, not headcount, is the bottleneck
Score options across data sources, query model, RCA, simulation, anomaly detection, setup time, and TCO
The cautionary tale is Ari Tulla at ELO Health, whose 10 million dollar custom platform was rebuilt on a general reasoning engine that delivered roughly 10x better forecasting. The deeper read sits in agentic AI for ecommerce founders. The right question is not build or buy. The right question is how fast does our decision latency get below one day.
How should we choose between Wayflyer, Clearco, 8fig, Stripe Capital, and Luca when insights surface a capital need?
We evaluate capital partners on five metrics, not marketing pages: cost of capital, disbursal time, advance rate, personal-guarantee terms, and underwriting transparency.
Wayflyer: 6 to 12 percent factor fees, 24 to 72-hour disbursal, opaque underwriting, UCC filings
Clearco: similar pricing, slower approvals, payback starts before goods land
8fig: dynamic plans, weekly remittance lock
Stripe Capital: fastest for Stripe-native brands, capped by platform volume
Luca: under 24-hour disbursal, dynamically-priced rates tied to live business health, no personal guarantees, transparent underwriting visible in chat
The contracts and customer-service trail tell the real story, and Trustpilot reviews on Wayflyer, Clearco, and Uncapped echo the same patterns operators flag in private. We compare the alternatives in Wayflyer alternatives and Luca AI vs Wayflyer. Pick the partner that matches your GMV, your remittance tolerance, and your appetite for personal guarantees.
Enjoyed the read? Join our team for a quick 15-minute chat — no pitch, just a real conversation on how we’re rethinking Ecommerce with AI - Luca
Loading Schedule...
Your AI Co-Founder is here.
Here’s why:
Shopify, Meta, Xero - one brain.
"Should I scale?" Answered with real data.
Growth capital. No applications. One click.
Thank you! Your submission has been received! Please book a time slot for the Meeting
Oops! Something went wrong while submitting the form.