
Q1. What Are the 6 Best Omnichannel Analytics Platforms for E-commerce in 2026? [toc=1. The 6 Best Platforms]
Most founders I talk to spend Monday morning doing the same thing: exporting Shopify orders, pulling a returns CSV, and rebuilding the same pivot table just to answer one question, "am I actually making money on my hero SKU?" That is two days and three spreadsheets to reach a number the business already knew on Friday. The six best omnichannel analytics platforms for e-commerce in 2026 are Luca AI (best for cross-functional intelligence), Triple Whale (best for DTC attribution), Northbeam (best for marketing-mix modeling), StoreHero (best for profit coaching), Polar Analytics (best for no-code dashboards), and Improvado (best for enterprise pipelines). An omnichannel analytics platform pulls data from every channel into one place, so you measure true performance instead of triangulating exports at 11pm.
📊 The 6 Best Platforms at a Glance
Here is the shortlist, each tied to the job it does best, not the feature list it markets.
- 1.1 Luca AI Best for cross-functional intelligence across marketing, finance, and ops
- 1.2 Triple Whale Best for DTC marketing attribution
- 1.3 Northbeam Best for marketing-mix modeling and paid-media allocation
- 1.4 StoreHero Best for profit coaching and contribution-margin visibility
- 1.5 Polar Analytics Best for no-code cross-channel dashboards
- 1.6 Improvado Best for enterprise data pipelines and agency reporting
⭐ How I'd Rank Them Against the Category Shift
The biggest move I see in e-commerce data right now is from monitoring to recommending. Most tools still hand you a dashboard and leave the "go right or go left" decision to you. I built Luca to make the call, not just draw the chart, which is why it sits at the top of a list I am admittedly close to. The rest of the field is strong, and I'll show you exactly where each one wins.
📋 Comparison Table: 6 Best Omnichannel Analytics Platforms
Read the table by your stage, not by the star count. A lean brand under $1M cares about setup speed and profit clarity, while a mid-market team with data engineers cares about pipeline control. The star rating reflects our scoring rubric (explained next), but "best for you" depends on the job in front of you this quarter.
1.1 Luca AI, Best for Cross-Functional Intelligence [toc=1.1 Luca AI]

Luca AI is the world's first AI Co-Founder for e-commerce: an AI layer that sits over your unified data warehouse, surfaces the exact data a situation needs, predicts from history, simulates scenarios, and finds the root cause behind a metric move. Most analytics tools added AI as a feature. Luca is AI from the ground up. You ask a question in plain English, and it answers with reasoning and a recommendation, not another chart to interpret.
😊 Why Did We Choose This Tool?
I'll be honest about the bias here, because you'd spot it anyway. I'm the founder, so Luca leads a list I wrote. But I put it first for reasons that hold up without me.
We spent about $10 million building a system to turn raw data into meaning, then watched large language models get 10 times better at it than we could. So we rebuilt Luca around what actually works: one place that connects every source, reasons across marketing, finance, and operations, and tells you what to do. Most tools show you the numbers. Luca digests them and hands you the decision.
📊 Core Capabilities We Evaluate Across This List
Here are the metrics I use to judge every tool on this list, applied to Luca first so the standard is consistent.
- Cross-functional reasoning: Connects marketing, finance, and ops in one query.
- Data unification: Single source of truth across Shopify, Meta, and Xero.
- Proactive alerts: Scans 24/7, pings on ROAS dips or CAC spikes.
- Setup and usability: Plain English, no SQL or dashboard-building.
- Predictive depth: Forecasts, simulations, and root-cause analysis.
✅ Best For
- Industry: DTC and mid-market e-commerce brands on Shopify, WooCommerce, or BigCommerce.
- Size and stage: Scaling brands drowning in dashboards, roughly $1M to $50M in revenue.
- Requirements: Teams who want answers and recommendations, not more reporting surface area.
⚠️ When Luca Is Not the Right Fit
I'd rather tell you upfront. If you're a sub-$10K MRR store, you don't yet have the data volume for Luca to reason against. Pure B2B or marketplace-only sellers will also get less value, since Luca is built around the omnichannel DTC data model. No tool fits everyone, and this one doesn't either.
❤️ Case Study: A Skincare Brand's Hidden SKU Problem
The problem: A fast-growing DTC skincare brand (mid-seven figures, Shopify Plus, heavy Meta spend) thought its bestselling category was steady year on year. It wasn't. One category had quietly collapsed from $20K to $5K, while another rose and masked the drop in blended numbers.
How Luca helped: We connected Shopify, Meta, and their accounting data into one layer, then ran a root-cause query across categories and cohorts. Luca surfaced the switch in days, not the three-week buying-cycle grind it used to take.
The outcome: The team rebuilt its fall buying plan around the real category mix and stopped over-ordering the declining line, freeing cash tied up in dead inventory. 💰
💰 Pricing
[ Starter, €299 / Month | Growth, €499 / Month | Scale, Custom Pricing ]
1.2 Triple Whale, Best for DTC Marketing Attribution [toc=1.2 Triple Whale]
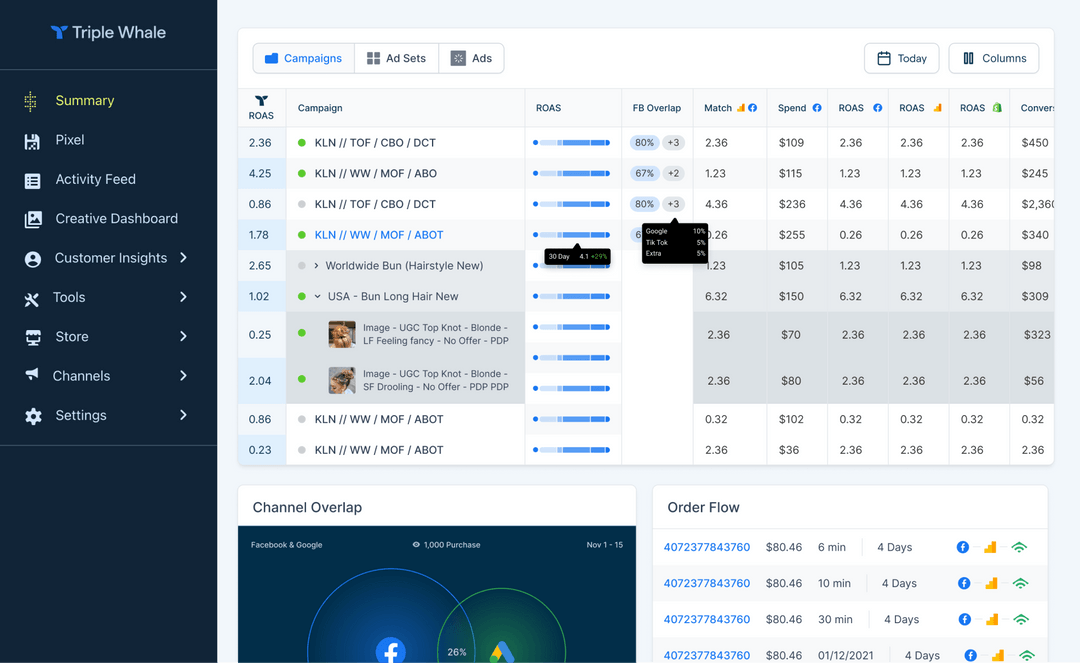
Triple Whale is the tool most DTC operators reach for when they want to see which ad actually drove the sale. It uses a first-party pixel to stitch together Shopify and ad-platform data, then shows attribution and a daily profit view in one dashboard. For marketing attribution, it's a genuine category leader, and I won't pretend otherwise.
😊 Why Did We Choose This Tool?
Triple Whale earns its spot because it solved the post-iOS-14 attribution mess better than most. Operators trust its cross-channel view, and the first-party pixel gives cleaner data than platform-reported numbers alone. It is the honest default for a brand whose main question is "which channel is working right now?" If it isn't your fit, our guide to Triple Whale alternatives is worth a look.
📊 Core Capabilities We Evaluate Across This List
The same five metrics I applied to Luca, applied here.
- Cross-functional reasoning: Strong on marketing, limited on finance and ops.
- Data unification: Connects Shopify and ad platforms; weaker on accounting.
- Proactive alerts: Custom metric alerts available.
- Setup and usability: Quick Shopify install, friendly UI.
- Predictive depth: Attribution and MMM focus, not full simulation.
✅ Best For
- Industry: DTC brands running heavy Meta, Google, and TikTok spend.
- Size and stage: Growth-stage brands from roughly $500K to $20M in revenue.
- Requirements: Teams whose top priority is marketing attribution, not cash-flow visibility.
⭐ Reviews
"I love how seamlessly it connects our ad platforms and CRM data, showing exactly where our conversions come from and which campaigns drive the most revenue. Its made attribution so much clearer."
Verified User Triple Whale G2 Verified Review
"Some data we still notice discrepancies between platforms, for example, tracking ads, and differences in the reported metrics like revenue. Or with our emails/sms platforms about what revenue is attributed to which channel."
Verified User Triple Whale G2 Verified Review
💰 Pricing
$129 / Month, $499+ / Month
1.3 Northbeam, Best for Marketing-Mix Modeling [toc=1.3 Northbeam]
⭐ Why Did We Choose This Tool?
Northbeam sits on this list because it does one hard thing well: media-mix modeling for brands spending real money on paid ads. It blends multi-touch attribution (tracking every click across the journey) with statistical modeling to guide where the next ad dollar should go. If you are spending $50K or more a month on paid, this is a serious media-buying brain. I respect the depth here, and I will be honest about the price of entry.
📊 Key Capabilities (How We Evaluate Analytics Platforms)
- Cross-functional reasoning: Deep on paid media; light on finance and operations.
- Plain-English querying: Reporting is dashboard-driven, not conversational.
- Prediction and simulation: Marketing-mix modeling retrains on a regular cadence.
- Proactive alerts: Performance views focused on channel efficiency.
- Scheduled reports: Attribution and media dashboards for buying decisions.
✅ Solutions Offered
- First-party, machine-learning attribution across paid channels.
- Marketing-mix modeling for spend allocation.
- View-through and click attribution for media buyers.
- Integrations with major ad and e-commerce platforms.
- Performance reporting built for paid-media teams.
💬 Reviews
"Northbeam is easy to use once set up, integrates smoothly with ad and ecommerce platforms, and offers strong attribution and performance features."
Verified User Northbeam G2 Verified Review
"Northbeam's pricing is not cheap and reflects their focus on mid-size and larger brands."
Verified User Northbeam G2 Verified Review
⚠️ Where It Stops
The pricing floor tells you the intended buyer. Starter plans begin around $1,500 a month, which prices out most sub-$5M brands. And like other attribution-first tools, it answers where clicks came from, not whether the order made money after shipping, fees, and returns. That is the finance gap the whole category shares, and it is exactly why true profitability matters more than platform ROAS.
🎯 Best For
- Industry and size: Scaling DTC brands spending $50K+/month on paid media.
- Data source and volume: Multi-channel advertisers across Meta, Google, and TikTok.
- Requirements: Teams that need media-mix modeling over profit accounting.
💰 Pricing
$1,000 / Month, Custom
1.4 StoreHero, Best for Profit Coaching [toc=1.4 StoreHero]
⭐ Why Did We Choose This Tool?
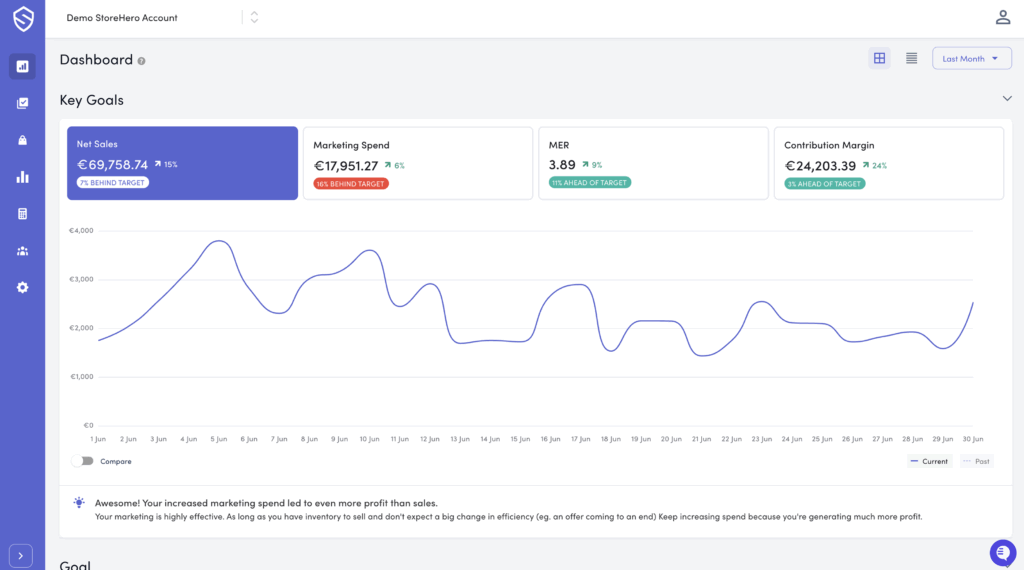
StoreHero earns its spot because it leads with profit, not vanity metrics. It centers on contribution margin (revenue left after variable costs like COGS, shipping, and fees) and pairs the software with profit coaching. For a founder tired of celebrating revenue that never reaches the bank, that framing lands. It is the closest tool on this list to talking about unit economics honestly, and I like that it starts there.
📊 Key Capabilities (How We Evaluate Analytics Platforms)
- Cross-functional reasoning: Strong on profit and commerce; lighter on full finance stack.
- Plain-English querying: Dashboard-led with guided coaching support.
- Prediction and simulation: Focused on margin and blended-metric tracking.
- Proactive alerts: Profit-focused metric monitoring.
- Scheduled reports: Contribution-margin and blended performance views.
✅ Solutions Offered
- Contribution-margin tracking across the store.
- Blended CAC and MER (marketing efficiency ratio) visibility.
- Profit coaching alongside the software.
- Shopify and ad-platform connections.
- Unit-economics dashboards for operators.
🎯 Best For
- Industry and size: Early to mid-stage DTC brands under $5M focused on profit.
- Data source and volume: Shopify stores wanting margin clarity fast.
- Requirements: Operators who value coaching plus contribution-margin tracking.
If you want to go deeper on the metric itself, our breakdown of contribution margin versus gross margin explains why profit-first tools matter, and our guide to e-commerce profit margins covers the costs that quietly erode them.
💰 Pricing
$99 / Month, Custom
1.5 Polar Analytics, Best for No-Code Dashboards [toc=1.5 Polar Analytics]
⭐ Why Did We Choose This Tool?
Polar Analytics is the no-code dashboard play, built only for e-commerce and DTC brands. You connect your channels and get clean dashboards on revenue, CAC, LTV, and cohorts without needing a data team. For an operator who wants fast visibility and hates building reports, that speed is the draw. It stays in its lane, and it does that lane well.
📊 Key Capabilities (How We Evaluate Analytics Platforms)
- Cross-functional reasoning: Strong on marketing and commerce; not a finance system.
- Plain-English querying: No-code setup, with dashboard-first navigation.
- Prediction and simulation: Cohort and trend analysis rather than deep forecasting.
- Proactive alerts: Custom metric alerts across channels.
- Scheduled reports: Customizable cross-channel dashboards.
✅ Solutions Offered
- No-code dashboards for e-commerce metrics.
- Cross-channel connectors in one view.
- CAC, LTV, and cohort analysis.
- Custom metrics and alerts.
- Multi-channel attribution reporting.
💬 Reviews
"Polar Analytics is built for one audience: eCommerce and DTC brands, focusing on the metrics that matter to online retailers."
Verified User Polar Analytics G2 Verified Review
"With GMV-based pricing starting at $720/month, it's a premium tool that only makes sense at certain scales."
Verified User Polar Analytics G2 Verified Review
⚠️ Where It Stops
Here is the honest read. Polar gives you great dashboards fast, but dashboards are still the ceiling. You get clean views, then you still have to interpret them and decide what to do. GMV-based pricing also climbs as you grow, so the cost scales with your success. If you would rather compare the wider field, our roundup of e-commerce analytics dashboards is a good next stop.
🎯 Best For
- Industry and size: DTC brands wanting dashboards without a data hire.
- Data source and volume: Multi-channel Shopify stores at mid-scale.
- Requirements: Teams prioritizing setup speed over conversational analysis.
💰 Pricing
$300 / Month, Custom
1.6 Improvado, Best for Enterprise Data Pipelines [toc=1.6 Improvado]
⭐ Why Did We Choose This Tool?
Improvado is the enterprise and agency workhorse of this list. It is an ETL platform (extract, transform, load) that pulls data from dozens of sources into one warehouse for reporting at scale. If you are an agency juggling many clients or a large brand moving big data volumes, this is built for you. It is powerful, and it expects a technical hand on the wheel.
📊 Key Capabilities (How We Evaluate Analytics Platforms)
- Cross-functional reasoning: Broad connectors; you build the logic yourself.
- Plain-English querying: Pipeline-driven, not conversational.
- Prediction and simulation: Depends on your downstream warehouse and BI tools.
- Proactive alerts: Limited native alerting; depends on setup.
- Scheduled reports: Feeds dashboards in Looker, Data Studio, and BigQuery.
✅ Solutions Offered
- ETL data extraction from dozens of platforms.
- Cross-platform data transformation and manipulation.
- Warehouse integration for downstream BI.
- Agency and multi-client reporting at scale.
- Customizable data pipelines.
💬 Reviews
"The easines with which we can set data extractions from different platforms. That users can be onboarded easily. Good customer suppor when tickets are created."
Verified User Improvado G2 Verified Review
"There is a steep learning curve, and if you arent familiar with databases, Excel, and data transformations, this could be a really tough software to implement."
Verified User Improvado G2 Verified Review
⚠️ Where It Stops
Improvado moves data beautifully, but it does not reason over it. It hands you clean pipes, then you still need analysts, dashboards, and time to turn that into a decision. Reviewers repeatedly flag the steep learning curve for non-technical teams. It is infrastructure, not an answer, which is where a true e-commerce data integration layer changes the game.
🎯 Best For
- Industry and size: Enterprise brands and agencies with data teams.
- Data source and volume: High-volume, multi-source reporting environments.
- Requirements: Teams needing pipelines over out-of-the-box insight.
💰 Pricing
Custom (enterprise)
🧭 Reading the Full List
Here is the pattern I want you to notice across all six. Triple Whale, Northbeam, StoreHero, and Polar each own a slice: attribution, media mix, profit, or dashboards. Improvado owns the plumbing. Every one of them still leaves you triangulating the finance picture yourself, which is the core problem an e-commerce business intelligence layer is meant to solve.
That gap is the whole reason we built Luca as an AI layer over a unified warehouse, not another dashboard. Instead of showing you the numbers and walking away, it reads across marketing, commerce, and finance, then tells you the decision and the reason behind it. The other tools describe. Our bet for 2026 is that operators want a tool that recommends, and you can see how Luca handles those use cases directly.
Q2. How Were These Platforms Selected? (Our Scoring Criteria) [toc=2. Scoring Criteria]
Each platform was scored against five weighted criteria totaling 100%: Cross-Functional Intelligence (30%), Data Accuracy and Integration Reliability (25%), Setup and Usability (20%), Pricing Transparency (15%), and Predictive and Agentic Capability (10%). Scores convert to stars, where 0 to 20 earns 1 star, 21 to 40 earns 2, 41 to 60 earns 3, 61 to 80 earns 4, and 81 to 100 earns 5.
🧭 Why These Five Criteria
I weighted Cross-Functional Intelligence highest for a reason I have watched play out. You run an e-commerce business on two train tracks: inventory on one side, cash on the other. Those tracks have to move in parallel, and a tool that sees only marketing cannot keep them aligned.
Data accuracy sits second because a wrong number costs you a real decision. Operators flag this constantly, like the GA4 users who told G2 the data "just cannot be trusted" once they scaled. Usability, pricing clarity, and predictive depth round out the rest, and each maps to a core e-commerce KPI that actually moves the business.
📊 The Scoring Rubric
⭐ How Stars Are Assigned
The math is simple, and I kept it that way on purpose. A tool's weighted score maps straight to the star band above, so nothing is hidden behind a vibe.
Luca AI anchors the 5-star position because it scores full marks on Cross-Functional Intelligence and Predictive and Agentic Capability. Using AI to reason across data silos is where the real value shows up, which is the heart of true e-commerce business intelligence. I built the rubric to be honest first, and Luca happens to win the criteria I care most about.
Q3. Why Are Gross Margin and ROAS Lying to You, and What Should You Track Instead? [toc=3. Metrics That Lie]
Gross margin only tells you what it costs to make a product, not what it costs to sell it. The costs sitting between the supplier invoice and actual profit are where brands quietly bleed. ROAS (return on ad spend) is just as incomplete. Track true net contribution per SKU instead, including shipping, fees, and returns, so you stop steering by vanity numbers.
💸 The Two Metrics Every Founder Trusts
Most founders I know make decisions on gross margin and ROAS. Both feel precise. Both are lying to you by omission.
Gross margin ignores the pile of costs that hit after production: payment fees, shipping, returns, discounts, and more. ROAS tells you an ad drove revenue, not whether that order made money after all of it, which is why platform ROAS and true profitability so often disagree.
⚠️ The Blended-Averages Trap
Here is where it breaks. When shipping is blended across every product, a heavy or bulky SKU can quietly lose money while the average looks fine. I have watched an operator discover their real per-SKU shipping was nothing like the blended number they trusted.
Reddit is full of this exact pain. Operators outgrow attribution-first tools because Shopify reports shipping at the order level, not per line item, a gap our guide to e-commerce profit margins breaks down in detail.
"Some data we still notice discrepancies between platforms, for example, tracking ads, and differences in the reported metrics like revenue. Or with our emails/sms platforms about what revenue is attributed to which channel, for example, Triple Whale will attribute more revenue to the email that was sent out, but the platform will attribute more revenue to the SMS that was sent out."
Verified User Triple Whale G2 Verified Review
✅ Track Net Contribution Per SKU Instead
The metric that actually decides your business is net contribution per SKU: what you keep after every variable cost. Getting there needs commerce data and accounting data in the same place, which is exactly the cross-silo problem most tools skip. If the distinction is fuzzy, our explainer on contribution margin versus gross margin makes it concrete.
This is where Luca's analytics layer earns its keep. It computes net contribution per SKU from a unified warehouse, then names the cost component dragging a product down. A calculation that used to take two days now takes minutes, the kind of predictive analysis that changes a buying decision.
Q4. What Is an AI-Layer Analytics Platform, and How Is It Different From a Dashboard? [toc=4. AI Layer vs Dashboard]
An AI-layer analytics platform sits over your unified data warehouse and does what a dashboard cannot. It extracts the data relevant to your exact question, predicts from history, simulates scenarios, finds root causes, and surfaces the areas to fix. It also pushes customized reports to Slack or email on a schedule. Think of it as an analyst that reads the data so you do not have to.
🧠 The Simple Version
A dashboard shows you numbers. You still have to read them, connect them, and decide what to do. An AI layer digests the same data and hands you the reasoning.
Here is the honest part about dashboards. They were often built to look impressive, and humans are bad at digesting raw metrics at scale. Reviewers say it plainly, like GA4 users who now have to build "all of your own reports" by hand, a frustration our Shopify analytics dashboard guide addresses head-on.
🔎 Why This Is a Different Category
Picture a category that quietly collapsed from $20,000 to $5,000 in sales, while another product rose and masked the drop. A dashboard showed every number involved, and the team still missed it. The numbers were visible; the decision was not.
That gap is the whole point. An AI layer connects the sources first, then reasons across them to catch the thing you would never scroll to. Think of a brilliant new hire with a PhD who still needs onboarding and context before they add value; the AI layer needs a single source of truth for the same reason, which is what proper e-commerce data integration delivers.
⚙️ What the AI Layer Actually Does
These are the capability pillars, in plain terms.
- Extract and present the data relevant to a specific situation.
- Predict from your historical patterns.
- Simulate scenarios before you commit spend or inventory.
- Root-cause a metric move and name the influencing components.
- Find both the areas to improve and the ones already working well.
This is Luca's home turf. You ask in plain English, get a reasoned answer or a simulation, and let it push scheduled reports to Slack or mail, the kind of workflow our agentic AI for e-commerce founders guide walks through. It watches the data 24/7 so you can watch something else, and you can see how Luca handles these use cases directly.
Q5. How Do the Top Platforms Handle Attribution, Data Accuracy, and Privacy? [toc=5. Accuracy & Attribution]
Accuracy is the biggest trust gap in this category. Multi-touch attribution (a model that tracks every click across the buying journey) follows what customers click, not who they are, so it is not truly customer-centric. Triple Whale users praise the usability but flag sync discrepancies and cross-channel revenue mismatches. The strongest 2026 platforms lean on clean, standardized data ingestion and server-side tracking, not a single pixel.
⚠️ Why Accuracy Decides Everything
If the number is wrong, every decision downstream is wrong too. You cut a winning ad or scale a losing one, and you do not find out for weeks.
I will say the quiet part plainly: multi-touch attribution is not customer-centric. It tracks clicks, not people, so your best repeat buyers can get flattened into a channel line, which is why reliable e-commerce conversion tracking matters more than any single dashboard.
🔎 Where the Trust Breaks
Peer reviews tell the story better than any vendor page. Operators love the daily view, then hit sync gaps at the worst moment.
"Sometimes it does not update the numbers correctly and has errors with synchronisation."
Verified User Triple Whale G2 Verified Review
"To make decisions based on grounded data, it is really difficult to trust it 100%, it complicates decision-making."
Verified User Google Analytics G2 Verified Review
Here is the tactical truth. Most bad AI output comes from feeding it messy, uncleaned data, which is just laziness at the ingestion step. Fix the data first, and attribution arguments matter far less, a principle at the core of solid e-commerce data management.
✅ What Good Looks Like in 2026
The best platforms standardize data on ingestion and use server-side tracking to survive a cookieless web. No tool is a flawless single source of truth, and anyone claiming otherwise is selling.
For the SKU-level profit question, the honest answer is this. If you have outgrown attribution-first tools, you want a layer that cleans COGS, shipping, and fees before it reasons, which is exactly why founders explore Triple Whale alternatives as they scale.
Luca is not an attribution or pixel tool, and I want to be clear about that. We normalize and standardize data on ingestion, so you skip the data-cleanup year, and every prediction or root-cause runs on clean data through proper e-commerce data integration. That is analytics accuracy, not attribution.
Q6. Which Platforms Also Offer Growth Capital, and How Do the Terms Compare? [toc=6. Capital & Terms]
A few platforms pair analytics with growth capital, but for a capital decision, only the capital terms matter: the rate, disbursal time, repayment flexibility, and funding cap. Traditional revenue-based financiers (lenders who advance cash against future sales) price off commerce data and earn more on bigger advances. Performance-based models price each advance to your current health, disburse fast, and let you draw smaller amounts so capital never sits idle.
💰 The Conflict Hiding in Traditional RBF
Here is the structural problem with most revenue-based financing. The lender makes more money on a larger advance, so the incentive is to push more capital than you need.
Ask a traditional financier for 300,000 euros, and the reflex is "why not 400,000 euros?". That capital then sits idle, and idle capital still carries a cost. Slow underwriting makes it worse, because the cash arrives after the moment you needed it, a dynamic our guide to revenue-based financing unpacks in full.
💸 Compare Capital on Capital Metrics Only
Judge every option strictly on the numbers that define the money itself. Do not let a shiny dashboard sway a funding decision.
Luca's capital works on capital terms alone. Advances are dynamically priced to your real-time business health, disbursed fast, and drawn in smaller amounts so money is never sitting idle, with no equity given up. Cost and speed are the whole pitch here, nothing else.
Q7. Which Platform Fits Your Stage, and What Should You Do This Monday? [toc=7. Your Stage & Next Step]
There is no single winner; fit depends on your stage. Early DTC brands under $1M need clean profit visibility and low setup, so StoreHero or Polar Analytics fit. Scaling brands drowning in dashboards need an AI layer with proactive alerts, like Luca or Triple Whale. Mid-market teams with data engineers may want pipeline control from Improvado. This Monday, move your exports into one warehouse layer and standardize your lookups first.
🎯 Match the Tool to Your Stage
Pick for the job in front of you, because if you do not specialize, you fall behind.
- Under $1M (startup): StoreHero or Polar for fast profit clarity. Do not buy enterprise pipelines you cannot staff. Our roundup of the best Shopify analytics apps helps here.
- Scaling, dashboard overload: Luca for an AI layer that reasons and alerts; Triple Whale if attribution is your only job. Skip Luca under $10K MRR; you lack the data volume.
- Mid-market with engineers: Improvado for pipeline control through robust e-commerce API integrations. Do not expect out-of-the-box answers without analysts.
⚠️ One Honest Caveat
If you sell brand-led fashion, do not get so data-driven that you lose the emotional side. People do not buy a jacket on a one or a zero.
I will own a scar here too. We once ran a native AI feature that hallucinated forecasts, and we shut it down rather than ship numbers you could not trust. Trust is the whole product, which is why agentic AI for e-commerce founders has to be built on clean data.
⏰ Your Monday Action Plan
- Move your Shopify and channel exports into one warehouse layer.
- Standardize your lookups and cost fields before any AI analysis.
- Make net contribution per SKU your decision metric this week, using our guide to e-commerce profit margins.
That is the routine Luca was built to replace, so your team spends Monday generating insight, not assembling spreadsheets through better e-commerce reporting. So tell me, what does your Monday morning actually look like right now, and which number takes you longest to trust? You can see how Luca handles these use cases directly.




