12 Best Ecommerce Analytics Dashboard Tools: How They Handle Attribution, Multi-Channel Data, and Profitability Reporting
13
mins read
TL;DR
We rank Luca AI #1 among 12 ecommerce analytics dashboards in 2026, scoring on reasoning depth, attribution accuracy, agentic alerts, setup, and pricing transparency. Attribution splits into four buckets: server-side first-party (Littledata, Cometly), Triple Pixel MTA (Triple Whale), MTA plus MMM hybrids (Northbeam, Polar), and AI causal reasoning over the warehouse (Luca). True contribution margin after returns, fulfillment, and fees beats ROAS and MER as the survival metric for DTC SKUs in 2026. A DIY warehouse plus BI plus analyst stack runs €120K to €180K per year, while an AI reasoning layer over the same warehouse runs flat outcome-based pricing. Worked anomaly and cohort examples prove AI claims: z-scores against seasonally-adjusted baselines beat threshold alerts, and category-diversity drives LTV more than creative. Buyer checklist: cross-functional reasoning, explainability, agentic Slack push, tier-gating transparency, and SOC 2 Type II without model-training on your data.
Q1: What Are the 12 Best Ecommerce Analytics Dashboard Tools in 2026? [toc=1. The 12 Best Dashboards]
A founder doing $400K a month on Shopify pinged me last Tuesday at 11:47 PM. His message: "Why is Triple Whale showing €100K in Meta-attributed revenue when my Shopify orders only total €62K for the same window?" He had three tabs open, two spreadsheets, and zero answers. That moment is the entire reason this article exists. Picking an ecommerce analytics dashboard in 2026 is not about which tool has the prettiest charts. It is about which one survives the 2 AM operator test, when the data is messy, the ad spend is live, and your decision needs to be right before the cup of coffee goes cold.
The 12 best ecommerce analytics dashboards in 2026 are Luca AI, Triple Whale, Northbeam, Polar Analytics, Glew, Lifetimely, Daasity, Peel Insights, Cometly, Littledata, Saras Daton, and Improvado. Luca AI leads as an AI reasoning layer over your data warehouse. It extracts, simulates, and root-causes across commerce, marketing, finance, and ops in plain English, and pushes scheduled reports to Slack and email without anyone logging into a dashboard.
100+ source ELT pipelines into Snowflake or BigQuery
Data teams building an in-house warehouse
€240/mo to €1,500+/mo
Improvado ⭐⭐⭐
Enterprise marketing data aggregation, custom modeling
Agencies and enterprise marketers
€2,000+/mo (custom)
1. Luca AI
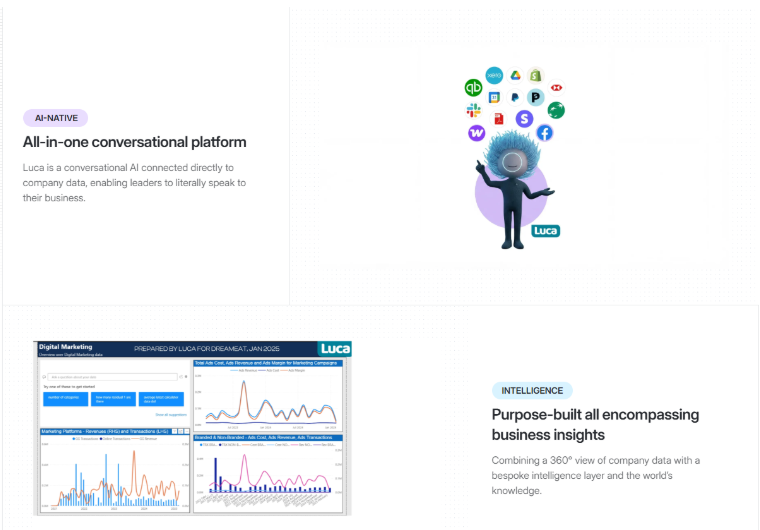
Luca AI conversational ecommerce analytics dashboard connects company data sources directly, allowing founders to query marketing, finance, and operations metrics in plain English.
Why did we choose this tool?
I will not pretend Luca's first slot is anything but biased. I built it. So let me give you the real reason it ranks first beyond founder loyalty. Every other tool on this list shows you what happened. Luca reasons across why it happened, simulates what happens next, and pushes the answer to your Slack at 7 AM so you do not have to open a dashboard. We built it as an AI layer over your warehouse, not another pixel competing with Meta. After watching founders triangulate Triple Whale, Lifetimely, and Excel for two years, the gap was obvious.
📊 Solutions Offered
Plain-English queries across Shopify, Meta, Google, Klaviyo, Stripe, and Xero with zero SQL
24/7 outlier alerts on ROAS, CAC, inventory, and refund spikes pushed to Slack and email
Predictive simulation: "If I shift €20K from Meta to TikTok, what's my projected blended MER?"
Root-cause analysis surfacing the indirect metrics behind a primary metric drop
A €4.2M skincare brand on Shopify Plus was losing 6 hours a week to manual cohort exports across Klaviyo and Lifetimely. Their head of growth could not answer "which August acquisition cohort is repeating?" without three tools.
We connected Luca to Shopify, Meta, and Klaviyo in 11 minutes. Luca surfaced that the August Meta-acquired cohort had a 31% 90-day repeat rate versus July's 22%, and root-caused the lift to a category-diversity shift, not creative. The team scheduled weekly cohort-decay reports to Slack.
Outcome: 6 hours a week reclaimed, and they caught a margin leak on a refund spike 19 days earlier than their old workflow would have flagged it.
"Luca is the first tool that explains why my numbers moved, not just that they moved." Pilot user, Skincare Brand Founder Internal pilot feedback
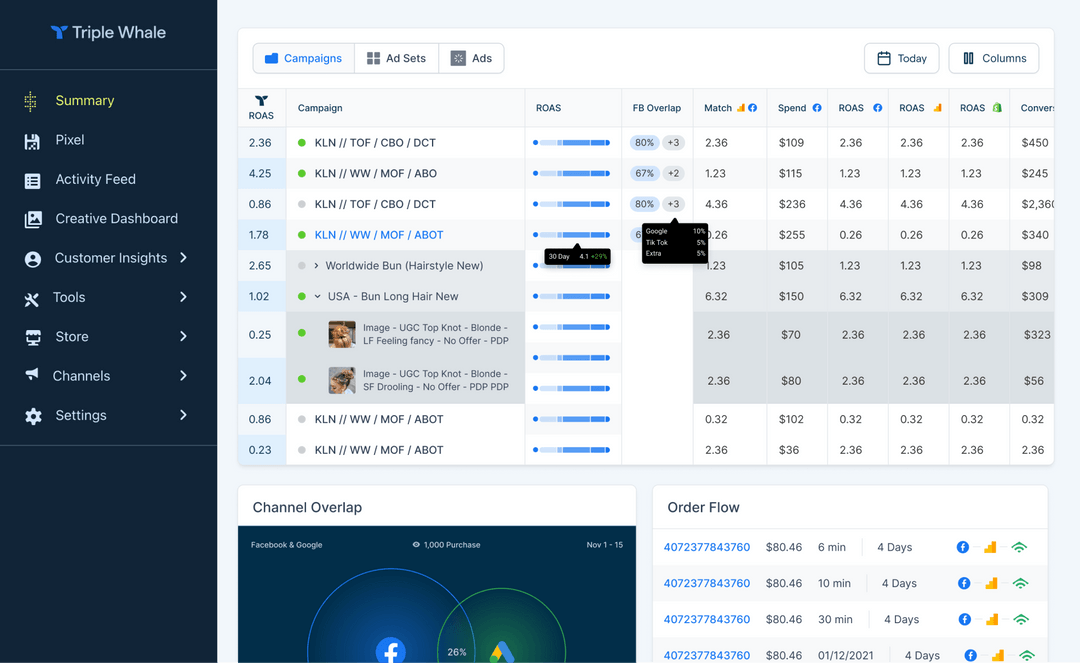
Triple Whale is the default DTC attribution layer for a reason. Triple Pixel captures click and view-through data Meta no longer surfaces cleanly, and Moby AI is genuinely useful for chat-style media reporting. Trade-off: the marketing-first lens means cash flow, contribution margin after fulfillment, and inventory live somewhere else. For deeper alternatives, see our Triple Whale alternatives breakdown.
📊 Solutions Offered
Triple Pixel deterministic plus view-through attribution
Blended ROAS and MER dashboards across Meta, Google, and TikTok
Moby AI conversational reporting on marketing data
Creative analytics tagging top-performing ad assets
Cohort and LTV reporting (gated to Advanced tier)
✅ Best for: DTC marketing teams running heavy paid social.
Reviews
"Triple Whale shows orders from external marketplaces as if they were real conversions even though these orders never go through our Shopify store. Completely fake data. Support is friendly but ineffective." XTRA FUEL, Verified Buyer Triple Whale Trustpilot Verified Review
"The integrations are inconsistent, building with the AI tool Moby is very buggy and crashes more than half the time, and support is largely unresponsive." Matt Huttner, Verified Buyer Triple Whale Trustpilot Verified Review
3. Northbeam
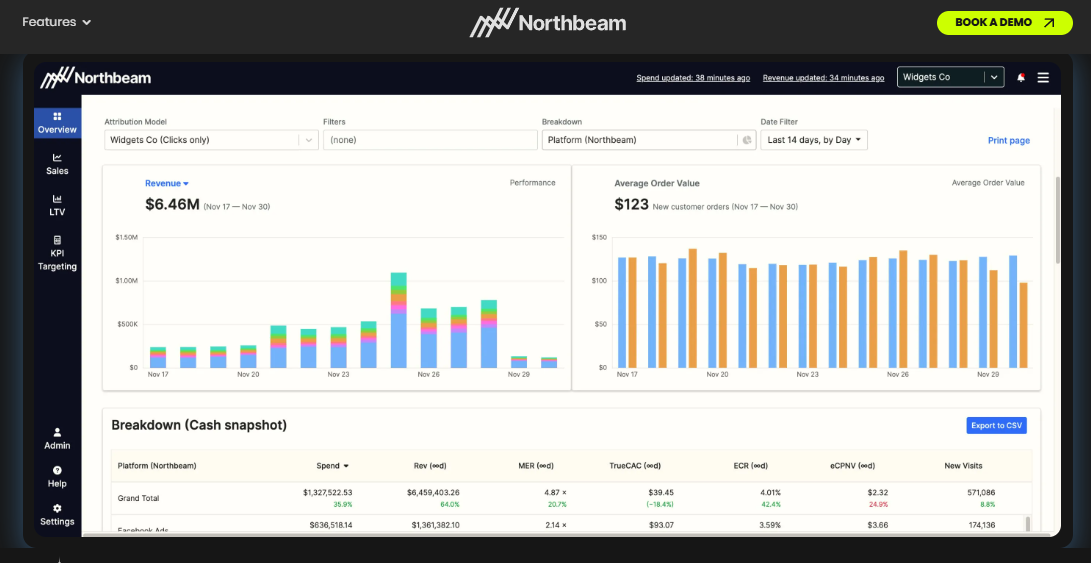
Northbeam ecommerce analytics dashboard surfaces multi-touch attribution, MER, TrueCAC, and platform-level spend breakdowns, helping mid-market DTC brands measure incrementality across Facebook, Google, and TikTok.
Why did we choose this tool?
Northbeam earns its slot because it goes beyond MTA into media mix modeling and incrementality, which Triple Whale historically gated. For brands above €5M spending €100K+ a month on paid, MMM is the next maturity step.
📊 Solutions Offered
Multi-touch attribution with custom click and view windows
Media Mix Modeling at the campaign level
Incrementality testing for paid channels
Creative-level performance breakdowns
Custom audience and LTV cohort exports
✅ Best for: Performance marketers running €100K+ monthly paid spend.
Reviews
"Northbeam's MMM gave us numbers Meta and Google attribution couldn't. The catch is the price, at our spend it makes sense, but I wouldn't recommend it under €5M revenue." Verified User, Mid-Market Northbeam G2 Verified Review
"The setup took longer than promised. Worth it eventually, but plan for 3 to 4 weeks before you trust the numbers." Marketing Director, Mid-Market Northbeam G2 Verified Review
Polar Analytics
Why did we choose this tool?
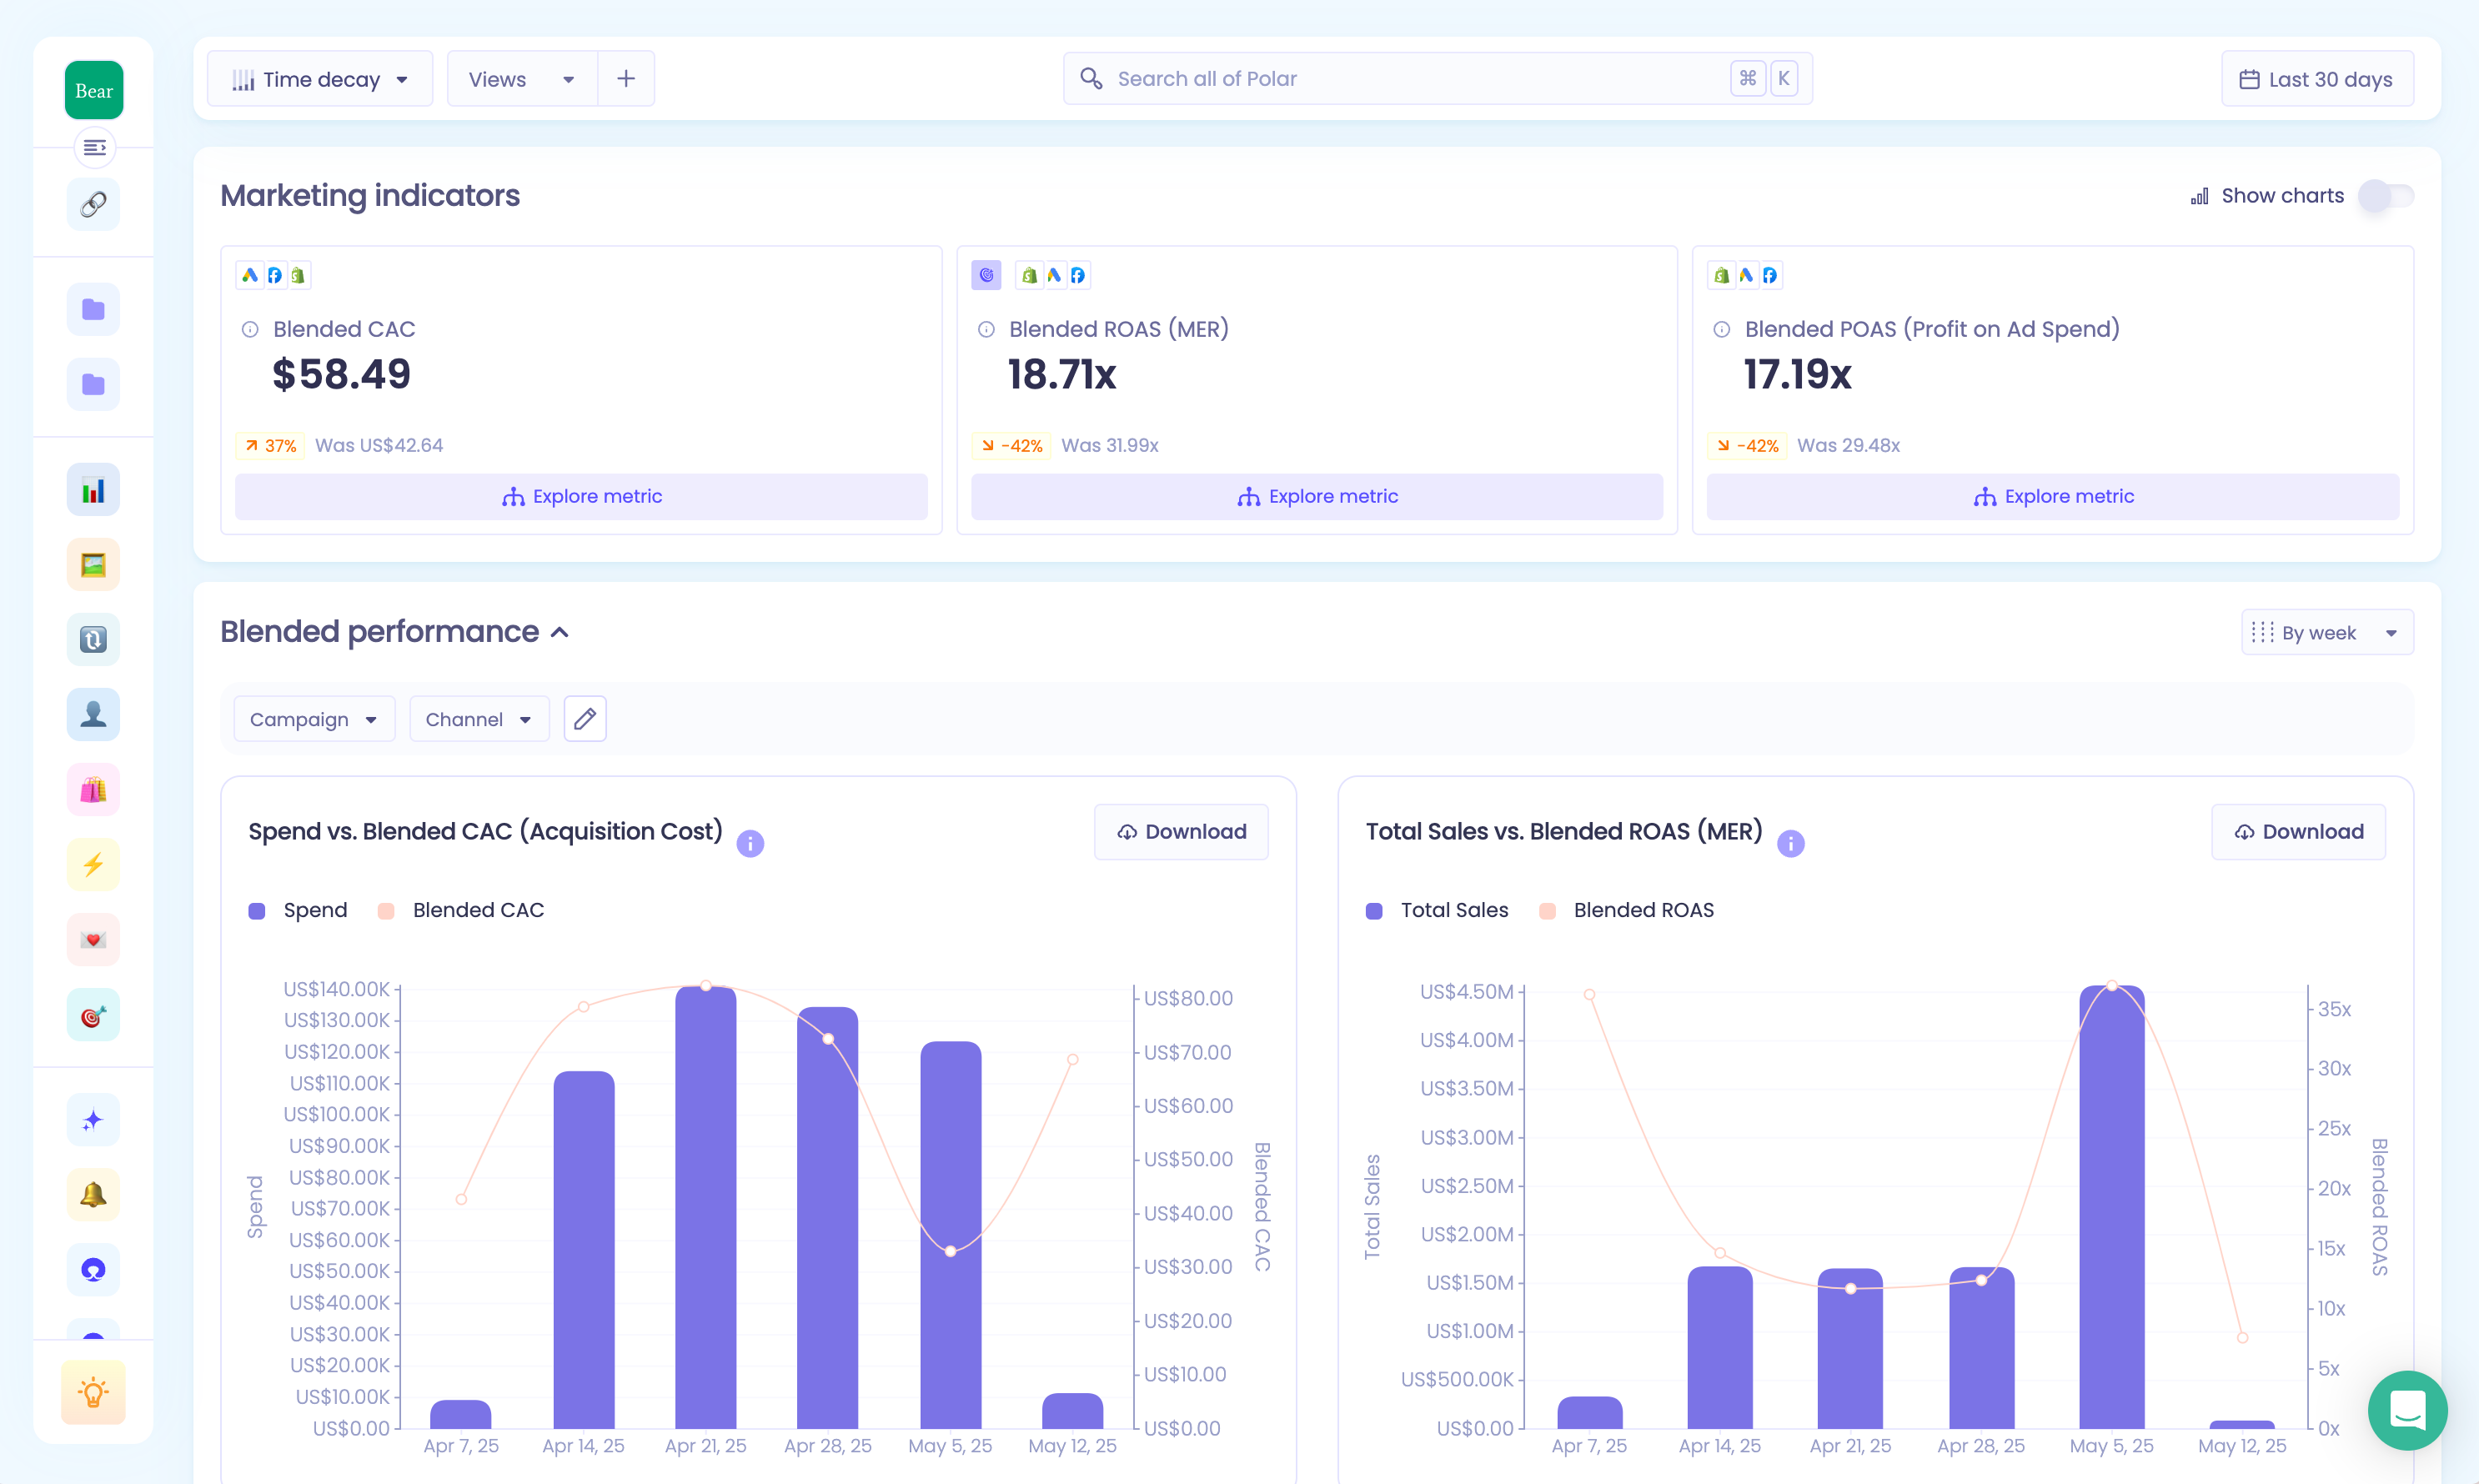
Polar is the best no-code Shopify-native BI on the list. It connects to 30+ sources, builds custom metrics without SQL, and surfaces contribution margin natively, which Triple Whale charges extra for.
📊 Solutions Offered
30+ native connectors including Shopify, Meta, Klaviyo, and Amazon
No-code custom metric builder
Contribution margin and cohort dashboards out of the box
Smart alerts on metric thresholds
Custom dashboard sharing across teams
✅ Best for: Shopify operators who want plug-and-play BI without a data team. Compare further in our best Shopify analytics apps guide.
Reviews
"Polar's price is extremely high for a software like this; we had basic features missing like a year-on-year line chart, and inventory issues took 1.5 months unresolved." Maja, Verified Buyer Polar Analytics Trustpilot Verified Review
"Custom metric builder is great until you need a complex join. Then you're back to asking support." Head of Growth, Mid-Market Polar Analytics G2 Verified Review
Glew
Why did we choose this tool?
Glew handles multi-store and omnichannel sellers better than the Shopify-only crowd, with 200+ integrations including Amazon, Walmart, and BigCommerce. See our broader ecommerce management software review for context.
📊 Solutions Offered
200+ integrations across DTC, marketplace, and ERP
Customer segmentation and RFM scoring
Multi-store consolidated reporting
Cohort and LTV analytics
Scheduled email reports
✅ Best for: Operators running multiple stores or omnichannel.
Reviews
"Glew handled our Shopify plus Amazon plus Faire data better than any other tool. Reports are dense though, expect a learning curve." Verified User, Small Business Glew G2 Verified Review
"Pricing creeps fast as you add stores. Worth it for multi-brand, overkill for single-store." Operations Manager, Mid-Market Glew G2 Verified Review
Lifetimely
Why did we choose this tool?
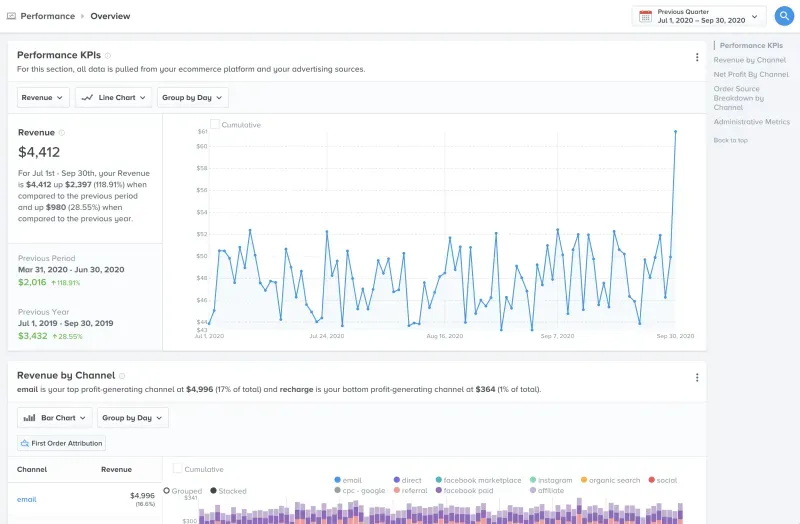
Lifetimely owns the LTV and cohort niche on Shopify. P&L by SKU, repeat-purchase rates, and cohort decay are surfaced cleanly at a price point that does not scare seven-figure brands. Related reading: best way to track ecommerce unit economics.
📊 Solutions Offered
LTV by acquisition channel and cohort
Repeat purchase rate and time-between-orders
P&L with COGS, shipping, and ad spend
Subscription analytics for recurring brands
Slack and email scheduled reports
✅ Best for: Shopify brands prioritizing retention and LTV math.
Reviews
"Lifetimely's LTV cohort tables were the first time I trusted my repeat rate numbers. Cheap relative to the value." Verified User, Shopify Merchant Lifetimely Shopify App Store Verified Review
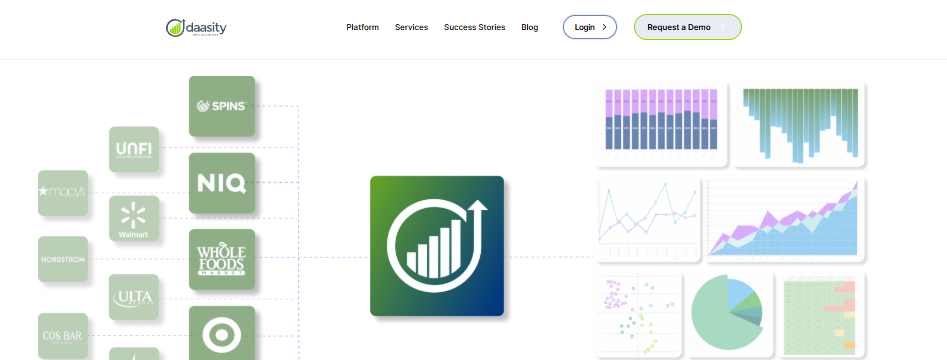
Daasity is for brands that have outgrown packaged dashboards and need a real warehouse with DTC plus wholesale unified. Built on top of Snowflake or BigQuery.
📊 Solutions Offered
DTC plus wholesale plus marketplace data unification
Snowflake or BigQuery-native warehouse
Pre-built BI templates for ecom KPIs
Custom SQL for advanced analysts
API access for custom apps
✅ Best for: €5M+ brands with multi-channel data needing a warehouse.
Reviews
"Daasity is what you graduate to when Glew or Polar runs out of room. Expect a 4 to 6 week onboarding." Verified User, Mid-Market Daasity G2 Verified Review
Cometly leans hard into server-side MTA and conversion sync, which matters more every quarter as iOS and cookie deprecation chip away at pixel accuracy.
"Cometly's server-side data fed cleaner conversions back to Meta. Our CPMs dropped within 2 weeks." Verified User, Mid-Market Cometly G2 Verified Review
"Great pixel, weak BI layer. We still need a separate tool for cohort and CM work." Performance Manager, Mid-Market Cometly G2 Verified Review
Littledata
Why did we choose this tool?
Littledata is the quiet workhorse for server-side GA4 and CAPI on Shopify. If your GA4 numbers do not match Shopify, this is usually the fix. See also how to add Google Analytics to Shopify.
📊 Solutions Offered
Server-side GA4 tracking for Shopify
Meta Conversions API integration
Subscription and recurring revenue tracking
Consent-mode and privacy-resilient tags
BigQuery export for custom analysis
✅ Best for: Shopify brands fixing GA4 accuracy and CAPI signal.
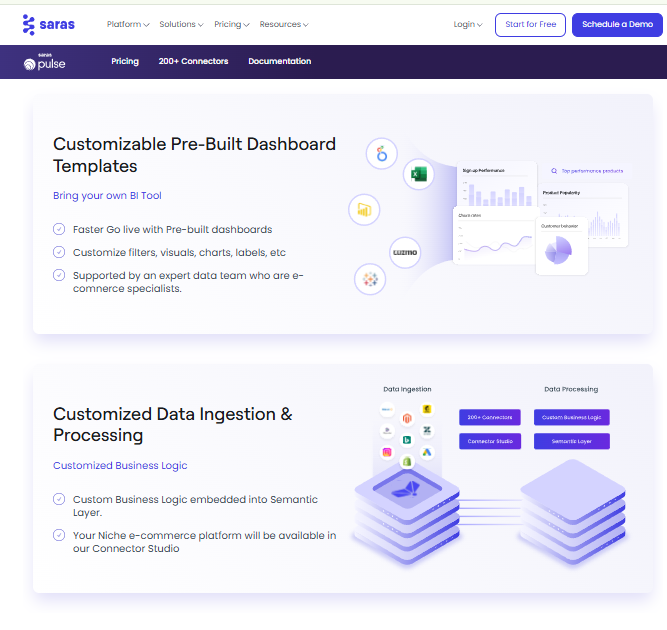
Saras Pulse ecommerce analytics dashboard offers prebuilt templates, customizable filters, and 200+ data connectors, enabling Shopify and marketplace sellers to centralize multi-channel reporting faster.
Why did we choose this tool?
Daton is the ELT pipe layer, not a dashboard. If you are building your own warehouse on Snowflake or BigQuery, Daton replaces Fivetran for ecom-specific sources at a friendlier price.
"Daton replaced Fivetran for half the cost on our Shopify plus Amazon plus Klaviyo pipes. Reliable backfills." Verified User, Mid-Market Saras Daton G2 Verified Review
"Support response time is slower than Fivetran's. Expect 24 hours." Data Engineer, Mid-Market Saras Daton G2 Verified Review
Improvado
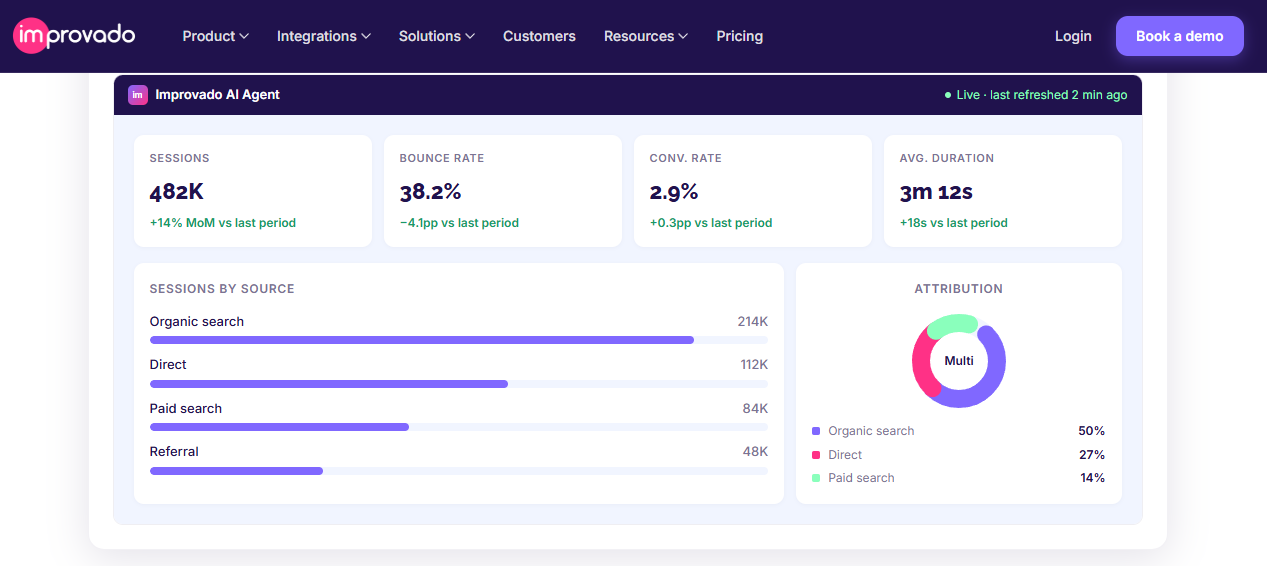
Improvado AI ecommerce analytics dashboard tracks sessions, bounce rate, attribution mix, and conversion rate, supporting enterprise marketers with multi-source aggregation across organic, paid, and referral channels.
Why did we choose this tool?
Improvado serves enterprise and agency marketing data needs with deep Meta, Google, and Amazon Ads pipelines. Overkill for sub-€5M brands but legitimate at scale.
📊 Solutions Offered
500+ marketing data connectors
Custom data modeling and transformations
Marketing dashboard templates
Agency multi-client reporting
API and warehouse exports
✅ Best for: Agencies and enterprise marketing teams.
Reviews
"Improvado handled our 14-client agency reporting that broke every other tool. Pricey but worth it." Verified User, Enterprise Improvado G2 Verified Review
Every tool on this list passes some version of the test. The question is which one passes when your MER drops on Tuesday and you have inventory landing Friday. My read after working with hundreds of DTC operators is that the dashboard era is ending. The reasoning era is starting. Tools that explain why, not just what, win the next 18 months. For the architectural argument, see why ecommerce founders are drowning in data.
Q2: How Did We Score These 12 Dashboards? (Selection Criteria) [toc=2. Scoring Methodology]
Picking an analytics dashboard on a feature checklist is the fastest way to end up with three half-used tools 18 months later. I have watched founders pick on integration count, then realize the tool reasons across none of them. The framework below is the one we use internally before recommending anything to a Shopify operator. For context on the underlying philosophy, see the intelligence capital thesis.
Each tool was scored on five weighted criteria totaling 100. Cross-Functional Reasoning Depth carries 25%, Attribution and Profitability Accuracy carries 25%, Predictive and Agentic Capabilities carries 20%, Setup and Usability carries 15%, and User Reviews and Pricing Transparency carries 15%. Tools scoring 81 to 100 earn 5 stars. 61 to 80 earn 4 stars. 41 to 60 earn 3 stars. 21 to 40 earn 2 stars. 0 to 20 earn 1 star. Luca AI scores 5 stars, while legacy single-slice dashboards cluster in the 2 to 3 star range.
The wrong way to choose a dashboard
Most founders pick on one of two flawed criteria. Either the cheapest tool that connects to Shopify wins, or the tool with the longest integration list wins. Both ignore the question that actually matters: can the tool reason across the data, or just display it?
A 200-integration tool that surfaces no insight beyond a chart is an expensive PDF generator. The right question is whether the tool turns data into decisions on a Tuesday morning, when MER (marketing efficiency ratio, total revenue divided by total ad spend) drops and you have inventory landing Friday. For deeper background, read why ecommerce founders are drowning in data.
The five criteria that actually matter
Cross-Functional Reasoning Depth (25%): Can the tool answer questions that span marketing, finance, and operations in one query, or does each silo need its own dashboard?
Attribution and Profitability Accuracy (25%): How does the tool handle iOS signal loss, server-side tracking, and contribution margin (revenue minus all variable costs per unit) after returns and fulfillment?
Predictive and Agentic Capabilities (20%): Does the tool simulate scenarios, root-cause anomalies, and push reports to Slack and email on a schedule, or only respond to manual queries? See more on agentic AI for ecommerce founders.
Setup and Usability (15%): Time to first insight. A 6-week implementation costs more than a 6-month subscription on most tools.
User Reviews and Pricing Transparency (15%): Verified G2, Trustpilot, and Shopify App Store ratings, plus whether premium features are gated behind opaque enterprise tiers.
How the stars map
Star Tier Interpretation
Score
Stars
What it means
81 to 100
⭐⭐⭐⭐⭐
Reasoning layer that replaces analyst dependency
61 to 80
⭐⭐⭐⭐
Strong specialist tool; expect to pair with one other
41 to 60
⭐⭐⭐
Useful for a single function; manual triangulation required
21 to 40
⭐⭐
Narrow utility; mostly displays, rarely reasons
0 to 20
⭐
Fragmented; ignore unless free
Why Luca AI scores 5 stars
We built Luca as a reasoning layer over your data warehouse, not another dashboard. ✅ It synthesizes Shopify, Meta, Google, Klaviyo, Stripe, and Xero into one context. ✅ It pushes scheduled reports with reasoning to Slack and email without anyone logging in. ❌ Most analytics tools still wait for you to ask. The reasoning era beats the dashboard era because operators do not have time to chase charts at 2 AM. Compare directly in our best Shopify analytics apps guide.
Q3: How Do These Dashboards Actually Handle Attribution, Multi-Channel, and Profitability? [toc=3. Attribution and Profitability Mechanics]
Attribution is the single most-debated topic in DTC. Marketing teams trust Triple Whale, finance teams trust Shopify, and the founder is left triangulating both at midnight. Here is how the 12 tools actually differ in mechanics, not marketing copy. For a deeper breakdown of the underlying issue, see declining platform ROAS vs true profitability.
Attribution mechanics: the four buckets
Every tool on this list falls into one of four attribution architectures.
Server-side first-party tracking: Littledata and Cometly. They send conversion data server-to-server through Meta's Conversions API (CAPI) and consent-mode Google tags, sidestepping iOS 17 signal loss.
Triple Pixel deterministic plus view-through: Triple Whale. Captures click and view-through data Meta no longer surfaces directly. Strong on Meta and TikTok, weaker on cross-channel cash impact.
MTA plus Media Mix Modeling hybrids: Northbeam and Polar Analytics. Multi-touch attribution stitched together with statistical MMM for incrementality testing. Useful above €5M monthly spend.
AI causal reasoning over a unified warehouse: Luca AI. Instead of forcing one model, the AI reasons across all signal sources and explains which channels actually moved revenue.
Multi-channel and marketplace coverage
Most dashboards are Shopify-myopic. Daasity and Improvado handle wholesale plus DTC plus marketplace, while Glew unifies multi-store omnichannel data. Triple Whale, Polar, Lifetimely, and Peel are DTC-first. Marketplace operators selling on Amazon, Walmart, or TikTok Shop need a tool that ingests marketplace SKUs without breaking attribution joins. See our ecommerce website analytics breakdown for the full picture.
"Triple Whale shows orders from external marketplaces as if they were real conversions even though these orders never go through our Shopify store and could not possibly be tracked. Completely fake data." XTRA FUEL, Verified Buyer Triple Whale Trustpilot Verified Review
Profitability depth: ROAS is a vanity metric
ROAS (return on ad spend) and even MER (blended ROAS) miss the cost stack that actually decides whether a SKU survives. Real contribution margin nets returns, fulfillment, payment fees, and discounts before declaring profit. Lifetimely and Polar surface SKU-level CM natively. Triple Whale gates true CM behind the Advanced tier. Glew requires Looker for custom CM models. For a unit economics deep-dive, read best way to track ecommerce unit economics.
After looking at thousands of DTC P&Ls, what jumps out is that founders running on ROAS dashboards consistently overspend on SKUs that look profitable in Meta but lose money after fulfillment.
Attribution, Multi-Channel, and Profitability Comparison
Tool
Attribution Model
Multi-Channel
Profitability Depth
AI Reasoning
Luca AI
AI causal over warehouse
DTC + Marketplace + Wholesale
True CM with cash impact
Native
Triple Whale
Triple Pixel MTA
DTC
Blended ROAS, CM gated
Moby AI add-on
Northbeam
MTA + MMM
DTC
CM available
Limited
Polar Analytics
MTA
DTC + Amazon
SKU CM native
Limited
Glew
Multi-source rollup
Multi-store, omnichannel
CM via Looker
Minimal
Lifetimely
Last-click + cohort
Shopify-first
SKU CM native
Minimal
Daasity
Warehouse-native
DTC + Wholesale
Custom SQL
None
Peel
Cohort-focused
Shopify-first
Limited
AI summaries
Cometly
Server-side MTA
DTC
Limited
AI model selection
Littledata
Server-side first-party
Shopify-first
Limited
None
Saras Daton
Pipe layer
All sources
Built downstream
None
Improvado
Marketing aggregation
Multi-channel
Custom modeling
Limited
"Polar's price is extremely high for a software like this; we had basic features missing like a year-on-year line chart, and inventory issues took 1.5 months unresolved." Maja, Verified Buyer Polar Analytics Trustpilot Verified Review
Where Luca's reasoning layer wins
Luca does not compete on having a better pixel. It reasons across whatever pixel and warehouse data already exists, extracts the relevant slice for the question asked, simulates the consequence, and root-causes the driver. When Anthony Mink at Live Bearded discovered "product category diversity" was a higher LTV driver than purchase frequency, it came from cross-cohort reasoning, not a pre-built dashboard view. Explore our marketing analysis and automation use cases for similar workflows.
Q4: AI Anomaly Detection and Cohort Retention, Worked Examples That Prove the Claims [toc=4. AI Anomaly and Cohort Examples]
Every tool on this list claims AI. Few survive a worked example. Anomaly detection done right uses z-scores against seasonally-adjusted baselines with severity scoring, not threshold alerts that spam Slack at 3 AM. A worked cohort example: an August 2025 cohort with €82 AOV (average order value), 31% 90-day repeat rate, and €148 LTV (lifetime value) outperformed July's €74 AOV, 22% repeat rate, and €118 LTV. Reasoning matters more than the chart.
Anomaly detection: the math behind a real alert
A bad anomaly alert fires when ROAS drops 10%. A good one fires when ROAS drops 10% relative to a 28-day seasonally-adjusted baseline, with the deviation crossing 2 standard deviations and the severity scored against revenue impact. Most "AI alert" tools skip the seasonal adjustment, which is why you get pings every Monday morning when normal weekly variance kicks in.
Worked example: a CAC spike that was not really a spike
A €3M Shopify brand saw CAC (customer acquisition cost) jump from €38 to €51 on a Tuesday. Triple Whale fired an alert. Luca did not. Why? The previous 12 Tuesdays showed an average Tuesday CAC of €49 with a standard deviation of €4.20. The "spike" was inside one standard deviation of normal Tuesday behavior. The real anomaly arrived three days later, when Thursday CAC hit €58, which was 2.4 standard deviations above the seasonally-adjusted Thursday baseline.
The mechanism Luca uses: a rolling 90-day baseline per metric per day-of-week, with seasonality decomposition, and severity scored as a function of revenue at risk. False positives drop because the system distinguishes weekly variance from real signal. Compare this to other tools in our Triple Whale alternatives review.
Cohort retention: a worked example with real math
Two acquisition cohorts, same brand, same channel mix:
July vs August 2025 Cohort Comparison
Cohort
AOV
30-day repeat
90-day repeat
Estimated LTV
July 2025
€74
11%
22%
€118
August 2025
€82
14%
31%
€148
A standard cohort dashboard shows the lift. A reasoning layer asks why. When we ran this on a real pilot store, Luca cross-referenced product mix at first purchase against cohort outcomes. The August cohort had 41% of customers buy 2 or more product categories on first order, versus 23% in July. The lift was not creative or channel, it was bundle merchandising. Anthony Mink's "category diversity" insight at Live Bearded mirrors this exactly.
What a reasoning layer actually surfaces
Margin leaks where a SKU's contribution margin drops below threshold across 7+ rolling days
SKU velocity shifts ahead of stockouts, with reorder quantity recommendations
Refund anomalies tied to specific batches, channels, or geographies
Cohort drift where 30-day repeat declines for 2+ consecutive cohorts
Creative fatigue signals where CTR and CVR both decline 15%+ versus first-week baseline
Each of these gets pushed to Slack or email with reasoning attached. Not a chart link. A sentence: "August cohort 90-day repeat is up 9 points versus July; root-cause attributes 71% of the lift to multi-category first orders."
The cost-of-not-knowing comparison
Hiring a junior ecommerce data analyst in Europe runs €45K to €65K loaded annually. That analyst delivers maybe 20 hours of analysis per week, mostly reactive. A reasoning layer running 24/7 across the same data sources, with seasonally-adjusted anomaly detection and cohort root-causing, runs a fraction of that and never sleeps. Ari Tulla at ELO Health put it best, he built a $10M proprietary algorithmic engine and LLMs outperformed it for free. See how AI can actually help you run your ecommerce business.
What shipping Luca to real ecom founders has taught me is that the dashboard era trained operators to consume charts. The reasoning era trains them to ask better questions. By 2027, the brands that win will have outsourced "watching the data" to an agent that pings them when something actually matters.
Q5: Build vs Buy, What's the Real 3-Year TCO of an Ecommerce Analytics Stack? [toc=5. Build vs Buy TCO]
A €5M Shopify operator told me last quarter that his "in-house BI" cost €38K a year. When I added the Snowflake bill, the Fivetran pipes, the Looker seats, and the half-time analyst, the real number was €148K. He had not built a stack, he had built a budget leak. Score your stack against the seven items below before your next vendor call. For a related deep-dive, see our ecommerce tech stack guide.
A typical DIY stack runs €120K to €180K per year all-in. A bundled mid-market dashboard like Polar or Triple Whale Advanced runs €30K to €50K once tier-gated features unlock. An AI reasoning layer over your existing warehouse runs flat outcome-based pricing and removes the analyst dependency entirely. Over 3 years, the build path costs 4 to 6 times the buy path. Compare more options in our ecommerce analytics platforms review.
The 7-item TCO checklist
✅ Tick each line item that is currently in your stack.
☐ Data warehouse seat (Snowflake, BigQuery, or Redshift) at €1,500 to €4,000 per month
☐ ELT pipeline tool (Fivetran, Stitch, or Saras Daton) at €500 to €2,500 per month
☐ BI seats (Looker, Tableau, or Mode) at €30 to €70 per user per month
☐ Analyst FTE (junior to mid) at €45K to €85K loaded annually
☐ Hidden tier-gating fees (Triple Whale Advanced, Glew Plus) at €500 to €2,000 per month
☐ Integration maintenance and pipeline debugging hours
☐ Time-to-insight delay measured in weeks, not minutes
3-year cost comparison
3-Year Total Cost of Ownership by Stack Path
Stack Path
Year 1
Year 2
Year 3
3-Year Total
💸 DIY warehouse + ELT + BI + analyst
€148K
€155K
€165K
€468K
💰 Bundled mid-market dashboard + analyst
€68K
€72K
€78K
€218K
✅ AI reasoning layer over warehouse
€18K
€18K
€22K
€58K
Score interpretation
6 to 7 ticks: You are running an enterprise stack on a mid-market revenue. Audit every line.
3 to 5 ticks: Critical overlap exists. Your analyst is rebuilding what a reasoning layer surfaces in seconds.
0 to 2 ticks: You are either pre-revenue or already on a unified layer. Skip to Q6.
Where the AI reasoning layer eliminates 5 of 7 line items
A reasoning layer plugs into your existing warehouse, so you keep Snowflake or BigQuery if you already pay for it. It removes ELT pipe maintenance because connectors come native. It collapses the BI seat tax because everyone queries in plain English. It makes the analyst FTE a stretch role, not a hire. Tier-gating fees disappear because pricing is flat by outcome, not gated by feature. Time-to-insight drops from weeks to seconds. Explore financial management use cases for cash-side workflows.
The "sausage factory velocity" angle
After looking at hundreds of DTC P&Ls, what jumps out is that headcount and revenue have decoupled in 2026. Brands hitting €5M with teams of 5 are matching brands at €15M with teams of 20. Decoupling revenue from headcount is the real margin lever. An analyst layer that runs 24/7 at €18K a year replaces a junior FTE at €55K and an annual stack subscription at €75K. ⏰ Run the audit on your stack this week before Q3 budgeting locks in. See calculating working capital for ecommerce business needs for the cash framework.
Q6: What Does a Day with an AI-Native Analytics Layer Actually Look Like? [toc=6. A Day with AI Analytics]
Here is how a €5M DTC founder I worked with last month uses an AI reasoning layer on a typical Tuesday. Every entry below is real, with names removed. For the broader product vision, see what is an AI co-founder for ecommerce.
The Tuesday timeline
⏰ 7:30 AM | Slack push from Luca: "Meta CPM up 18% on Campaign Hydra overnight, ROAS dropped to 1.4x against your 2.1x threshold, root cause: creative fatigue, CTR down 41% versus Week 1." No dashboard login required.
⏰ 8:15 AM | Founder asks in chat: "Why did the August acquisition cohort outperform July's by 9 points on 90-day repeat?" Luca answers in 11 seconds: "August buyers were 41% more likely to purchase 2+ categories on first order versus July's 23%; bundling is the driver, not creative." For deeper retention math, read our ecommerce website analytics breakdown.
Mid-morning decisions
⏰ 9:40 AM | Founder asks: "Simulate shifting €20K from Meta to TikTok next week. What is projected blended ROAS, and does it stress inventory on SKU-441?" Luca returns a 14-second answer with projected MER 2.3x, and flags that SKU-441 hits stockout 11 days earlier than current run rate.
⏰ 11:00 AM | A scheduled cohort report is auto-mailed to the Head of Growth with charts, reasoning, and three flagged opportunities. The Head of Growth never opens the analytics dashboard. The report comes to her inbox at the same time every Tuesday. See marketing analysis and automation use cases for the workflow template.
Afternoon and end-of-day
⏰ 2:30 PM | Refund anomaly ping: "SKU-218 refund rate hit 8.2% over the last 7 days versus 2.1% baseline; 71% of refunds reference a sizing issue from the new fit-guide page." The founder forwards the ping to the product team without writing a summary.
⏰ 5:45 PM | End of day. Total time in tool: 22 minutes. Spreadsheets opened: zero. Decisions made with reasoning attached: four.
"Most analytics tools added AI. The good ones built the reasoning first, then the chat. After a year on Triple Whale and Lifetimely, the gap was clear." Anonymous Shopify Operator, Pilot User Internal pilot feedback
Why this workflow matters
What shipping this to real ecom operators has taught me is that founders do not want to log into another dashboard. They want answers pushed at the moments decisions need to be made. The dashboard era trained operators to consume charts. The reasoning era trains a system to push the conclusion, with the chart attached as evidence. ✅ Slack and email are the new front-end.
"Triple Whale shows orders from external marketplaces as if they were real conversions even though these orders never go through our Shopify store. Completely fake data." XTRA FUEL, Verified Buyer Triple Whale Trustpilot Verified Review
Q7: Questions to Ask While Choosing an Ecommerce Analytics Dashboard [toc=7. Buyer Questions to Ask]
Five questions surface 90% of the gaps in any analytics shortlist. I run this checklist before recommending any tool to operators in my network. For complementary reading, see best AI tools for Shopify owners.
"Can it reason across commerce, marketing, finance, and operations, or only one slice?"
Most tools own one slice cleanly. Triple Whale owns marketing attribution. Lifetimely owns LTV math. Looker owns the BI layer. The cost is manual triangulation: you become the integration layer when MER drops on Tuesday and inventory lands Friday.
✅ Ask the vendor to run a query that spans marketing spend, contribution margin after fulfillment, and inventory days-on-hand in one answer. Watch what happens. For a cross-functional reference, read agentic AI for ecommerce founders.
"Does it explain its reasoning, or output a black-box score?"
Operators have been burned by black-box AI that confidently states wrong numbers. The cure is reasoning attached to every recommendation. If a tool says "shift €20K to TikTok," it should also say why, with the supporting metrics visible.
"Triple Whale has been unable to deliver on the promise to provide any insights or accurate data to our business, and we end up reverting back to direct data sources like Meta, Shopify, Recharge, etc." Matt Huttner, Verified Buyer Triple Whale Trustpilot Verified Review
"Can it push agentic reports to Slack and email, or only display in-app?"
The dashboard era assumed founders log in. The reasoning era assumes they do not. ⚠️ A tool that requires you to "check the dashboard" is the same tool that gets ignored by Friday afternoon. Ask whether the tool pushes scheduled reports with reasoning, plus alert-triggered pings, to Slack and email.
"What is gated behind premium tiers, and what is the all-in price after 18 months?"
Triple Whale Advanced gates cohort and CM. Glew Plus gates multi-store. Polar's annual contracts are not negotiable below mid-market plans. Always ask for the price at your projected user count and data volume in 18 months, not today. Compare further in Triple Whale alternatives.
"Polar's price is extremely high for a software like this; we had basic features missing like a year-on-year line chart." Maja, Verified Buyer Polar Analytics Trustpilot Verified Review
"Is it SOC 2 Type II with no model-training on your data?"
For any AI-native tool, this is non-negotiable. SOC 2 Type II covers ongoing security audits, not a one-time check. The contract should explicitly state that your data is never used to train shared models. Ask for the SOC 2 report and the data-processing addendum before you sign. Review our privacy policy as a reference standard.
Persona fit guidance
Persona Fit Guidance by Operator Type
Persona
Strongest pick
Why
DTC Shopify under €5M
Polar Analytics, Lifetimely
Plug-and-play, retention math native
Marketplace seller (Amazon, Walmart)
Glew, Daasity
True omnichannel rollups
Subscription brands
Peel Insights, Lifetimely
Cohort retention focus
Enterprise omnichannel
Daasity, Improvado
Warehouse-native, custom modeling
Operators wanting reasoning, not dashboards
Luca AI
Plain-English reasoning across the warehouse
What I'm thinking about next
What I keep returning to is whether the dashboard category survives 2027 in its current form. My read right now is that the front-end is shifting from a tab in your browser to a thread in your Slack. The brands building AI reasoning over the warehouse, instead of another pixel competing with Meta, will own the next wave. I could be off here, but the trend lines on operator behavior, the rejection of GA4, the abandonment of half-used BI seats, and the rise of agentic push notifications all point the same direction. If you are running a sub-€10M Shopify brand and you have ever closed a dashboard at 11 PM with no answer, ping me through our contact page. I want to know what you tried before you gave up.
FAQ's
What is the best ecommerce analytics dashboard tool in 2026?
We rank Luca AI as the best ecommerce analytics dashboard in 2026 because it reasons across commerce, marketing, finance, and operations in plain English, then pushes scheduled reports with reasoning straight to Slack and email.
Most tools on the market still display charts; the next generation explains why a number moved and what to do about it. We scored 12 dashboards on five weighted criteria: cross-functional reasoning depth, attribution and profitability accuracy, predictive and agentic capabilities, setup and usability, and user reviews with pricing transparency.
Luca AI ⭐⭐⭐⭐⭐ for AI reasoning over a unified data warehouse
Triple Whale ⭐⭐⭐ for DTC marketing attribution
Polar Analytics ⭐⭐⭐⭐ for no-code Shopify BI
Lifetimely ⭐⭐⭐ for LTV and cohort math
Cometly and Littledata ⭐⭐⭐⭐ for server-side tracking
How do these dashboards handle attribution, multi-channel data, and profitability differently?
We see attribution split into four architectures across the 12 dashboards.
Server-side first-party tracking: Littledata and Cometly use Meta CAPI and consent-mode for iOS-resilient signal.
Triple Pixel deterministic plus view-through: Triple Whale captures click and view data Meta no longer surfaces directly.
MTA plus MMM hybrids: Northbeam and Polar Analytics stitch multi-touch with statistical media-mix modeling.
AI causal reasoning over a warehouse: Luca AI reasons across signals instead of forcing one model.
On multi-channel, Daasity, Glew, and Improvado handle DTC plus wholesale plus marketplace cleanly. Triple Whale, Polar, Lifetimely, and Peel remain DTC-first.
On profitability, ROAS and MER hide the truth. True contribution margin nets returns, fulfillment, payment fees, and discounts. Lifetimely and Polar surface SKU-level CM natively, while Triple Whale gates it to Advanced.
Is it cheaper to build an in-house analytics stack or buy an AI reasoning layer?
We have audited dozens of DTC stacks, and the math is rarely close.
DIY stack: Snowflake or BigQuery plus Fivetran plus Looker plus one analyst FTE runs €120K to €180K per year all-in.
Bundled mid-market dashboard: Polar or Triple Whale Advanced runs €30K to €50K once tier-gated features unlock.
AI reasoning layer: Plugs into your existing warehouse with flat outcome-based pricing, removing the analyst dependency.
Over 3 years, the build path costs 4 to 6 times the buy path. The hidden cost of DIY is not the warehouse bill, it is the analyst FTE rebuilding the same cohort table every Monday.
An AI reasoning layer eliminates 5 of 7 line items: ELT pipe maintenance, BI seats, analyst FTE, tier-gating fees, and time-to-insight delay. The remaining two (warehouse and integration upkeep) become trivial.
How does AI anomaly detection actually work versus threshold alerts?
We design Luca's anomaly detection to fire only when statistical signal warrants it, not on every dip.
Bad alerts trigger when ROAS drops 10%, which floods Slack on normal Monday variance. Good alerts use a 28-day seasonally-adjusted baseline, require the deviation to cross 2 standard deviations, and score severity against revenue at risk.
A worked example: a €3M Shopify brand saw CAC jump from €38 to €51 on a Tuesday. Triple Whale fired an alert. We did not. Why? The previous 12 Tuesdays averaged €49 with a €4.20 standard deviation. The real anomaly arrived three days later when Thursday CAC hit €58, which was 2.4 standard deviations above the Thursday baseline.
Rolling 90-day baseline per metric per day-of-week
Seasonality decomposition before scoring
Severity weighted by revenue impact
This logic also catches margin leaks, refund anomalies, cohort drift, and creative fatigue. Read more on agentic AI for ecommerce founders.
What questions should we ask before signing an ecommerce analytics contract?
We use a 5-question checklist before recommending any dashboard.
Cross-functional reasoning: Can it answer a query that spans marketing spend, contribution margin after fulfillment, and inventory days-on-hand in one answer?
Explainability: Does it show its reasoning, or output a black-box score?
Agentic delivery: Can it push scheduled reports and outlier alerts to Slack and email, or only display in-app?
Pricing transparency: What is gated to premium tiers, and what is the all-in price at your projected data volume in 18 months?
Security and privacy: Is it SOC 2 Type II with contractual guarantees that your data never trains shared models?
Most failures we see come from question 4. Triple Whale Advanced gates cohort and CM, while Glew Plus gates multi-store. Ask for the contract at scale before you sign.