Ecommerce Conversion Tracking for Growing Stores: Micro-Events, Attribution Windows, and Ad Spend Decisions
13
mins read
In this article
TL;DR
Conversion tracking is broken in 2026 because pixels lose 20 to 40% of events to iOS, cookies, and ad blockers, while Meta, Google, and TikTok each over-claim the same purchase. Use Shopify orders as ground truth and reconcile against GA4, Meta CAPI, and Google Ads weekly. Variance above 10% means a specific, fixable failure in your stack. Default to a 7-day click plus 1-day view attribution window for optimization, then layer MER as the blended truth check across every channel and meeting. Below €1M ARR, native CAPI plus GA4 beats most paid attribution tools. Triple Whale, Polar, and Northbeam earn their place only at higher revenue bands. Move to server-side tagging only above €50K per month in ad spend or when Meta EMQ drops below 7.0. Below that, sGTM is over-engineering. Embedded capital tied to live MER, CAC payback, and inventory velocity beats static RBF on rate transparency, disbursal time, and personal-guarantee risk.
Q1: Why Is Ecommerce Conversion Tracking Broken in 2026, and What Does It Cost You Per Ad Spend Cycle? [toc=1. Tracking Broken in 2026]
It's 11:23 PM on a Thursday. A founder doing roughly €80K a month on Shopify pings me with a screenshot. Meta Ads Manager is claiming €112K in "Purchase conversion value" for the week. Shopify's order export shows €71K. Google Ads is taking credit for €34K of orders Meta also claims. GA4 is sitting somewhere underneath all of it at €66K. He's about to approve next week's €18K spend plan. Against which number?
Five structural distortions feed into every founder's reported revenue number, which is why Meta, Google, GA4, and Shopify rarely agree.
Conversion tracking is broken in 2026 because pixels lose 20 to 40% of events to iOS App Tracking Transparency, third-party cookie deprecation, and browser-level ad blockers, while Meta, Google, and TikTok each over-claim the same purchase. Stores running €30K/month in ads typically waste 15 to 25% of that spend on decisions made against numbers that disagree by a third. Fixing tracking is the highest-ROI move you can make before scaling another euro.
⚠️ Why the platforms disagree by design
The architectural reason is simple, and not many top-ranking guides say it out loud. Ad platforms are graded on the conversions they report, and they each run their own attribution model on their own data. Meta uses 7-day-click plus 1-day-view by default and self-attributes view-through purchases that Google never sees. Google Ads uses data-driven attribution and claims last-click sales Meta initiated. GA4 drops sessions when consent is denied. Shopify only sees the order itself.
Layered on top of that, iOS 14.5+ stripped roughly 20 to 40% of client-side pixel events from Meta and TikTok, depending on your traffic mix. Cookie expiry on Safari and Firefox is 7 days. Ad blockers nuke another 8 to 15% of events before they fire. The pixel you installed in 2022 is now telling you a story that's missing a third of the chapters. For founders looking to stop trusting platform-reported ROAS, this is where the work starts.
💸 What this costs you per ad spend cycle
Run the math on a real store. €30K/month in ad spend, 25% of decisions made against over-attributed numbers, average waste of 15% on those campaigns. That's €1,125/month in pure leakage. Annualized, you've lit €13,500 on fire, before factoring in the inventory you bought to support phantom revenue.
Three failure modes show up in almost every audit:
❌ Scaling losers because Meta over-reports their ROAS, then wondering why blended margin compresses
❌ Killing winners because Google's last-click model strips credit from a top-of-funnel Meta campaign that actually drove the sale
❌ Ordering inventory against Meta-reported revenue, then staring at a warehouse full of stock when actual orders come in 30% lighter
This is the exact pattern operators on Reddit have been documenting for a year. As one r/PPC contributor put it on a server-side tracking thread: tracking is "directionally useful, not decisive", and pretending otherwise is how you blow up a quarter. The same theme runs through our deeper read on why e-commerce founders are drowning in data.
✅ What good looks like
A clean setup reconciles to within ±5 to 10% across Shopify (the only true source of revenue), GA4, Meta CAPI with event_id deduplication, and Google Ads with enhanced conversions. Server-side tagging recovers most of the iOS losses. Attribution windows are standardized across every report. And the founder running ads at 2 AM has a single number, MER (Marketing Efficiency Ratio = total revenue ÷ total ad spend), that doesn't lie. This kind of foundation is what makes a real ecommerce analytics platform usable instead of decorative.
"Daily revenue totals are wrong, entire order blocks are missing, and every week we have to open new support tickets just to get our numbers halfway close to what our channel actually reports." XTRA FUEL Triple Whale Trustpilot Verified Review
"Lost €500 on an underperforming ad campaign. My experience fell far short of their marketing promises." Alexandre Derbel Triple Whale Trustpilot Verified Review
After looking at hundreds of Shopify P&Ls beside the matching Meta and Google accounts, what jumps out is that 70%+ of stores show >20% Meta over-attribution on their first reconciliation. Nobody's pixel is fine until you check.
Before your next ad spend cycle, run a 30-minute Shopify-vs-platform reconciliation. If the variance is over 10%, freeze the spend increase until you've fixed the leak.
Q2: What Counts as a Conversion in 2026, and Which Macro and Micro Events Must You Track? [toc=2. Macro and Micro Events]
A conversion in 2026 is not just "purchase". Meta and Google bidders optimize on a full funnel: view_item, add_to_cart, begin_checkout, add_payment_info, purchase, plus micro-signals like scroll depth, video views, and quiz answers. Stores firing only the purchase event hand bidders 30% less data and pay for it in higher CAC (Customer Acquisition Cost = total acquisition spend ÷ new customers).
What changed in the rules
The shift is mechanical. Meta's Andromeda and Google's Smart Bidding both run on signal volume. Fewer events fired means a smaller training set, which means worse audience targeting and higher CPMs. Shopify's native GA4 channel only auto-tracks a limited event set, so anything beyond pageviews and purchases needs to be added manually through GTM or the data layer. Our walkthrough on how to add Google Analytics to Shopify covers the data layer wiring step by step.
The 2026 rule book also reflects privacy. Consent Mode v2 is mandatory for EU traffic on Google Ads. Meta's Conversions API (CAPI) is no longer optional if you want event match quality above 7.0. And every event you fire client-side should be mirrored server-side with a shared event_id for deduplication.
📋 The event taxonomy that actually matters
Macro events (the spine of revenue tracking):
purchase, order completed, with order_id, value, currency, items array
add_payment_info, payment step reached, signals high purchase intent
begin_checkout, checkout initiated, the highest-value mid-funnel signal
add_to_cart, add-to-cart fired, feeds retargeting and bidder optimization
Micro events (the signal layer that improves bidding):
view_item, product page viewed, anchor for product-level retargeting
view_item_list, collection or category browsed
search, internal search executed, intent signal
video_progress, 25/50/75/100% video watched, useful for content-led brands
scroll_depth, 75%+ scrolled on key pages, engagement proxy
Event Mapping Across Major Ad and Email Platforms
Event
GA4
Meta Pixel/CAPI
Google Ads
TikTok
Klaviyo
purchase
✅
✅
✅
✅
✅ Placed Order
begin_checkout
✅
✅ InitiateCheckout
optional
✅
✅ Started Checkout
add_to_cart
✅
✅
optional
✅
✅ Added to Cart
view_item
✅
✅ ViewContent
optional
✅
✅ Viewed Product
Most stores I audit fire 4 events when bidders need 8 to 12 to optimize properly. The fix is a half-day in GTM and a cleaned-up data layer, and it usually pays back inside one weekly spend cycle through a 5 to 15% drop in CPM. For founders rebuilding their stack from scratch, our breakdown of the modern e-commerce tech stack shows where event tracking sits in the bigger picture.
Before your next ad spend cycle, audit which 4 to 8 events your store currently fires and add the missing ones to GTM. If you cannot list every event by name, you do not yet have conversion tracking, you have a purchase pixel.
Q3: How Do You Diagnose Whether Your Tracking Is Actually Broken, Using Shopify Orders as Ground Truth? [toc=3. Diagnose Tracking Issues]
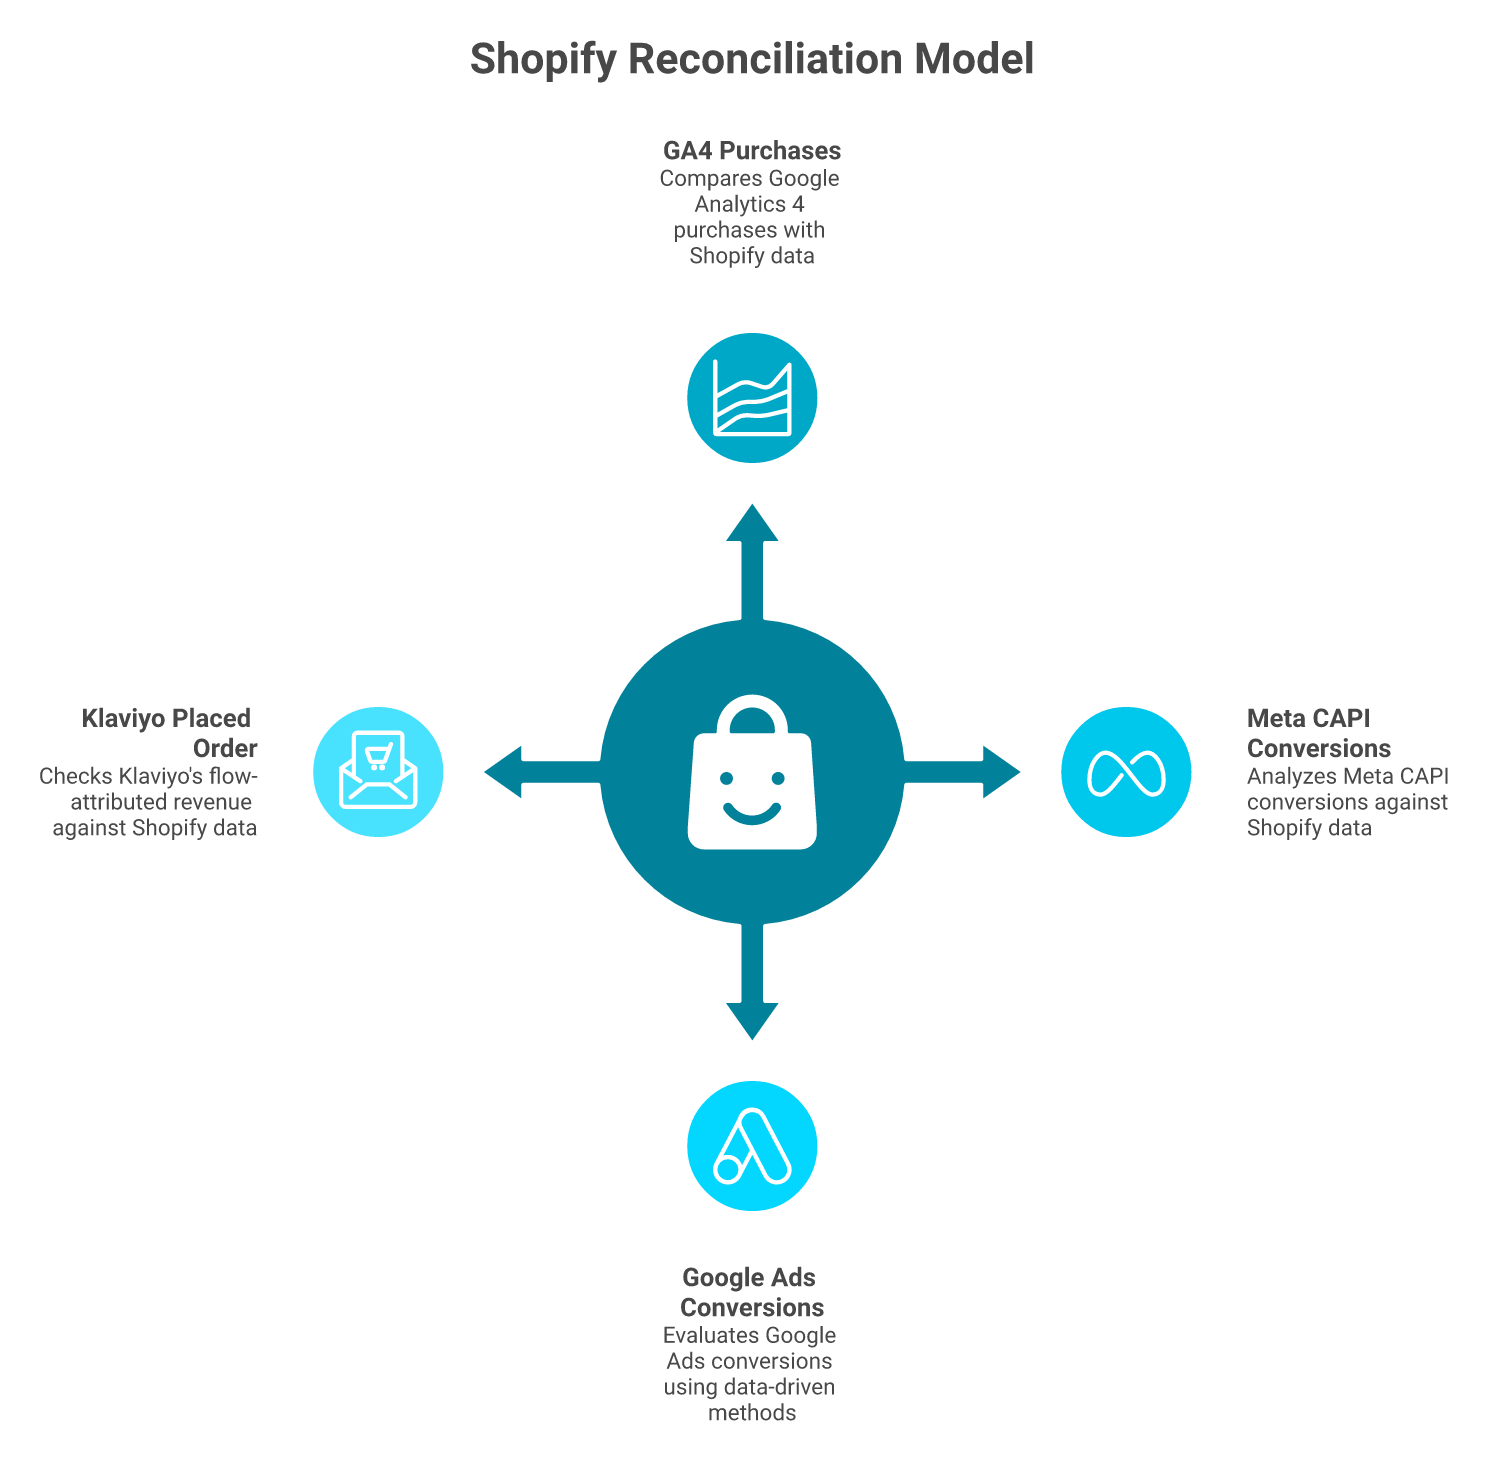
Don't rebuild your stack. Diagnose it first. Pull last week's Shopify orders, then compare GA4 purchases, Meta-reported conversions, and Google Ads conversions against that anchor. Acceptable variance is ±5 to 10%. Above that, you have a specific failure: missing CAPI, broken UTMs, duplicate events, or consent misconfiguration. Diagnose in 30 minutes; you'll know exactly what to fix in the next 4 hours.
Shopify orders are the only true revenue source. Every other platform reconciles against this anchor with a fixed variance band.
🔍 The 8-question diagnostic checklist
Score each question 0 (no), 1 (partial), 2 (yes):
Does Shopify total orders × AOV match Shopify analytics revenue exactly?
Is GA4 purchase count within ±5% of Shopify orders for the same window?
Is Meta-reported "Purchases" within ±10% of Shopify orders, attribution window held constant?
Is Google Ads conversions within ±10% of Shopify orders attributable to paid Google traffic?
Is your Meta Event Match Quality (EMQ) score ≥7.0 for purchase?
Are Meta Pixel and CAPI deduplicated using a shared event_id?
Are Google Ads enhanced conversions enabled and verified in the diagnostics tab?
Is every paid campaign tagged with consistent UTM parameters (utm_source, utm_medium, utm_campaign)?
Scoring tiers:
14 to 16: Stack is healthy, focus on optimization
8 to 13: Real gaps, expect 15 to 25% over-attribution somewhere
0 to 7: Tracking is structurally broken, freeze spend increases until fixed
Here's a real-pattern week from a €4M ARR Shopify store I sat with:
Weekly Reconciliation, Shopify as Ground Truth
Source
Reported Revenue
Variance vs Shopify
Shopify (truth)
€60,000
baseline
GA4
€58,200
-3.0% ✅
Meta Ads (7-day click + 1-day view)
€92,400
+54% ❌
Google Ads (data-driven)
€71,100
+18.5% ⚠️
Reading the variance bands:
±5 to 10%: normal noise from view-through, attribution lag, refunds
10 to 20%: one specific failure (usually CAPI dedup or enhanced conversions missing)
>20%: structural problem (multiple pixels firing, attribution-window mismatch, or platform self-attribution running unchecked)
In this store's case, the 54% Meta gap was 100% view-through purchases attributed to Meta that Google's last-click model also claimed. The 18.5% Google gap was missing enhanced conversions plus a duplicate purchase event firing on the thank-you page. Both were 1-hour fixes. For deeper context on Google Analytics for ecommerce, we cover the same dedup logic from the GA4 side.
🔁 The 5 root causes that recur in every audit
In our work auditing live Shopify stores, the same five issues surface roughly 70% of the time:
❌ Meta Pixel and CAPI not deduplicated by event_id
❌ Google Ads enhanced conversions disabled or unverified
❌ Mixed attribution windows reported in different meetings
❌ Treating Meta-reported revenue as actual revenue in budget reviews
"Triple Whale shows orders from external marketplaces as if they were real conversions even though these orders never go through our Shopify store and could not possibly be tracked. Completely fake data." XTRA FUEL Triple Whale Trustpilot Verified Review
"The pre-built templates and reports are somewhat usable, but overall it has been unable to deliver on the promise to provide any insights or accurate data to our business, and we end up reverting back to direct data sources like Meta, Shopify, Recharge, etc." Matt Huttner Triple Whale Trustpilot Verified Review
What looking at hundreds of these audits has taught me is that the diagnostic isn't optional. Founders who skip it spend the next quarter optimizing campaigns against fake numbers, and the math always catches up. If your current dashboard keeps disagreeing with Shopify, the broader category of Triple Whale alternatives is worth a hard look.
Before your next ad spend cycle, run this 8-question diagnostic and fix every check that scored 0. The reconciliation alone usually claws back 10 to 20% of measurement accuracy in under 4 hours.
Q4: How Do You Set Up Conversion Tracking Step-by-Step Across Shopify, GA4, Meta CAPI, Google Ads, TikTok, and Klaviyo? [toc=4. Step-by-Step Setup]
Set up in this order: GTM via Shopify checkout extensibility, then GA4 with recommended ecommerce events, then Meta Pixel + CAPI with event_id deduplication, then Google Ads enhanced conversions, then TikTok Events API, then Klaviyo Active on Site and Placed Order events. Verify each via DebugView and Event Match Quality. Budget 4 to 6 hours and a test order on every channel before going live.
Step 1: Install Google Tag Manager via Shopify checkout extensibility
Use Shopify's customer events / web pixel extension to deploy GTM, do not paste GTM into theme.liquid for checkout pages
Set the data layer to push: event name, currency, value, items array, transaction_id
Verify GTM Preview mode fires on /products, /cart, /checkout, and /thank_you
Step 2: Wire GA4 with recommended ecommerce events
In GA4 Admin → Data Streams, confirm the measurement ID matches the GTM tag
Mark purchase as a "key event" (formerly conversion)
Verify in DebugView that each event fires with full parameters
Our complete Shopify analytics guide covers the GA4 wiring in more depth if your data layer is empty today.
Step 3: Add Meta Pixel and Conversions API with event_id deduplication
Install the official Meta sales channel for Shopify, then enable CAPI in Meta Events Manager
Set Maximum dataset usage to "Maximum" for purchase, ATC, and InitiateCheckout
Pass a shared event_id from the data layer to both Pixel and CAPI for every event
Target Event Match Quality (EMQ) ≥7.0 by sending email, phone, fbp, fbc, IP, and user agent server-side
Step 4: Enable Google Ads enhanced conversions
In Google Ads → Goals → Conversions, toggle Enhanced Conversions ON for purchase
Choose the Google tag method (preferred) or API
Map first_name, last_name, email, phone, and address from the data layer
Wait 7 days, then check the Diagnostics tab. Coverage should be ≥70%
Step 5: Install TikTok Events API
Install TikTok's Shopify channel app, then enable both Pixel and Events API in TikTok Ads Manager
Map purchase, AddToCart, InitiateCheckout, and ViewContent
Verify EMQ in TikTok's diagnostics; aim for ≥7.0
Step 6: Configure Klaviyo for retention-side conversion tracking
Connect Klaviyo's Shopify integration; confirm Active on Site and Placed Order events are flowing
Add Started Checkout, Added to Cart, Viewed Product, and Back in Stock events for flow targeting
Pass UTMs into Klaviyo so flow-attributed revenue is reconcilable to ad spend
📋 Event-mapping cheat sheet
Funnel-to-Platform Event Mapping
Funnel Step
GA4
Meta
Google Ads
TikTok
Klaviyo
Product viewed
view_item
ViewContent
-
ViewContent
Viewed Product
Add to cart
add_to_cart
AddToCart
-
AddToCart
Added to Cart
Checkout started
begin_checkout
InitiateCheckout
-
InitiateCheckout
Started Checkout
Payment info
add_payment_info
AddPaymentInfo
-
AddPaymentInfo
-
Purchase
purchase
Purchase
conversion
CompletePayment
Placed Order
What most stores skip (and pay for)
After running this checklist on dozens of Shopify stores, the same three gaps appear: missing event_id deduplication on Meta (causes 30 to 50% double-counting), enhanced conversions toggled but never verified in Diagnostics (silent failure for months), and Klaviyo Started Checkout firing without UTMs (kills flow ROI attribution). Founders comparing tools at this stage often start with our roundup of the best Shopify analytics apps.
Before your next ad spend cycle, run a real test order. Open Meta Events Manager, GA4 DebugView, Google Ads Diagnostics, TikTok Events Manager, and Klaviyo's metric explorer side-by-side. Every channel should see exactly one purchase, with the same event_id, within 60 seconds. If even one channel misses it, do not increase spend.
Q5: When Should You Move to Server-Side Tracking (sGTM, Stape), and How Do You Implement It Without Over-Engineering? [toc=5. Server-Side Tracking]
Server-side tagging is a parallel data pipeline that fires conversion events from your own server to ad platforms, instead of from the user's browser. Move to it once you cross ~€50K/month in ad spend or notice a Meta Event Match Quality (EMQ) score below 7.0. sGTM via Google Cloud Run or Stape recovers 10 to 25% of lost iOS App Tracking Transparency (ATT) and ad-blocker events. Below €50K/month, native CAPI (Conversions API) from Shopify is usually enough.
Adoption thresholds for server-side tagging map directly to ad spend bands. Below €30K per month, native CAPI is enough.
How server-side tagging actually works
Client-side tags fire from the browser, which means iOS, Safari, ad blockers, and consent denials can kill the event before it reaches Meta or Google. Server-side tagging routes that same event through a server you control (sGTM on Google Cloud Run, or Stape's hosted version), then forwards it to ad platforms using first-party context.
The mechanics are simple. Your data layer pushes the event. The server receives it, enriches it with first-party identifiers (email hash, phone hash, IP, user agent), and forwards it to Meta CAPI, Google Ads, and TikTok Events API. Same event_id used client-side for deduplication. Our broader take on ecommerce website analytics covers where server-side fits in the wider stack.
✅ What server-side tagging recovers
iOS ATT-blocked events (typically 20 to 30% of mobile Meta events)
Ad-blocker dropped events (8 to 15% of total traffic, higher on tech audiences)
Safari ITP (Intelligent Tracking Prevention) events lost after 7 days
Consent-denied events that can still fire server-side under legitimate interest
Higher Event Match Quality, usually +1.5 to +2.5 points on Meta
⏰ When to adopt, when to wait
Server-Side Tagging Adoption Thresholds by Ad Spend
Ad Spend / Month
Recommendation
Why
Below €30K
Wait
Native CAPI from Shopify is enough; sGTM complexity outweighs lift
€30K to €50K
Optional
Move only if EMQ < 7.0 or iOS traffic > 50%
€50K to €150K
Adopt
sGTM via Stape, payback inside 30 days
€150K+
Required
Self-hosted sGTM on GCP, full data layer governance
sGTM vs native CAPI, the honest comparison
✅ Native Shopify CAPI is fast to enable, requires zero infrastructure, and covers the basics for stores under €50K/month spend.
✅ sGTM (Google Cloud Run or Stape) recovers 10 to 25% more events, gives you first-party data control, and future-proofs against the death of third-party cookies.
❌ Native CAPI alone leaves iOS and ad-blocker events on the table once you scale.
✅ sGTM lets you enrich events with CRM data, deduplicate properly, and route to multiple destinations (Meta, Google, TikTok, and Klaviyo) from one pipeline. For founders evaluating broader tooling, our roundup of the best Shopify analytics apps covers where sGTM data lands downstream.
❌ sGTM costs €100 to €500/month in hosting and 8 to 12 hours of setup; over-engineering it below €30K spend is a real regret pattern.
The pattern I keep seeing
After auditing dozens of Shopify stores, the regret cuts both ways. Stores under €30K/month who deployed sGTM in 2024 burned 20+ hours and now maintain a pipeline they barely use. Stores at €80K+/month still on client-side only are leaking 15 to 20% of their Meta optimization signal and don't know it. The same kind of over-engineering shows up in our breakdown of why e-commerce founders are drowning in data.
The Stape and Google Cloud Run setups are mature enough now that a competent agency can stand it up in a weekend. Don't DIY this if you've never deployed a container.
Before your next ad spend cycle, check your Meta Event Match Quality score in Events Manager. If it's below 7.0 and you're spending over €50K/month, sGTM pays back inside 30 days. If you're under that threshold, leave it alone for another quarter.
Q6: Which Attribution Window and Model Should You Use, and How Do They Map to Your AOV and Consideration Cycle? [toc=6. Attribution Windows]
Default to 7-day click / 1-day view for ad-platform optimization. Report on 28-day click for AOV (Average Order Value) >€150 or considered-purchase categories like mattresses, supplements, and electronics. Standardize one window across every dashboard so meetings stop comparing apples to oranges. The window doesn't change reality, it changes how much credit each platform claims.
Why attribution windows matter more than the model
An attribution window is the time period during which a click or view can claim credit for a purchase. Meta's default is 7-day click + 1-day view. Google Ads uses data-driven attribution across 30 days. GA4 uses data-driven by default with a 90-day lookback. Same purchase, three different stories. Founders looking to stop trusting platform-reported ROAS usually start by locking the window first.
The model (last-click, first-click, linear, time-decay, or data-driven) is the second-order question. Get the window standardized first, then argue about models.
📊 The window vs AOV mapping (the angle nobody else publishes)
Attribution Window Selection by AOV and Consideration Cycle
AOV Band
Consideration Cycle
Optimization Window
Reporting Window
€0 to €50 (impulse)
<1 day
7-day click / 1-day view
7-day click
€50 to €150 (standard DTC)
2 to 7 days
7-day click / 1-day view
7-day click
€150 to €500 (considered)
7 to 21 days
7-day click / 1-day view
28-day click
€500+ (high-consideration)
14 to 60 days
7-day click / 1-day view
28-day click + last-touch
The optimization window stays at 7/1 because Meta's bidder learns fastest on tight signals. The reporting window stretches for high-AOV categories because the customer journey actually takes longer. Our guide to tracking e-commerce unit economics walks through how AOV maps into payback and contribution margin.
✅ The 7/1 default for DTC
✅ 7-day click / 1-day view is the practical default Nick Shackelford-style operators run; it matches Meta's bidder optimization and limits view-through inflation.
✅ It produces a more honest ROAS (Return on Ad Spend) number for budget meetings.
❌ 28-day click view-through over-claims. Meta will credit a Facebook scroll from three weeks ago for a sale Google Search closed yesterday.
✅ Layering MER (Marketing Efficiency Ratio = total revenue ÷ total ad spend) on top of the platform-reported ROAS gives you the truth check.
❌ Comparing 7-day click in Monday's meeting to 28-day click in Friday's report is how teams end up scaling losers and killing winners.
What operators actually do
The r/PPC consensus on this is unambiguous, and the thread has roughly 200 practitioner comments confirming the same default. For founders curious about how this plays into capital decisions, our piece on funding to scale e-commerce marketing campaigns covers the next step.
"Perfect attribution is impossible. Pick a window, hold it constant, and use MER as your reality check." practitioner consensus, r/PPC Reddit Thread
"Triple Whale shows 'orders' from external marketplaces that never go through our Shopify store and could not possibly be tracked." XTRA FUEL Triple Whale Trustpilot Verified Review
What I keep telling founders is that the window is a reporting convention, not a measurement of truth. Pick one, lock it across Meta, Google, GA4, and your weekly P&L review. Then use blended MER as the reality check that catches every platform's self-attribution bias.
Before your next ad spend cycle, lock one attribution window across every dashboard, ad account, and team meeting. If Meta's set to 7/1 and your weekly report is pulling 28-day click, your "decisions" are noise.
Q7: Which Conversion Tracking and Attribution Tools Are Worth Paying For, Triple Whale, Cometly, Northbeam, Polar, or Native Stack? [toc=7. Tools Worth Paying For]
Below €1M ARR, native CAPI + GA4 + clean Shopify outperforms most paid tools. Between €1M and €10M, Triple Whale or Polar speed up reconciliation but bring their own discrepancies. Above €10M, Northbeam plus incrementality testing becomes defensible. Tools don't fix bad tracking, they visualize it. Fix the foundation first.
The comparison context
The paid attribution tool category exists because reconciling Shopify, Meta, Google, GA4, and Klaviyo manually is painful. Each tool layers a unified dashboard, a deduplication engine, and (usually) a first-party pixel on top. The tradeoffs are real. Our roundup of ecommerce analytics platforms walks through the wider category.
✅ Free, no extra subscription, full data ownership.
✅ Sufficient for stores under €1M ARR running 1 to 3 ad channels.
❌ Manual reconciliation eats 4 to 6 hours/week as you scale.
❌ No unified pixel, no built-in incrementality testing.
Triple Whale
✅ Fast Shopify-native dashboard, strong creative analytics, popular with sub-€10M DTC.
❌ Documented attribution discrepancies and "fake" external-marketplace orders.
❌ Pricing scales with order volume, not always defensible past €10M. For deeper context, our breakdown of Triple Whale alternatives covers the full landscape.
"Triple Whale shows orders from external marketplaces as if they were real conversions even though these orders never go through our Shopify store and could not possibly be tracked. Completely fake data." XTRA FUEL Triple Whale Trustpilot Verified Review
Polar Analytics
✅ Cleaner dashboards, good GA4 + Klaviyo + Meta integration, popular with European DTC.
✅ Stronger native cohort and LTV reporting than Triple Whale.
❌ Still a reporting layer, not a data warehouse; ETL discrepancies persist.
Northbeam
✅ Best-in-class for stores above €10M ARR running incrementality testing.
✅ Granular media-mix modeling and view-through rigor.
❌ €3K to €10K/month, requires a dedicated analyst to extract value.
❌ Overkill below €5M ARR.
Cometly
✅ Affordable, lead-gen and DTC-friendly, strong Meta CAPI hygiene.
Conversion Tracking Tool Comparison Across 6 Criteria
Tool
Best For
Setup Time
Monthly Cost
Attribution Rigor
Incrementality
Native Stack
<€1M ARR
4 to 6 hrs
€0
Medium
None
Triple Whale
€1M to €10M DTC
2 to 4 hrs
€300 to €2K
Medium
Limited
Polar Analytics
€1M to €10M EU DTC
4 to 8 hrs
€400 to €2K
Medium-High
Limited
Cometly
€500K to €5M lean
2 to 3 hrs
€200 to €800
Medium
None
Northbeam
€10M+ ARR
2 to 4 weeks
€3K to €10K
High
Strong
Who should choose what
Below €1M ARR, the answer is almost always native plus a clean reconciliation habit. Between €1M and €10M, Triple Whale or Polar earn their spot if reconciliation is eating analyst time, but never trust the headline number without a Shopify cross-check. Above €10M, Northbeam plus formal incrementality testing pays back.
"Pre-built templates and reports are somewhat usable, but overall it has been unable to deliver on the promise to provide any insights or accurate data, and we end up reverting back to direct data sources like Meta, Shopify, Recharge." Matt Huttner Triple Whale Trustpilot Verified Review
After looking at hundreds of stacks side by side, what jumps out is that the tool rarely fixes the problem. Stores with broken events at the Shopify layer get prettier dashboards on top of broken events. Foundation first, dashboard second.
Before your next ad spend cycle, score your current tool against this rubric. If you're paying €500+/month for a dashboard that still disagrees with Shopify by more than 15%, the spend isn't pulling its weight.
Q8: How Do You Turn Clean Conversion Data Into a Monday-Morning Ad Spend Decision Workflow? [toc=8. Monday-Morning Workflow]
Pre-commit decision rules in writing. Scale when 7-day MER ≥ target and CAC payback <60 days. Kill when MER drops 20% below target for 3 consecutive days. Reallocate when one channel's incremental MER beats blended by >15%. Rules remove emotion from 11 PM budget calls.
Why rules beat instincts
Clean tracking is the input. Decisions are the output. Most founders have one and not the other; they spent six weeks fixing CAPI and still walk into Monday's ad meeting "going with their gut". Pre-committed rules turn the data into action without re-litigating the same debate every week. Our piece on agentic AI for ecommerce founders covers how this loop becomes self-running.
A real Monday morning, time-stamped
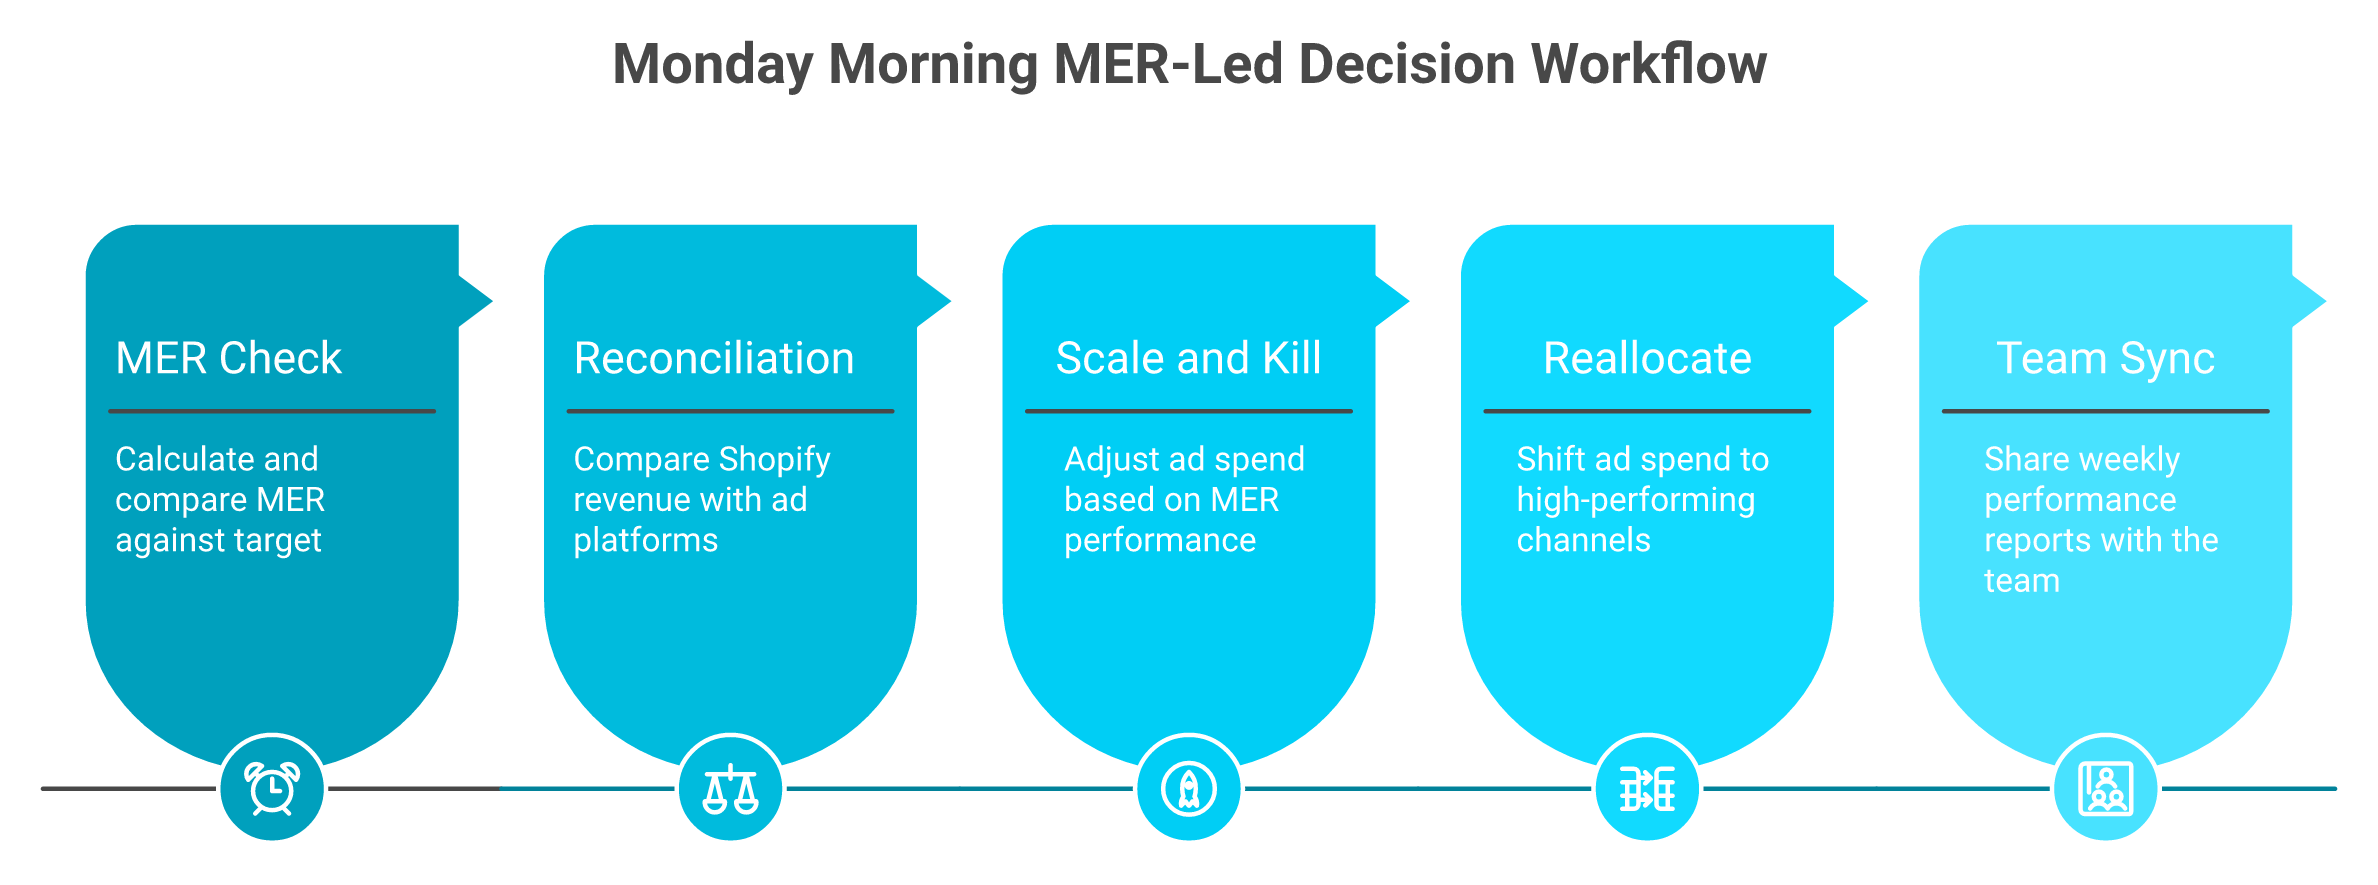
A pre-committed Monday workflow turns clean conversion data into scale, kill, and reallocate decisions before lunch.
8:00 AM, the MER check. Open the weekly P&L view. Pull total revenue ÷ total ad spend for last 7 days. Target is 3.2x. Actual: 3.4x. Green light, no global cuts.
9:00 AM, the reconciliation. Shopify revenue: €68,400. Meta-claimed: €52,000. Google-claimed: €31,000. Variance vs Shopify: well within ±10% once view-through is removed. Numbers are trustworthy this week.
10:00 AM, scale and kill decisions. Two campaigns hit MER ≥ target three days running, with CAC payback under 60 days. Scale spend +20%. One campaign dropped to 1.8x MER for four straight days. Kill it. The rules already wrote the decision; I'm just executing.
11:00 AM, reallocation. TikTok blended MER hit 4.1x, beating overall blended by 22%. Move €5K from Meta prospecting to TikTok creative testing. The threshold rule fired automatically.
2:00 PM, the team sync. Share the auto-generated weekly report. CAC by channel, MER trend, contribution margin, and cash position. Three decisions made, zero re-debates. Head of Growth has clarity for the week.
📋 The decision rulebook (write this once, use it forever)
✅ Scale: 7-day MER ≥ target AND CAC payback <60 days for 3 consecutive days
❌ Kill: 7-day MER drops 20% below target for 3 consecutive days
🔁 Reallocate: a channel's incremental MER beats blended by >15% for 7 days
⏸️ Hold: any campaign with <7 days of data, regardless of how good the early ROAS looks
⚠️ Pause and audit: variance between Shopify and platform-reported revenue exceeds 15%
MER as North Star, ROAS as a directional signal
✅ MER captures the blended efficiency of every euro spent across every channel. ✅ It's the only metric that survives Meta's self-attribution, Google's last-click bias, and GA4's consent gaps simultaneously. ❌ Per-platform ROAS in isolation will tell you to scale a campaign that's cannibalizing organic and email. ✅ Pre-committed scale/kill thresholds turn the math into Monday decisions instead of Thursday-night debates. Our cash flow forecast guide shows how MER feeds straight into weekly cash planning.
What an AI layer over your data warehouse changes here
This is where the workflow becomes a conversation. Most analytics tools added AI on top of dashboards. We built Luca as an AI layer over your data warehouse. You ask "what's my 7-day MER by channel, with CAC payback and contribution margin, against last week's baseline?" in plain English, and the answer comes back in seconds with the reasoning shown. Founders who want the deeper thesis can read the intelligence capital thesis.
Luca scans the data 24/7 and pings you on Slack or email when MER drops below threshold, ROAS dips, or CAC spikes. We push customized weekly reports with graphs, root-cause reasoning, and recommendations directly into the channels you already use. The Monday Excel shudder goes away because the report writes itself. For broader use cases, see our marketing analysis and automation page.
After watching dozens of founders run this loop manually for a year, what jumps out is how much of "running ads" is actually running spreadsheets. The founders who win their next quarter aren't the ones with the prettiest dashboards. They're the ones whose decision rules are written down, and whose data layer can answer the question in plain English at 8 AM Monday.
Before your next ad spend cycle, write your scale, kill, and reallocate thresholds on paper. Tape them to the monitor. The 11 PM gut calls are where the leakage lives.
Q9: Why Most Analytics Tools Stop at Dashboards, and What an AI Layer Over Your Data Warehouse Actually Does Differently [toc=9. AI Layer vs Dashboards]
Dashboards show what happened. An AI layer over your data warehouse extracts the relevant slice for the question you actually have, finds root causes, simulates outcomes, identifies influencing components, flags optimized versus underperforming areas, and pushes customized reports to Slack and email on a schedule you set. The query replaces the dashboard.
What this category actually is
This is not an attribution tool, and it is not a BI dashboard. It is an AI layer that sits on top of your unified data warehouse (Shopify, Meta, Google, GA4, Klaviyo, Xero, and Stripe), connected once and normalized on ingestion. You ask questions in plain English. The system writes the queries, joins the tables, and explains the answer with reasoning shown. Founders curious about the deeper thesis can read what is an AI Co-Founder for e-commerce.
The architectural difference matters for the Head of Finance reconciling three versions of "true MER" before Tuesday's leadership sync. Dashboards force you to predefine views, then check them. An AI layer over the warehouse handles the question you didn't predefine, including the cross-functional ones that span marketing, finance, and operations in a single answer.
⚙️ How it actually works
You connect data sources once. The system normalizes and standardizes on ingestion, which kills the "data-cleanup year" most stores spend before they get value.
You ask a question in plain English. No SQL, no analyst, and no dashboard-building.
The system retrieves the relevant slice, runs the analysis, and returns the answer with reasoning, charts, and confidence level.
You can pin the question as a recurring task. The system runs it on schedule and pushes the result to Slack, email, or app notifications.
Root-cause analysis. Ask "why did CAC spike on Tuesday?" and get the answer broken down by channel, creative, audience, and landing page, with the influencing components ranked.
Simulation. Ask "what happens to contribution margin if I shift €10K from Meta to TikTok for 14 days?" and get a modeled scenario with the assumptions exposed.
Prediction. Forecast revenue, inventory depletion, or CAC trajectory based on historical patterns the system has learned across months and years.
Influencing-component analysis. Identify which metrics are pulling a result up or down, even when the relationship is indirect (e.g., shipping delays driving refund spikes that distort cohort LTV).
Optimized-area detection. Flag where the business is already running well so you stop tinkering with what works.
Agentic push reports. Schedule a weekly CAC report with graphs, reasoning, and recommendations to land in your inbox every Monday at 8 AM. The Monday Excel shudder goes away.
For founders who want a deeper read on this loop, our piece on agentic AI for ecommerce founders covers how proactive monitoring replaces manual exports.
❌ Why dashboards keep losing this race
✅ An AI layer reasons across marketing, finance, and operations in one answer. ✅ It scans your data 24/7 and pings you when ROAS dips, inventory falls below threshold, or CAC spikes. ❌ A dashboard waits for you to log in, build a view, and notice the anomaly yourself. ✅ The AI layer outputs cohort-level vigilance without making you build a cohort-level dashboard. ❌ Most analytics tools added an AI chat feature on top of static reports; the architecture underneath is still pull-based, not agentic. Our deeper take on how AI can actually help you run your e-commerce business covers the architectural shift in detail.
This is the lane Luca operates in. Most analytics tools added AI. Luca is AI. The difference shows up in how the founder's Monday actually feels. For a structured walkthrough, see meet Luca AI.
After watching dozens of operators run weekly reporting manually, what jumps out is how much of "running a Shopify business" is just glueing together exports. The shift to a query-driven model is the single biggest unlock I've seen this year. Founders comparing categories often start with our list of the best AI tools for Shopify owners.
Before your next ad spend cycle, ask one cross-channel question your current dashboard can't answer in 60 seconds. If the answer takes more than a minute or requires three exports, the dashboard is the problem, not the data.
Q10: How Does Embedded Capital for Conversion-Tested Campaigns Compare on Rate, Disbursal Time, and Dynamic Pricing? [toc=10. Embedded Capital Comparison]
Once a campaign clears your MER threshold, the bottleneck stops being analysis. It becomes capital speed. Compared on rate, disbursal time, dynamic versus static pricing, and personal guarantees, embedded capital underwrites against real-time tracked performance instead of a 60-day-old static application. Funds deploy in hours rather than weeks.
The comparison context
Capital for ecommerce comes in three operational shapes. Traditional bank lines, which take 6 to 8 weeks and require personal guarantees. Revenue-based financing (RBF) providers like Wayflyer and Clearco, which underwrite on static applications and quote a fixed factor rate. Embedded capital that prices dynamically against live business performance and disburses in hours. The metrics that matter for the founder are the same in every case: rate, speed, pricing model, and personal guarantee (PG). Founders deciding between options often start with our guide to funding e-commerce marketing campaigns.
Wayflyer
✅ Brand recognition, large funding amounts available for €5M+ ARR brands.
❌ Underwriting inconsistency, rate drift, and acrimonious renewals are the recurring complaints in 2025 to 2026 reviews. For deeper context, see our list of Wayflyer alternatives.
"After being offered funding in writing with specific amounts, repayment terms, and confirmation that the deal was approved, Wayflyer abruptly reversed their decision at the last minute. This caused significant disruption to our operations and cash flow." Geoff Brand Wayflyer Trustpilot Verified Review
"We handed them two stores' performance data on a platter, clean revenue, consistent orders, and clear repayment strength. Days of silence. Confusing, copy-and-paste answers. Zero ownership." Gemma Wayflyer Trustpilot Verified Review
Clearco
✅ Originally pioneered RBF for DTC, with a large funded base.
❌ Effective APRs of 35 to 40% reported in 2024 to 2025, weak support, and aggressive repayment mechanics. Our roundup of Clearco alternatives covers what 2026-era founders are picking instead.
"Pretty expensive product at 35 to 40% APR. Even worse support. Made me jump through hoops." Julian Fernau Clearco Trustpilot Verified Review
Uncapped
❌ Recent reviews flag mid-deal funding cuts and last-minute term changes during critical growth windows.
"We signed a $3M loan deal, only for them to come back two weeks later saying, 'Oops, our C-suite decided to focus on Amazon deals,' slashing our funding to $1M." Xin Shui Uncapped Trustpilot Verified Review
8fig
✅ Strong on planning workflows for Amazon-heavy sellers.
❌ Static repayment plans that don't flex when the business shifts. Our piece on calculating working capital for e-commerce covers how to right-size whichever option you pick.
📊 Head-to-head on the metrics that actually matter
Embedded Capital vs RBF Providers, Head-to-Head
Provider
Effective Rate
Disbursal Time
Pricing Model
Personal Guarantee
Application Length
Traditional bank
8 to 14% APR
6 to 8 weeks
Static
Required
4 to 6 weeks
Wayflyer
6 to 12% factor
1 to 7 days
Static factor
Sometimes
3 to 7 days
Clearco
35 to 40% effective APR
2 to 7 days
Static factor
No
2 to 5 days
Uncapped
Variable
7 to 14 days
Static
No
5 to 10 days
8fig
Variable
7 to 14 days
Static plan
No
7 to 14 days
Embedded (Luca)
Dynamic, real-time
Hours
Dynamic, performance-tied
No
One-click in chat
Who should choose what
✅ Traditional banks: stores willing to trade speed for the cheapest rate, and who can clear a personal guarantee.
✅ Wayflyer / Clearco: stores above €3M ARR who need quick, larger ticket sizes and accept rate inflexibility. Our head-to-head on Luca AI vs Wayflyer covers the live differences.
❌ Skip RBF if you are below €1M ARR and need flexible repayment that flexes with this week's revenue, not last quarter's snapshot.
✅ Embedded capital: stores running clean conversion tracking, where the underwriting can read live MER, CAC payback, and inventory velocity, then price dynamically to that performance.
The differentiator is not "we also have analytics". The differentiator on the capital side is rate honesty, hours-not-weeks disbursal, dynamic pricing tied to current performance, and zero personal guarantees. That's what we compete on. Our piece on the intelligence capital thesis covers why the architecture matters.
"Their staff is filled with very friendly, enjoyable people. But at the end of the day, their job is purely sales." Mike M Wayflyer Trustpilot Verified Review
Before your next ad spend cycle, time how long it would actually take you to access €25K. That number is your real scaling speed. If it's measured in weeks, you're not constrained by tracking, you're constrained by capital.
Q11: What Are the Highest-Frequency Tracking Mistakes to Fix Before Your Next Ad Spend Cycle? [toc=11. Top Tracking Mistakes]
Five mistakes recur in 100+ store audits: duplicate purchase events, missing event_id deduplication between Pixel and CAPI, ignoring Google enhanced conversions, mixed attribution windows across reports, and treating Meta-reported revenue as actual revenue. Each takes under one hour to fix and typically recovers 10 to 20% measurement accuracy.
🔧 The 5-mistake fix list
1. ❌ Duplicate purchase events
What's broken: Two pixels firing on the thank-you page (often a legacy Shopify app plus the new Meta sales channel). Result: Meta and GA4 over-count purchases by 40 to 100%.
1-hour fix: Open GTM Preview mode, place a test order, and count how many purchase events fire. If more than one, identify the rogue tag and disable it. Verify in Meta Events Manager that the count matches Shopify orders 1:1. Our Shopify analytics dashboard guide walks through where to confirm the order count.
Expected lift: 30 to 50% drop in over-attribution.
2. ❌ Missing event_id deduplication between Pixel and CAPI
What's broken: Meta Pixel fires client-side, CAPI fires server-side, and both lack a shared event_id, so Meta treats them as two separate events.
1-hour fix: Push a unique event_id through the data layer to both Pixel and CAPI for every event. Confirm in Meta Events Manager that "Deduplication" status reads "Active" with >95% match rate.
Expected lift: Cleaner Event Match Quality (EMQ), +1.0 to 2.0 score points, and lower reported CPM.
3. ❌ Google Ads enhanced conversions disabled or unverified
What's broken: Enhanced conversions toggled but never verified in the Diagnostics tab, which means user-provided data isn't actually flowing.
1-hour fix: Google Ads → Goals → Conversions → Enhanced Conversions. Confirm "Recording" status is green. Check Diagnostics for ≥70% coverage. If lower, fix the data layer mappings for first_name, last_name, email, and phone. Our walkthrough on Google Analytics for ecommerce covers the data layer mapping in detail.
Expected lift: 5 to 15% recovery of attributable Google conversions, especially on iOS.
4. ❌ Mixed attribution windows across reports
What's broken: Meta set to 7-day click + 1-day view in the platform, but the weekly P&L pulls 28-day click. Same campaign, two stories.
1-hour fix: Pick one window (7-day click + 1-day view for most DTC) and lock it across Meta, Google Ads, GA4, and every internal report. Document it.
Expected lift: Comparable numbers across the board, and no more apples-to-oranges debates in Monday meetings. Our piece on declining platform ROAS covers why MER is the better north star.
5. ❌ Treating Meta-reported revenue as actual revenue
What's broken: Budget decisions made against Meta's "Purchase conversion value" instead of Shopify's order data, which is the only true source of revenue.
1-hour fix: Build a one-row weekly reconciliation. Shopify revenue ÷ total ad spend = MER (Marketing Efficiency Ratio). Make MER the headline metric in every spend meeting.
Expected lift: 15 to 25% better budget decisions, because the headline number stops lying.
Why these five recur everywhere
In our work auditing live Shopify stores, these same five issues show up in roughly 70% of cases. None of them require a rebuild. None of them require a new tool. They take an afternoon, they pay back inside one weekly spend cycle, and most stores never bother because nobody told them which lever moved the needle. For founders who keep finding the same gaps, our roundup of the 7 best e-commerce analytics tools that fund your campaigns covers what to plug in next.
Before your next ad spend cycle, fix at least the top three. They recover the majority of the leakage. Everything else is optimization on top of a foundation that's already working.
Q12: What I'm Thinking About Next [toc=12. Looking Ahead]
The thing I keep chewing on is where this all heads in 2027. Conversion tracking has spent the last five years getting more precise on a measurement model that's slowly being deprecated underneath us. Cookies are mostly gone. iOS keeps tightening. Consent denials keep climbing. Our piece on why e-commerce founders are drowning in data sits right at the heart of this shift.
My read right now is that the next 18 months belong to operators who treat their data warehouse as the source of truth and let an AI layer reason across it, instead of stitching together pixel reports. The agentic shift is real. The Monday Excel shudder is going to feel as dated as paper invoices by 2027. Founders building ahead of that curve usually start with our guide to AI for e-commerce cash flow forecasting.
I could be off on this. But the pattern I'm watching is that the founders who win their next quarter aren't the ones with prettier dashboards. They're the ones whose decision rules are written down, whose data layer can answer the question in plain English, and whose capital moves at the speed of their tracking. For a structured read on this thesis, see our piece on what is Luca AI, the AI Co-Founder for e-commerce explained.
If you've fixed your foundation and you're still flying blind on Mondays, that's the conversation I want to have. Reply, send me your reconciliation worksheet, or just tell me what's breaking this week.
FAQ's
Why is our ecommerce conversion tracking off by 20 to 50% across Meta, Google, GA4, and Shopify?
The variance is structural, not a bug in any one platform. Meta self-attributes view-through purchases on a 7-day click plus 1-day view window. Google Ads runs data-driven attribution and claims last-click sales Meta initiated. GA4 drops sessions when consent is denied. Shopify only sees the order itself.
Layered on top, iOS App Tracking Transparency strips roughly 20 to 30% of mobile pixel events. Safari and Firefox cap cookies at 7 days. Ad blockers nuke another 8 to 15% of events. The pixel installed in 2022 is now telling a story missing a third of its chapters.
The fix sequence we recommend:
Anchor on Shopify orders as the only true source of revenue.
Reconcile weekly against GA4, Meta CAPI, and Google Ads with a fixed attribution window.
Use MER (Marketing Efficiency Ratio) as the blended truth check.
Which attribution window and model should we use for our DTC store?
Default to 7-day click plus 1-day view for ad-platform optimization. This matches Meta's bidder learning loop and limits view-through inflation. For high-AOV or considered-purchase categories (mattresses, supplements, electronics), report on a 28-day click window for the executive view, while keeping the 7/1 window for optimization.
Map the window to your AOV band:
€0 to €150 AOV: 7-day click everywhere.
€150 to €500 AOV: 7-day click for optimization, 28-day click for reporting.
€500+ AOV: 7-day click optimization, 28-day click plus last-touch for reporting.
The model (last-click, linear, time-decay, data-driven) is the second-order question. The window is the first-order one. Lock one window across Meta, Google, GA4, and your weekly P&L, then layer MER as the reality check.
When should we move to server-side tracking with sGTM or Stape, and when is it over-engineering?
Server-side tagging routes events from a server you control to Meta CAPI, Google Ads, and TikTok Events API, recovering iOS, ad-blocker, and consent-denied events that client-side pixels lose.
The adoption thresholds we use after auditing dozens of stores:
Below €30K per month in ad spend: Wait. Native Shopify CAPI is enough.
€30K to €50K per month: Optional. Move only if Meta Event Match Quality (EMQ) is below 7.0 or iOS traffic exceeds 50%.
€50K to €150K per month: Adopt sGTM via Stape. Payback inside 30 days.
€150K+ per month: Required. Self-hosted sGTM on Google Cloud Run.
sGTM costs €100 to €500 per month in hosting and 8 to 12 hours of setup. Below €30K monthly spend, the complexity outweighs the lift, and we have watched stores burn 20+ hours maintaining a pipeline they barely use.
Are paid attribution tools like Triple Whale, Polar, or Northbeam worth it, or is the native stack enough?
The honest answer depends on revenue band, not feature checklists.
Below €1M ARR: Native CAPI plus GA4 plus clean Shopify outperforms most paid tools. Save the €300 to €2K per month.
€1M to €10M ARR: Triple Whale or Polar speed up reconciliation, but bring documented discrepancies. Never trust the headline number without a Shopify cross-check.
€10M+ ARR: Northbeam plus formal incrementality testing earns its keep at €3K to €10K per month.
Tools do not fix bad tracking. They visualize it. Stores with broken events at the Shopify layer get prettier dashboards on top of broken events. Foundation first, dashboard second.
For founders pressure-testing their current vendor, our roundup of Triple Whale alternatives covers what 2026-era operators are picking instead.
How does embedded capital tied to conversion data compare with Wayflyer, Clearco, 8fig, and Uncapped?
Once a campaign clears your MER threshold, the bottleneck stops being analysis. It becomes capital speed. The metrics that matter are rate, disbursal time, pricing model, and personal guarantee.
Wayflyer: Strong brand, but underwriting inconsistency and rate drift recur in 2025 and 2026 reviews.
Clearco: Effective APRs of 35 to 40% reported, weak support.
Uncapped: Recent reviews flag mid-deal funding cuts and last-minute term changes.
8fig: Static repayment plans that do not flex when the business shifts.
Embedded capital underwrites against real-time tracked performance, prices dynamically against live MER and inventory velocity, and disburses in hours instead of weeks. There is no personal guarantee, and the application is a one-click in chat instead of a multi-week PDF round.
.svg)
.svg)


.svg)
.webp)

.png)
