9 Best Cross Channel Analytics Tools for Ecommerce in 2026
12
mins read
TL;DR
The nine best cross-channel analytics tools for ecommerce in 2026 are Luca AI, Triple Whale, Polar Analytics, Northbeam, Google Analytics 4, Glew, Daasity, Lifetimely, and Peel.
Gross margin and platform ROAS mislead founders because they hide shipping, returns, fees, and discounts, the eight costs where real profit quietly bleeds out.
Cross-channel analytics unifies ads, email, commerce, and returns into one view; it is not an attribution pixel, and it matters more since iOS tracking degraded.
GMV-based pricing climbs automatically as revenue grows, so model the three-year cost curve and read the annual-contract lock-in before signing.
Do not buy early: thin or dirty data produces confident-looking noise, so wait for two-plus paid channels, clean order history, and real hours lost.
Cross-functional beats cross-channel; connecting finance and cash to marketing is the frontier, and Luca AI is built to reason across all three.
Q1: What Are the 9 Best Cross Channel Analytics Tools for Ecommerce in 2026? [toc=1. The 9 Best Tools]
For years, the biggest bet I keep making with operators is simple: the category is moving from monitoring to recommending, from "here is your dashboard" to "here is the turn you should take." The nine tools below are the ones worth your time in 2026, and I have ranked them by how close each gets to that shift, not by brand size. The best cross-channel analytics tools for ecommerce in 2026 are Luca AI, Triple Whale, Polar Analytics, Northbeam, Google Analytics 4, Glew, Daasity, Lifetimely, and Peel. Each solves a different job, so match the tool to the question you actually lose sleep over.
1.1 Luca AI: Best for AI-native cross-channel analysis and prescriptive recommendations
1.2 Triple Whale: Best for DTC marketing attribution and daily profit tracking
1.3 Polar Analytics: Best for warehouse-native, unlimited-source reporting
1.4 Northbeam: Best for paid-media attribution at higher ad spend
1.5 Google Analytics 4: Best free tool for traffic and web behavior
1.6 Glew: Best for multi-store and multi-channel BI reporting
1.7 Daasity: Best for custom data modeling on a warehouse
1.8 Lifetimely: Best for profit and LTV on Shopify
1.9 Peel: Best for retention and cohort analysis
How We Scored Each Tool
We built a 100-point rubric, then converted the score into a star band so you can skim it. The weighting is deliberate: cross-functional reach and how well a tool turns data into a recommendation matter more to a busy operator than a long feature list.
Scoring Rubric for Cross-Channel Analytics Tools
Criterion
Weight
What It Measures
Cross-Functional Intelligence
25%
Does it reason across channels and surface a recommendation, not just a chart?
Depth of Data Unification
25%
How many sources it connects, and how cleanly it normalizes them
Setup and Usability
20%
Time to first insight, and whether a non-analyst can use it
Pricing Transparency
15%
Clear pricing versus quote-only or GMV-scaled surprises
User Reviews
15%
Verified G2, Trustpilot, and Shopify App Store sentiment
First-party pixel attribution, blended dashboards, anomaly detection, and AI recommendations
DTC brands focused on marketing attribution
$179 / Month to $539+ / Month
Polar Analytics ⭐⭐⭐⭐
Warehouse-native reporting, dedicated Snowflake DB, unlimited sources, and first-party pixel
Brands wanting flexible, unified reporting
$720 / Month to $1,020+ / Month
Northbeam ⭐⭐⭐⭐
Multi-touch attribution, media mix modeling, and incrementality
Higher-spend paid-media teams
$1,000 / Month to Custom
Google Analytics 4 ⭐⭐⭐
Traffic, behavior, and acquisition reporting; GA4 event model
Free web and traffic analytics
Free to Custom (360)
Glew ⭐⭐⭐
Multi-store BI, product and customer reporting, and dashboards
Multi-store and agency reporting
$79 / Month to Custom
Daasity ⭐⭐⭐⭐
ETL plus modeling on your warehouse, and custom dashboards
Teams wanting a custom data model
$500 / Month to Custom
Lifetimely ⭐⭐⭐⭐
P&L with COGS, LTV, and cohort reporting on Shopify
Shopify brands tracking profit and LTV
Free to $299+ / Month
Peel ⭐⭐⭐⭐
Automated cohort and retention analytics
Retention and cohort-focused brands
Free to Custom
A note before the deep dives: I could be off on the exact band for a couple of these as pricing keeps shifting with GMV, so treat the stars as directional, not gospel. Now let me walk through the first two.
1.1 Luca AI [toc=1.1 Luca AI]
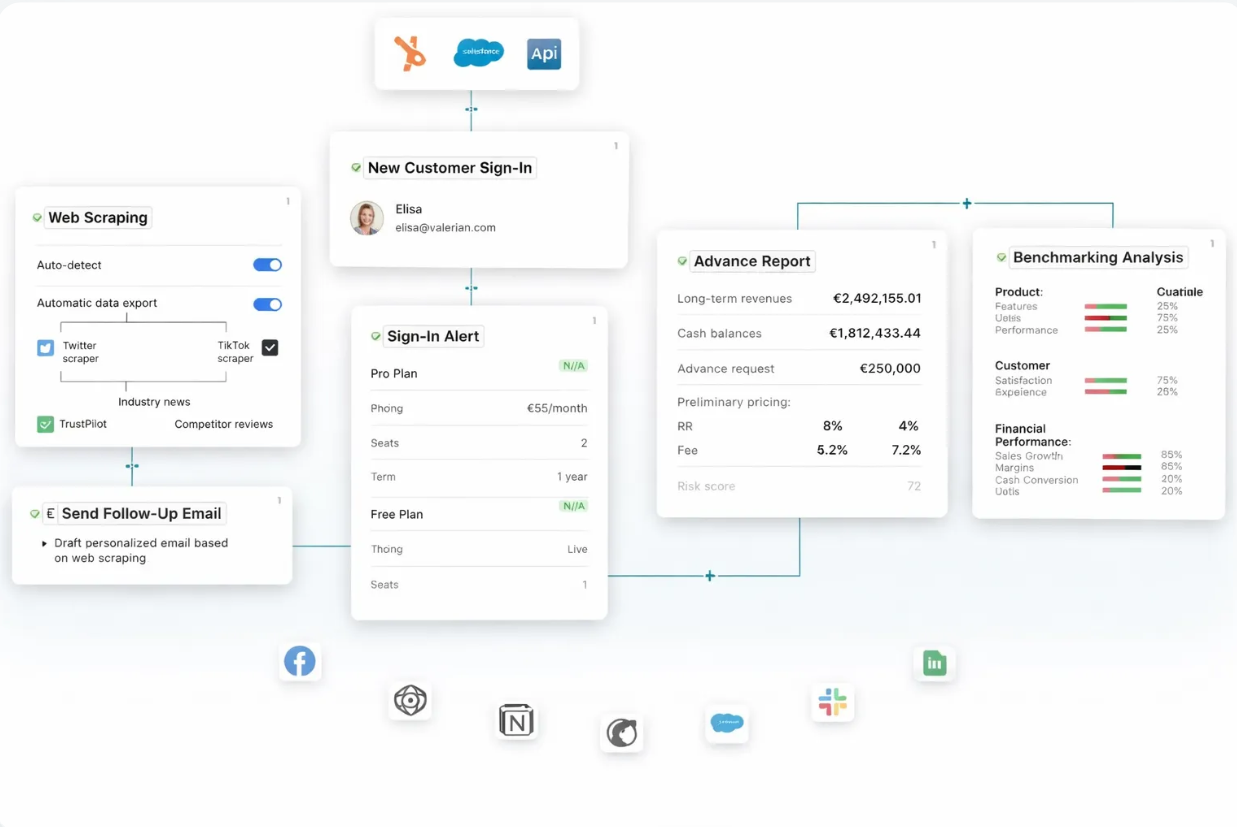
Luca workflow connecting web scraping, customer sign-in alerts, advance reporting and benchmarking analysis, showing how cross-channel analytics tools unify ecommerce data sources into actionable, automated business intelligence.
Luca AI is an AI layer that sits on top of your store's data warehouse. Instead of another dashboard to scroll, you ask a question in plain English and get a reasoned answer. We connect your commerce, marketing, and web sources, normalize the data on ingestion, and let you skip the year most teams lose to data cleanup.
🤔 Why Did We Choose This Tool?
I put Luca first, and yes, I built it, so weigh that. But the honest reason is architectural. Most tools bolted AI onto a dashboard. We built Luca as AI from the ground up: it reasons across your channels, finds the root cause behind an outlier, simulates a scenario, and pushes a recommendation. It is closer to a junior ecommerce data analyst that works 24/7 than to a reporting screen. That is the shift I keep betting on, from descriptive to prescriptive.
📊 Core Capabilities
Plain-English questions: No SQL, no analyst, and no dashboard-building required.
Prediction and simulation: Forecast from historical data, and model "what if" scenarios.
Root-cause analysis: Finds the influencing components behind a ROAS dip or CAC spike.
Proactive alerts: Scans data 24/7 and pings you on outliers via Slack or email.
Scheduled reports: Weekly or monthly reports with graphs, reasoning, and next steps.
✅ Best For
DTC and mid-market operators (roughly $10K MRR and up) with enough clean data to reason against.
Founders and heads of growth who want recommendations, not raw metrics to interpret.
Teams tired of manual Monday exports from Shopify, ad platforms, and returns systems.
📁 Case Study
The problem: A UK-based homewares brand doing mid-seven figures spent three weeks before each buying cycle manually analyzing which vendors performed and which did not, pulling exports from Shopify and a returns system into spreadsheets.
How Luca helped: We connected their commerce, marketing, and returns data into one normalized layer. The founder started asking questions in plain English, like vendor-level margin after returns, and set weekly alerts on category performance.
The outcome: 💰 A buying analysis that used to eat three weeks now takes an afternoon, and the team caught a category that had quietly switched year on year, something they had been fully unaware of before.
💬 Reviews
Luca AI is early, and I would rather show you no review than manufacture one. When verified third-party reviews are live, they will sit right here.
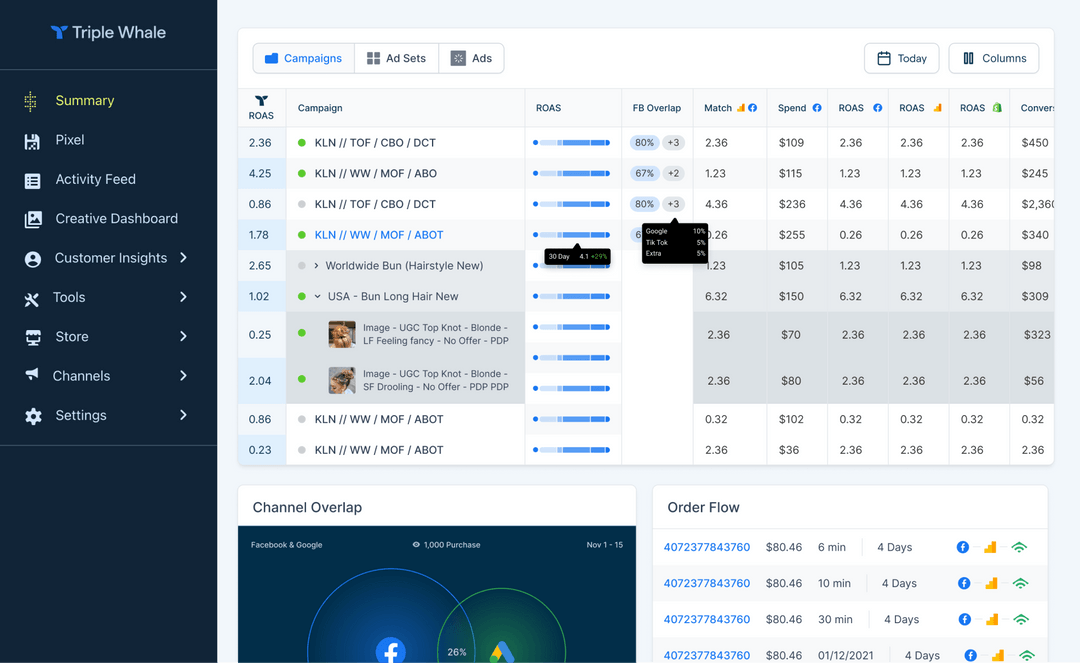
Triple Whale dashboard tracking campaign ROAS, ad spend and Facebook-Google channel overlap alongside order flow, exemplifying a leading cross-channel analytics tool for ecommerce attribution and performance reporting.
Triple Whale is the best-known analytics platform in DTC, and for good reason. Its Triple Pixel collects first-party purchase data, so attribution holds up better than platform-reported numbers. If your main question is "which ads actually drove revenue today," it answers that fast, in one clear dashboard.
🤔 Why Did We Choose This Tool?
Triple Whale nailed the thing most operators need first: a single, readable view of ad spend, revenue, and blended ROAS across channels. The Triple Pixel is genuinely useful for cutting through the gap between what Meta claims and what actually landed in Shopify. For a marketing-led brand, it is often the first paid tool worth buying. Just know it is built to optimize marketing efficiency, not to see your full cash picture.
Blended dashboards: Ad spend, revenue, and ROAS across channels in one view.
Anomaly detection: Lighthouse-style alerts flag sudden metric swings.
AI recommendations: Higher tiers add AI-powered suggestions and RFM audiences.
Shopify integration: Connects in a few clicks.
✅ Best For
DTC brands where paid media is the primary growth lever.
Media buyers and founders who want fast, top-down reporting.
Teams comfortable with GMV-based pricing that scales as revenue grows.
⚠️ Not Recommended For
Operators who need finance and cash-flow visibility, not just marketing.
Brands wanting exact daily metrics exported for custom Excel analysis.
💬 Reviews
"I love how seamlessly it connects our ad platforms and CRM data, showing exactly where our conversions come from and which campaigns drive the most revenue. Its made attribution so much clearer." Verified User Triple Whale G2 Verified Review
"The concept behind the system is quite good. However, despite paying over 600 each month, we still do not receive any customer support. We have been waiting for a resolution to one issue for three months now." Verified User Triple Whale G2 Verified Review
💰 Pricing
$179 / Month to $539+ / Month, with the real cost scaling by GMV and a 12-month commitment on paid plans.
Where Triple Whale stops is where a cross-functional layer starts. It sees your marketing beautifully, but it cannot tell you what scaling that winning campaign does to your cash position in 90 days, because it never sees the finance side. That gap, marketing clarity without the money picture, is exactly the space we built Luca to close by reasoning across sources rather than reporting one slice.
1.3 Polar Analytics [toc=1.3 Polar Analytics]
Polar Analytics is a warehouse-native analytics platform that gives every brand its own dedicated Snowflake database. You connect your sources in a few clicks, and Polar handles the heavy lifting of pulling, storing, and visualizing the data. It holds a 4.7 out of 5 on G2 across 21 reviews.
🤔 Why Did We Choose This Tool?
Polar earns its spot because it treats your data like an asset, not a screen. Every customer gets a dedicated warehouse, unlimited data sources, and a first-party pixel for cleaner attribution (tying sales back to the ads that drove them). For brands tired of exporting CSVs from six backends, Polar becomes a genuine single source of truth. My read is that it is one of the more flexible reporting layers in DTC, if you have the budget for it.
📊 Core Capabilities
Warehouse-native: Dedicated Snowflake database per brand.
Unlimited sources: 10+ connectors including Shopify, Meta, Google, and Klaviyo.
Custom metrics: Spreadsheet-like flexibility to build your own KPIs.
Smart alerts: Slack and email alerts on CAC, conversion rate, and more.
First-party pixel: Polar Pixel for enhanced attribution data.
✅ Best For
DTC and omnichannel brands wanting one true source of data.
Agencies managing many stores under one master account.
Teams comfortable with GMV-based pricing at a premium tier.
💬 Reviews
"Polar Analytics is a tool that centralizes our revenue information with acquisition expenses and email activity. It is very easy to access and does not require delving into the details of the different tools." Juliette P., CEO Polar Analytics G2 Verified Review
"We went from having data in multiple different places... About a month later, she was laid off and we were never assigned a new account manager... it can take up to a week to hear back from the Polar team." Ben S., Director of Commercial Operations Polar Analytics G2 Verified Review
💰 Pricing
$720 / Month to $1,020+ / Month, scaling with annual GMV.
1.4 Northbeam [toc=1.4 Northbeam]
Northbeam is a marketing intelligence platform built for paid-media attribution at scale. It pairs multi-touch attribution (crediting every ad in the buyer's path) with media mix modeling and incrementality testing. It holds a 4.5 out of 5 on G2 across 16 reviews.
🤔 Why Did We Choose This Tool?
Northbeam is the tool serious media buyers reach for once ad spend gets heavy. Its machine-learning attribution cuts through platform bias, so you stop trusting Meta's inflated numbers and start trusting a neutral source of truth. Several reviewers say plainly it is built for brands doing $5 million a year and up. Below that, the price and complexity are hard to justify.
📊 Core Capabilities
Multi-touch attribution: Credits every touchpoint, not just last click.
Media mix modeling: Measures channel contribution holistically.
Incrementality: Tests true lift from spend.
First-party data: Cleaner tracking as cookies fade.
Forecasting: Predicts marketing revenue from historical data.
✅ Best For
Higher-spend brands running seven-figure ad budgets.
Paid-media teams wanting a neutral attribution source.
Enterprises standardizing all-channel reporting.
⚠️ Not Recommended For
Smaller brands, where reviewers flag it as expensive and complex.
💬 Reviews
"Northbeam has helped make it easy for us to determine what is really making money... We'd recommend Northbeam to any business doing over $5 million a year, spending on paid traffic." Austin F., Founder Northbeam G2 Verified Review
"Their onboarding process is very hard. I've been going back and forth for 29 days... We couldn't even finish the setup; it was extremely hard." Harel L., Chief Executive Officer Northbeam G2 Verified Review
💰 Pricing
$1,000 / Month to Custom, scaling with ad spend.
1.5 Google Analytics 4 [toc=1.5 Google Analytics 4]
Google Analytics 4 (GA4) is the free, default web analytics tool for tracking traffic, behavior, and acquisition. It answers where visitors come from and what they do on your site. It solves a different problem with a different architecture, which is why it sits mid-list rather than as a true cross-channel BI tool.
🤔 Why Did We Choose This Tool?
GA4 is on this list because nearly every store already runs it, and it is free. For traffic sources, conversion funnels, and web behavior, it is a reasonable baseline. But operators are honest about the trade-offs: sampling, a steep learning curve, and ecommerce data that often does not match Shopify. It is a traffic tool, not a profit tool.
📊 Core Capabilities
Traffic reporting: Sources, sessions, and acquisition.
Event-based model: GA4's engagement and conversion events.
Funnel analysis: Conversion paths across the site.
Google integrations: Ties into Google Ads and Search Console.
Free tier: No cost for the standard version.
✅ Best For
Any store needing free web and traffic analytics.
Marketers tracking acquisition sources and funnels.
Teams with an analyst to configure custom reports.
⚠️ Not Recommended For
Brands needing accurate ecommerce revenue or profit data.
💬 Reviews
"The real-time reporting, customizable dashboards, and seamless integration with other Google products like Google Ads and Search Console make it especially powerful." Aman S., Performance Marketing Head Google Analytics G2 Verified Review
"It has pretty substantial limitations for ecommerce tracking and often isnt close to accurate for conversion rate, number of orders, or revenue." Verified User in Information Technology and Services Google Analytics G2 Verified Review
💰 Pricing
Free to Custom (Analytics 360 for enterprise).
1.6 Glew [toc=1.6 Glew]
Glew is a business intelligence platform built for multi-store and multi-channel ecommerce reporting. It pulls product, customer, and marketing data into pre-built dashboards. It suits brands and agencies that run several stores and want unified BI without building it from scratch.
🤔 Why Did We Choose This Tool?
Glew earns its place for breadth. It connects a wide range of ecommerce, marketing, and fulfillment sources, then rolls them into product-level, customer-level, and multi-store views. For an agency juggling several brands, that consolidation saves real hours. One common friction point operators raise is annual-contract commitment, so read the terms before you sign.
📊 Core Capabilities
Multi-store BI: Unified reporting across several stores.
Product analytics: Margin and performance by SKU.
Customer segmentation: RFM and cohort views.
Pre-built dashboards: Ready-made reports out of the box.
Many integrations: Ecommerce, marketing, and fulfillment sources.
✅ Best For
Agencies and brands running multiple stores.
Teams wanting pre-built BI without heavy setup.
Operators needing product-level and customer-level detail.
💰 Pricing
$79 / Month to Custom.
1.7 Daasity [toc=1.7 Daasity]
Daasity is a data platform that combines ETL (extract, transform, load) with a customizable data model on your own warehouse. It is built for teams that want their data structured their way, not locked into fixed dashboards. It holds strong ratings on G2 for data integration.
🤔 Why Did We Choose This Tool?
Daasity is the pick for teams that have outgrown rigid dashboards and want control over their data model. It centralizes multi-platform data, then lets you build custom reports and even offers agency support for unique questions. The trade-off reviewers name honestly: a few channels still need manual entry, and some reports refresh overnight rather than in real time.
📊 Core Capabilities
ETL pipeline: Extracts and loads data into your warehouse.
Custom data model: Structure data your way.
Pre-formatted reports: Ready templates plus custom builds.
Agency support: Help with unique business questions.
Multi-platform view: Combines ad spend, customer, and ops data.
✅ Best For
Data-savvy teams wanting a custom warehouse model.
Brands with unique channels and reporting needs.
Operators who value flexibility over plug-and-play.
💬 Reviews
"With daasity, we're able to combine these data points into a comprehensive view of our business... I find the custom report suite creation to be the most valuable asset." Rick S. Daasity G2 Verified Review
"There are a few platforms that are not yet automated... at times there is manual entry... at times I wish a few reports would refresh in real time (they do overnight)." Rick S. Daasity G2 Verified Review
💰 Pricing
$500 / Month to Custom.
1.8 Lifetimely [toc=1.8 Lifetimely]
Lifetimely is a Shopify-focused profit and lifetime value (LTV) tool. It builds an automated profit and loss statement (P&L) with your real costs, then layers on cohort and LTV analysis. It holds a 4.8 out of 5 across 495 Shopify App Store reviews.
🤔 Why Did We Choose This Tool?
Lifetimely nails the one number founders actually care about: profit after costs. It pulls COGS, shipping, and ad spend into a clean daily P&L, then shows how much a customer is worth over time. For a Shopify brand under $10 million, it is often more useful than a fancy attribution suite. Recent reviews note minor glitches in daily reports, but sentiment is overwhelmingly positive.
📊 Core Capabilities
Automated P&L: Real-time profit with COGS and shipping.
LTV tracking: Customer lifetime value over time.
Cohort analysis: Retention and repeat-purchase views.
Ad platform sync: Connects Meta and Google spend.
Shopify-native: Cleaner than native Shopify reporting.
✅ Best For
Shopify brands focused on true profitability.
Founders tracking LTV and payback period.
Sub-$10M stores wanting simple, clean P&L views.
💬 Reviews
"This is the best way to track sales and profits using a single or multiple sales channels through Shopify. Love the clean reports and ease of use, way better than Shopify native reporting." CAMP Collection Lifetimely Shopify App Store Verified Review
"the additional add on casue the product to be a but limiting. and the daily reports have time to time minor glitches, but overall a useful tool for high level view of the business." Sur Nutrition Lifetimely Shopify App Store Verified Review
💰 Pricing
Free to $299+ / Month.
1.9 Peel [toc=1.9 Peel]
Peel is an automated analytics tool built for retention and cohort analysis. It focuses on the questions that keep repeat-purchase brands up at night: who comes back, how often, and how much they spend over time. It suits subscription and consumables brands where retention drives the model.
🤔 Why Did We Choose This Tool?
Peel earns its spot for depth on retention, the metric most tools treat as an afterthought. It automatically surfaces cohort behavior, repeat-purchase rates, and product-level retention without you building a single dashboard. For a consumables or subscription brand, that vigilance is the whole game. If your model is one-and-done purchases, though, Peel is likely overkill.
📊 Core Capabilities
Cohort analysis: Automated retention cohorts.
Repeat-purchase metrics: Reorder rates and timing.
LTV tracking: Value by customer segment.
Product retention: Which SKUs drive repeat orders.
Automated insights: Surfaces trends without manual setup.
✅ Best For
Subscription and consumables brands.
Retention-focused DTC operators.
Teams wanting cohort depth without dashboard-building.
⚠️ Not Recommended For
One-time-purchase brands where retention matters less.
💰 Pricing
Free to Custom.
Here is where the whole list circles back to the shift I keep betting on, from monitoring to recommending. Nearly all nine tools above are excellent at showing you data. ✅ They report marketing, or profit, or retention, cleanly and in one place. ❌ But each sees one slice, so the founder still does the manual triangulation, stitching Polar's revenue view to Lifetimely's P&L to Northbeam's attribution at 11pm. ✅ Luca was built to reason across those slices and hand you the recommendation instead. ❌ A stack of siloed dashboards, however good each one is, cannot tell you the single next move, and that gap is exactly the job we set out to own.
Q2: Why Do Single-Channel ROAS, Gross Margin, and Native Reporting Mislead Ecommerce Founders? [toc=2. Why Single-Channel Data Lies]
Gross margin is a lie. It tells you what it costs to make the thing, and nothing about the eight costs between the supplier invoice and your actual profit. Shipping, returns, payment fees, discounts, and pick-and-pack are where brands quietly bleed. Single-channel ROAS (return on ad spend) and native reporting hide all of it, which is exactly why founders scale straight into a wall.
The Number That Fools Founders
Here is the trap I see most. A founder reads a healthy gross margin, say 70%, and green-lights spend. But gross margin only counts the cost of the product itself. It ignores the stack of costs that sit between that supplier invoice and the cash that actually lands in the bank.
I watched one brand scale for two years believing it ran a 72% margin. The real contribution margin, after every cost, was closer to 8%. They could not make product fast enough, so they poured cash into a money pit and called it growth.
ROAS Doesn't Exist In A Vacuum
ROAS is the other comfortable lie. Platform-reported ROAS from Meta or TikTok double-counts, ignores returns, and never sees your true cost to serve. Blended ROAS is better, but it still tells you nothing about which product is profitable after shipping.
One operator I worked with had no idea her blended shipping cost was eating the category alive. She was reading shipping as an average across all products, so the heavy, bulky SKU looked fine on paper. It was not.
Why Native Reporting Won't Save You
The frustrating part is that your default tools cannot fix this, by design. Google Analytics 4 (GA4) tracks gross revenue per product but cannot access COGS (cost of goods sold), shipping, returns, or payment fees. Google's own documentation confirms you must feed COGS in manually just to unlock basic profit reporting.
Shopify is not much better out of the box. Profit-with-COGS reporting and the custom report builder sit behind higher plan tiers. So the founder on a starter plan is flying blind on the one number that matters.
The Fix Is Cost-Aware, Cross-Channel Data
This is the whole reason cross-channel, cost-aware tooling exists. You need one layer that pulls revenue, ad spend, COGS, shipping, and returns together, then computes true net profit per product and per channel.
At Luca, this is the problem we obsess over. In one case, a founder used to wait two days for an expert to email back a market's net profit. We calculated that same net profit in about five minutes, tracing every hidden cost automatically. That is the difference between rear-view reporting and answering the only question that pays your rent: what is actually making money?
Q3: What Exactly Is a Cross-Channel Analytics Tool, and Why Does It Matter More in 2026? [toc=3. Definition and 2026 Shift]
A cross-channel analytics tool pulls data from every source your store touches, ads, email, your store platform, and returns, into one unified view. It is not an attribution pixel. A pixel tracks which ad gets credit for a sale. A cross-channel tool answers the bigger question: is the whole business actually healthy?
The Simplest Way To Picture It
Imagine a Shopify store selling woolen sweaters. It runs Meta ads, sends Klaviyo emails, and processes returns through a separate app. Each tool has its own dashboard, and none of them talk to each other.
A cross-channel analytics tool sits on top of all three. It shows how a Meta campaign drove email signups, which then drove repeat purchases, minus the returns that ate the margin. That is what "unified" actually means.
Why 2026 Makes This Non-Negotiable
The timing matters more now than it did three years ago. Since Apple's iOS privacy changes, platform tracking has degraded badly, so the numbers Meta reports no longer match reality. Brands are being pushed hard toward blended and first-party measurement (data you collect directly from your own customers).
When each platform overstates its own contribution, the only sane response is to measure everything in one place. A single channel bragging about its ROAS is not evidence. The blended, cost-aware picture is.
From Dashboards To Recommendations
Here is the shift I care about most. Dashboards were never meant to show off technical capability. They were meant to strip out the decisions normal people cannot make from raw data. My blunt frame for the team: watch Netflix, don't watch dashboards.
The category is moving from descriptive (here is what happened) to prescriptive (here is what to do). That line is how I judge every tool. Luca sits firmly on the prescriptive side. It is an AI layer over your data warehouse that digests the raw data and returns a reasoned recommendation, not another chart. To be clear, it is not an attribution pixel and does not replace one.
Q4: What Does GMV-Based Pricing Really Cost as Your Store Scales? [toc=4. The True Cost of Pricing]
GMV-based pricing means you pay a percentage tied to your gross merchandise value (total sales volume), so the bill climbs automatically as you grow. It looks cheap at $1M in revenue and painful at $10M. Before you sign, model the three-year curve, and read the annual-contract lock-in clause. I have limited hard data on exact tier breaks, so treat the numbers below as directional.
How The Cost Curve Actually Bends
Most cross-channel tools, including Triple Whale and Polar Analytics, price against your revenue band. The problem is the curve is not linear in your favor. You are being charged more precisely when margins are tightest, during a scaling push.
A rough illustration of how the same tool can scale:
Illustrative GMV-Based Pricing at Scale
Annual Revenue
Typical Monthly Cost (illustrative)
$1M
~$179 to $300
$5M
~$539+
$10M
Custom, often four figures
The Lock-In Nobody Reads
The bigger trap is the annual commitment. Several tools require a 12-month contract on paid plans, so you are locked in even if the fit is wrong. Operators feel it once they have sunk historical data into the platform.
"The app is okay, but it's full of bugs and the UI is terrible... They're clearly gearing it toward larger enterprises with a bunch of users, but for a small operation it's just way overload. If we didn't have so much invested in historical data I would change." BioPower Pet Triple Whale Shopify App Store Verified Review
My advice is simple: build the cost curve at your projected 3-year revenue, then compare it against flat-fee or seat-based options. Ask what the bill looks like at 3x your current sales, not today's.
Q5: When Should You NOT Buy a Cross-Channel Analytics Tool? [toc=5. When Not to Buy]
Do not buy a cross-channel analytics tool if you run one paid channel, have under a few months of clean order history, or aren't losing real hours to manual reporting yet. These tools synthesize data. Feed them thin or messy data, and you get confident-looking noise. Wait until the tool has something real to reason against.
The Advice Everyone Gives You
Walk into any DTC forum and the answer is the same: buy attribution now. Every founder feels behind, so they rush to plug in a tool before they have the data to justify it. I understand the panic, but the standard read gets this backwards.
One operator with a marketing data-science background put the counter-case bluntly, and I agree with him.
"Attribution tools are overkill for 90% of DTC brands... To this day, attribution is still unsolved." Sam Ross LinkedIn Post
Why Thin Data Breaks These Tools
Here is the mechanism nobody explains. These platforms find patterns across sources. With one channel and six weeks of orders, there is no pattern to find, only random swings dressed up as insight.
Feeding AI poor or uncleaned data is a special kind of self-harm. It comes out with stuff that isn't quite right, and you make real spending decisions on it. That is not the tool failing. That is pure laziness upstream, and it costs money you do not have. Clean data management comes first.
The Three Signals You're Actually Ready
I use a simple readiness check with founders. You are ready when all three are true, not before.
✅ You run two or more paid channels, so blended measurement actually adds signal.
✅ You have several months of clean, consistent order history to reason against.
✅ You are losing real hours each week to manual CSV exports and spreadsheet stitching.
Miss those, and even the best tool underperforms. Northbeam, for instance, starts around $1,000 a month and is built for brands past $5M. Buying it at $30K a month in revenue is lighting cash on fire.
This is also where I am honest about Luca. It is built for SMB and mid-market operators with enough clean data to reason against. If you are pre-data-volume, or you already run a full data team, we are probably not your first move. Wait until the signal is real, then explore what an analytics platform can actually do.
Q6: How Do You Choose the Right Cross-Channel Analytics Tool for Your Store? [toc=6. How to Choose]
Choose the tool by the job you need done, not the feature list. Start with your single most painful question, then let that route you. A brand obsessed with ad attribution needs a different tool than one bleeding on profit. Match the tool to your dominant question first, then filter on price, data readiness, and team size.
Buy The Job, Not The Tool
The mistake I see most is buying the tool with the longest feature list. That is backwards. The right pick is the one that removes 80 to 90% of the manual work behind your biggest recurring headache.
My expectation for any tool is simple: it should not replace your team, but it should do 80 to 90% of their grunt work. Pick the tool that kills the manual 90%, whatever your version of the Monday export ritual looks like.
Route Yourself By Dominant Question
Here is the decision list I actually use with operators. Find your number-one question, then start there.
"Which ads truly drove revenue?" Start with Northbeam or Triple Whale for attribution.
"What is my true profit and LTV?" Start with Lifetimely on Shopify.
"Who reorders, and when?" Start with Peel for cohort and retention depth.
"I need a free traffic baseline." Start with Google Analytics 4.
"What should I do next across all my data?" Start with Luca AI.
Then apply the secondary filters: does the pricing model fit your revenue curve, is your data clean enough, and can a non-analyst actually run it? For the operator whose real question is that last one, deciding the next move across marketing, commerce, and finance, Luca fits as the AI layer. It handles prediction, root-cause analysis, and scheduled reporting so the answer arrives without a dashboard build. The point holds either way: every choice should ladder back to a money outcome, not a feature you will never open.
Q7: Cross-Channel or Cross-Functional? Why Connecting Finance and Cash Changes the Picture [toc=7. Cross-Channel vs Cross-Functional]
Cross-channel analytics is table stakes now. The real frontier is cross-functional: connecting marketing and commerce to finance and cash. Most tools stop at the marketing channels and go silent on the money. That gap is why founders with great dashboards still get blindsided by a cash crunch. The picture changes completely once cash enters the frame.
The Two Train Tracks
Think of an ecommerce business as two train tracks running in parallel. One track is your inventory. The other is your cash.
Those two must move together, in sync. When they drift apart, when you scale spend without seeing the cash impact, you go off the tracks. A marketing-only tool watches one rail and ignores the other.
The Forest You're Missing
I lived this myself. When you are zoomed into one niche, say traffic or ROAS, you miss the forest for the trees. It is like studying a Van Gogh through a magnifying glass, admiring one brushstroke while missing the whole painting.
Cross-channel tools are that magnifying glass on the marketing corner of the canvas. Useful, but partial. The questions that actually decide survival live across functions, and siloed systems simply do not talk to each other, which is why unified business intelligence matters.
The Questions Only Cross-Functional Answers
Here is the class of question a marketing dashboard cannot touch. "If I scale this winning campaign 3x, what happens to my cash position in 90 days, after inventory reorders and payment-processor holds?"
That answer needs marketing, commerce, and finance data reasoned together. Luca is the AI layer built for exactly that, digesting all three and returning a reasoned recommendation instead of another chart. It is the destination this whole comparison has been pointing toward.
A Separate Note On Capital
One clean separation, because it matters. If you are evaluating capital, judge Luca's capital offering on its own terms, speed of disbursal and cost of capital, against other providers. The analytics strength is not the pitch for the funding, and the funding is not the pitch for the analytics. Each stands on its own merits, much like weighing any revenue-based financing option.
The open question I am sitting with heading into 2027 is this: once an AI layer can see cash, inventory, and marketing in one reasoning loop, does "analytics tool" even remain the right category name? My honest read is that it does not, and the tools still calling themselves dashboards may be describing a job that is quietly disappearing. I could be early on this. I do not think I am wrong.
FAQ's
What are the best cross-channel analytics tools for ecommerce in 2026?
We ranked the nine tools worth your time in 2026 by how close each gets to the shift from monitoring to recommending, not by brand size.
Luca AI: AI-native cross-channel analysis with prescriptive recommendations.
Triple Whale: DTC marketing attribution and daily profit tracking.
Northbeam: Paid-media attribution at higher ad spend.
Google Analytics 4: Free traffic and web behavior.
Glew: Multi-store and multi-channel BI reporting.
Daasity: Custom data modeling on a warehouse.
Lifetimely: Profit and LTV on Shopify.
Peel: Retention and cohort analysis.
Each solves a different job, so match the tool to the question you actually lose sleep over. If your dominant question is what to do next across all your data, we built our analytics platform to reason across sources and hand you the recommendation. The rest are excellent at showing one clean slice.
What is a cross-channel analytics tool, and how is it different from an attribution pixel?
A cross-channel analytics tool pulls data from every source your store touches, ads, email, your store platform, and returns, into one unified view.
It is not an attribution pixel. A pixel tracks which ad gets credit for a sale. A cross-channel tool answers the bigger question: is the whole business actually healthy?
Pixel: Credits a single touchpoint or channel.
Cross-channel: Connects marketing, commerce, and returns so you see how one drives another.
Picture a Shopify store selling woolen sweaters running Meta ads, Klaviyo email, and a separate returns app. A cross-channel tool sits on top of all three and shows how a campaign drove signups, then repeat purchases, minus the returns that ate the margin.
The category is moving from descriptive dashboards to prescriptive recommendations. We built our AI layer for the prescriptive side, digesting raw data and returning a reasoned recommendation rather than another chart. To be clear, it is not an attribution pixel and does not replace one.
Why do single-channel ROAS and gross margin mislead ecommerce founders?
Gross margin only tells you what it costs to make the thing. It ignores the stack of costs between the supplier invoice and the cash that lands in your bank.
Shipping
Returns
Payment fees
Discounts
Pick-and-pack
We watched one brand scale for two years believing it ran a 72% margin. The real contribution margin, after every cost, was closer to 8%. They poured cash into a money pit and called it growth.
ROAS is the other comfortable lie. Platform-reported ROAS double-counts, ignores returns, and never sees your true cost to serve. Even blended ROAS tells you nothing about which product is profitable after shipping.
Native tools cannot fix this by design. Google Analytics 4 cannot access COGS, shipping, or fees without manual input. This is why cost-aware tooling exists. We obsess over true net profit per product, tracing every hidden cost automatically instead of showing rear-view numbers.
How much do cross-channel analytics tools cost, and how does GMV pricing scale?
GMV-based pricing means you pay a percentage tied to your gross merchandise value, so the bill climbs automatically as you grow. It looks cheap at $1M and painful at $10M.
Here is a rough, directional illustration of how the same tool can scale:
$1M revenue: around $179 to $300 per month.
$5M revenue: around $539+ per month.
$10M revenue: custom, often four figures.
The bigger trap is the annual commitment. Several tools require a 12-month contract on paid plans, so you are locked in even if the fit is wrong. Model the cost curve at your projected three-year revenue, then compare it against flat-fee or seat-based options.
This is one reason we priced our subscription predictably, not tied to GMV. Your bill does not jump just because you had a good quarter. When you are scaling, the last thing you need is your analytics cost punishing the growth it is supposed to support.
When should you NOT buy a cross-channel analytics tool?
Do not buy one if you run a single paid channel, have under a few months of clean order history, or aren't losing real hours to manual reporting yet.
These tools synthesize data. Feed them thin or messy data, and you get confident-looking noise, not insight. You are ready only when all three signals are true:
You run two or more paid channels, so blended measurement adds real signal.
You have several months of clean, consistent order history to reason against.
You are losing real hours each week to manual CSV exports and spreadsheet stitching.
Miss those, and even the best tool underperforms. Northbeam, for instance, starts around $1,000 a month and is built for brands past $5M. Buying it at $30K a month in revenue is lighting cash on fire.
We are honest about this too. We built our tooling for SMB and mid-market operators with enough clean data to reason against. If you are pre-data-volume, or already run a full data team, we are probably not your first move.
Enjoyed the read? Join our team for a quick 15-minute chat — no pitch, just a real conversation on how we’re rethinking Ecommerce with AI - Luca
Loading Schedule...
Your AI Co-Founder is here.
Here’s why:
Shopify, Meta, Xero - one brain.
"Should I scale?" Answered with real data.
Growth capital. No applications. One click.
Thank you! Your submission has been received! Please book a time slot for the Meeting
Oops! Something went wrong while submitting the form.