.svg)
.svg)

Why does retention beat acquisition for a cash-strapped DTC store in 2026? [toc=1. Retention vs Acquisition Math]
Acquisition is hunting: nomadic, expensive, exhausting. Retention is agriculture: you farm a base you already paid for. With ecommerce CAC up roughly 40% since 2023, and the average store taking about 12 months to break even on a new customer, every repeat order is near-pure margin. A 5% retention lift can raise profit 25 to 95%. Fix the leaky bucket before pouring in more ad spend.
💸 The leaky bucket nobody puts on the dashboard
Picture a founder doing $200K a month, watching topline climb, feeling good. Then the bank balance does not move. That gap is the leaky bucket. You pour paid traffic in the top, and customers drain out the bottom after one discounted order.
Topline growth masks this. I have looked at enough Shopify P&Ls to say it plainly: revenue going up while cash stays flat is not a growth story, it is a churn story wearing a costume. This is exactly the trap we unpack in why e-commerce founders are drowning in data.
⏰ The 12-month break-even nobody warns you about
Here is the math that should change your Monday. Customer acquisition cost (CAC) is what you pay to win one buyer. Across ecommerce, that number climbed about 40% from 2023, with blended CAC landing near $68 to $84 on Shopify.

The average store needs roughly 12 months of a customer's orders to earn that cost back. So a one-and-done buyer is not break-even. They are a loss. About 90% of Shopify stores lose profit when they push harder on Facebook ads, because they are buying more first-and-last orders, a pattern we break down in declining platform ROAS versus true profitability.
✅ Stop hunting, start farming
A 5% lift in retention can raise profit between 25 and 95%, because repeat orders carry almost no acquisition cost. That is the whole case. The second order is where margin lives.
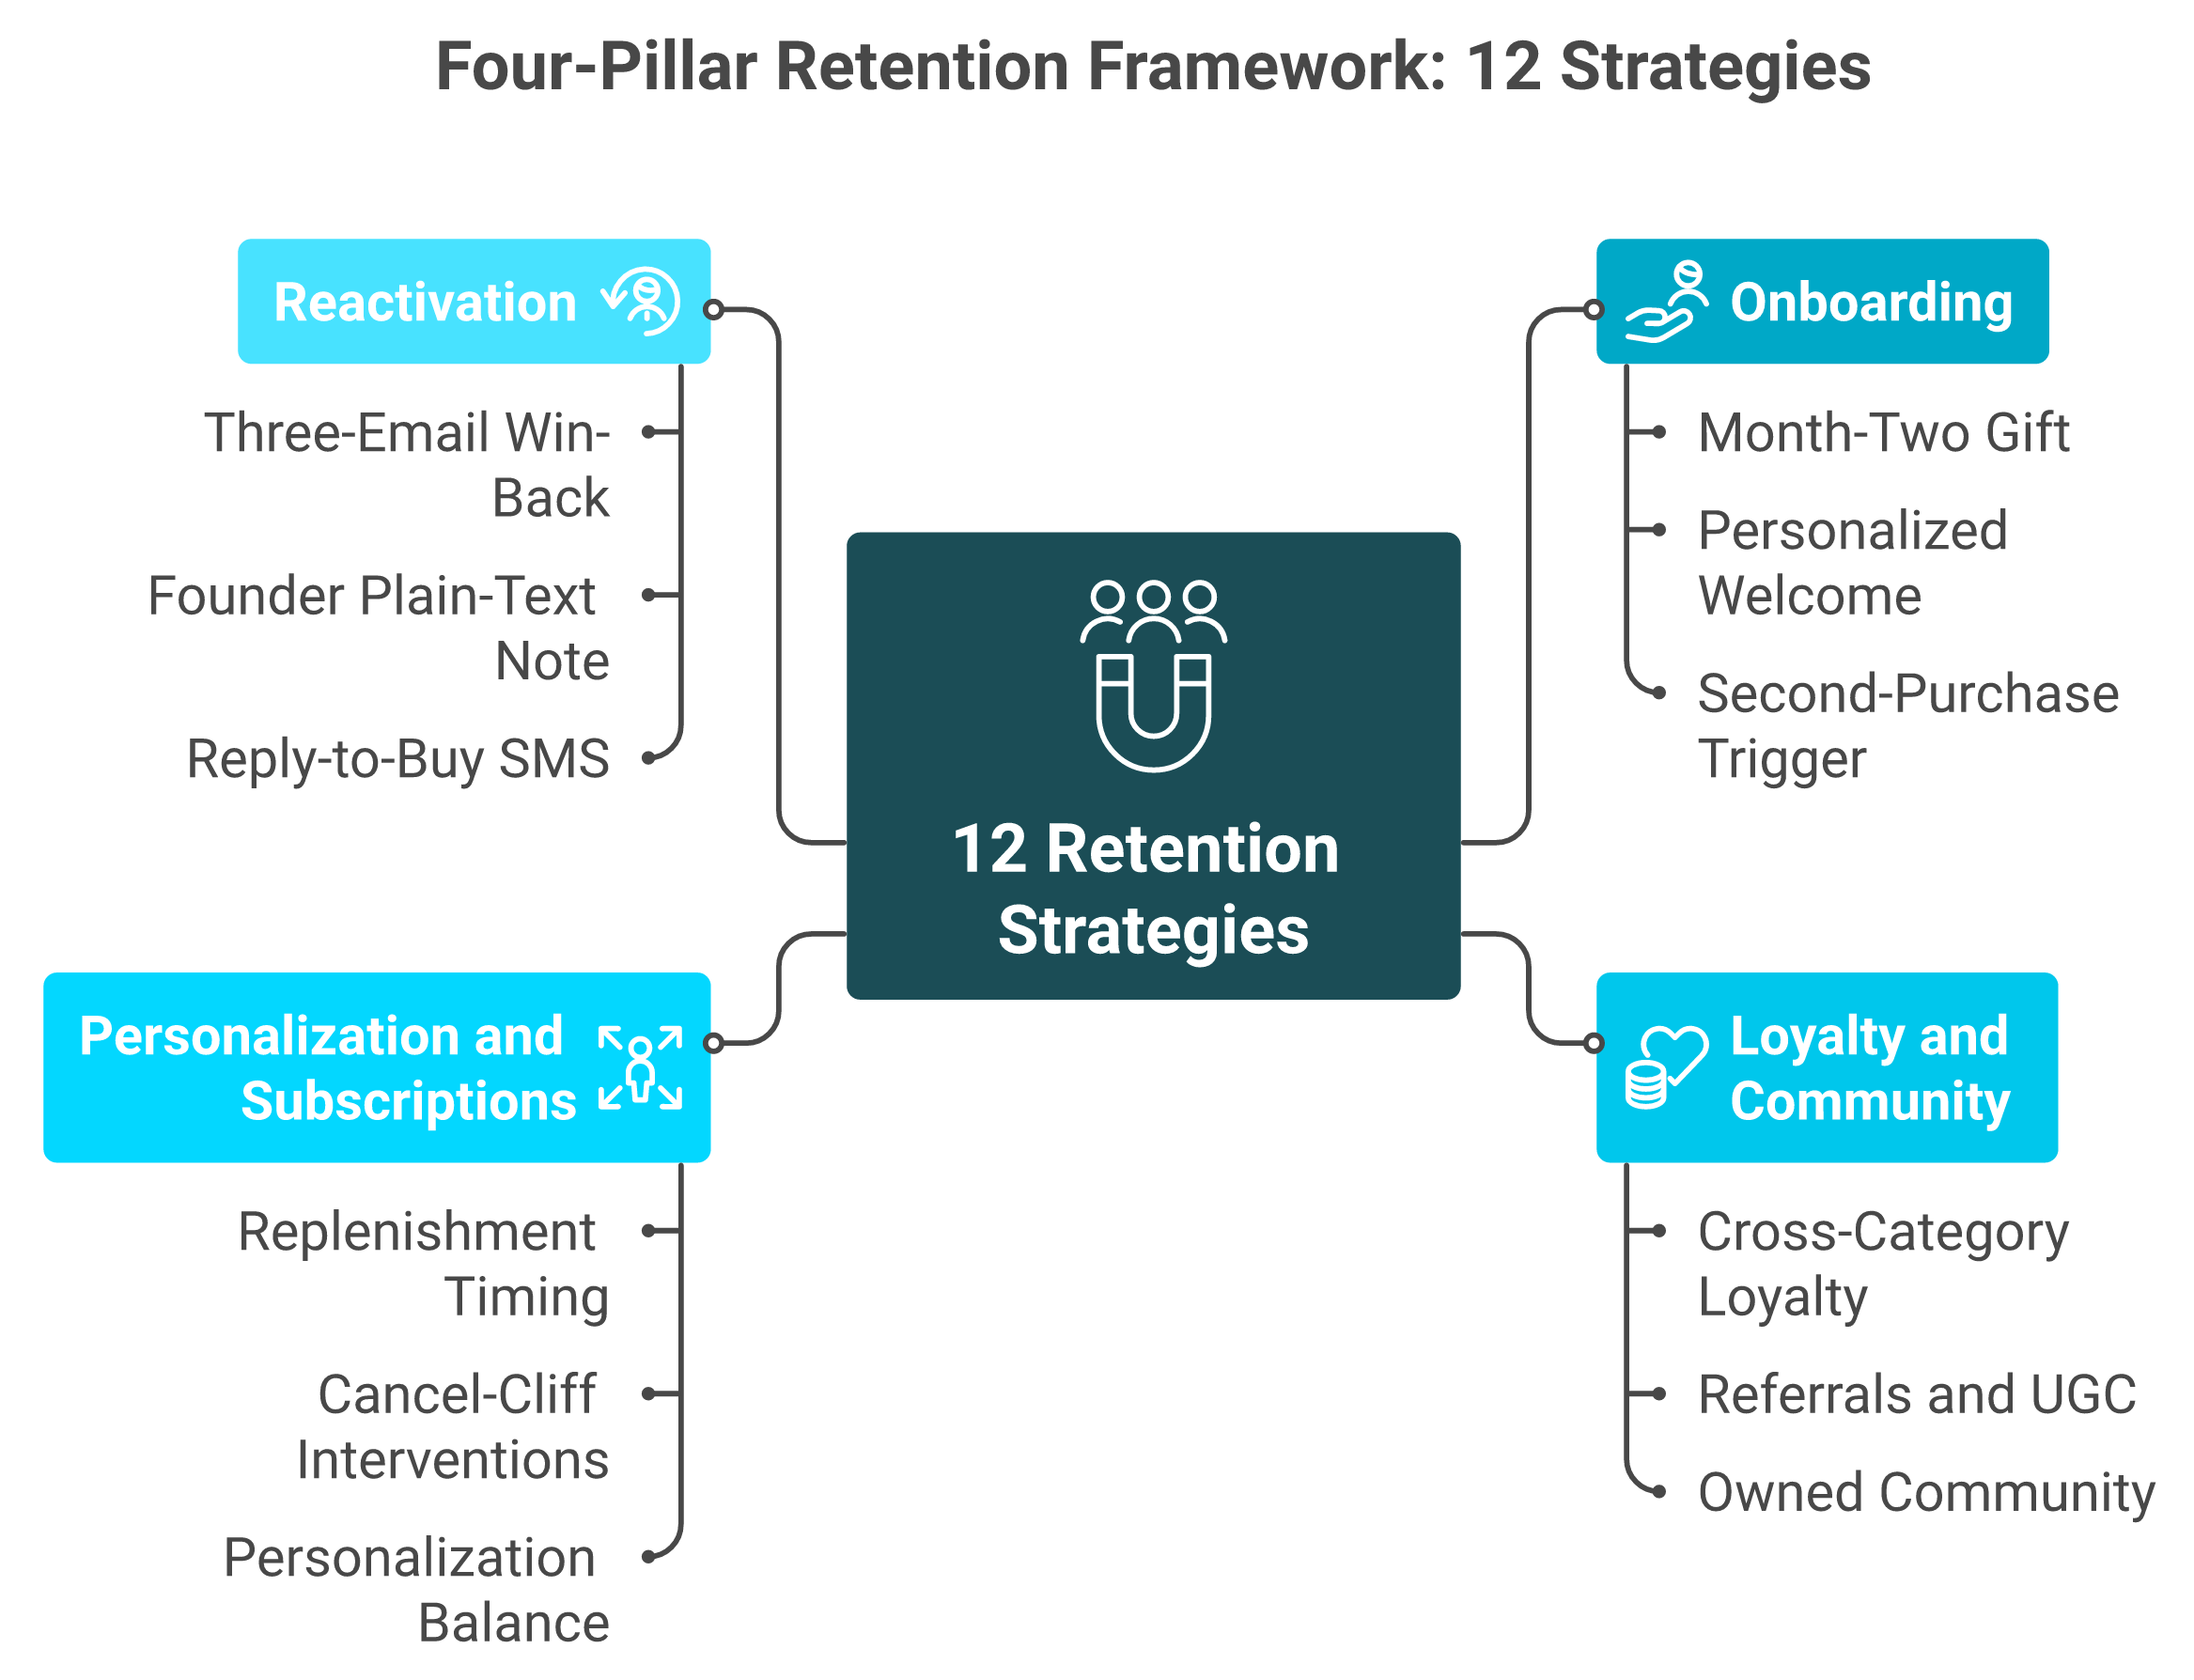
So the job changes. You are not hunting new customers across volatile ad auctions. You are farming the base you already bought. This article maps 12 strategies across four pillars: onboarding, loyalty, personalization and subscriptions, and reactivation.
Before you add a single tactic, you need to see where the bucket leaks. This is the quiet part most tools skip. At Luca, we read Shopify, Meta, and Klaviyo together in one place, so the unprofitable cohort surfaces on its own instead of hiding inside a healthy-looking topline. You can see how that works across our financial management use cases.
What counts as a good ecommerce retention rate, and how do you measure the right metric? [toc=2. Benchmarks & Metrics]
Retention rate equals customers at the end of a period, minus new customers won, divided by customers at the start, times 100. The average sits near 30%, meaning about 70% never return. But that flat number lies. Median DTC repeat purchase rate is roughly 27%, while consumables hit 38 to 52% and apparel 16 to 24%. Stop steering by retention rate alone; steer by 60-day and 1-year LTV.
📐 The formula, then the trap
Let me give you the plain-English formula first, so you can run it today.
- Retention rate = ((customers at end minus new customers) divided by customers at start) times 100.
- Repeat purchase rate (RPR) = share of customers who bought more than once.
- Customer lifetime value (CLV or LTV) = total margin one customer brings over their life with you.
The trap is the famous "30% is average" line. A flat benchmark tells a supplements brand and a mattress brand the same thing, which is useless. The average ecommerce retention rate is around 30%, and top performers reach 62%.
📊 Real benchmarks by vertical
Your target depends on what you sell, and how often it runs out. Here is the read I trust right now.
⭐ Steer by LTV velocity, not a vanity rate
Retention rate is a rear-view number. LTV velocity is the operator number: how fast a customer's value climbs. Common Thread Collective frames a clean target, raise LTV 30% in 60 days and 100% in a year, tracked through cohorts.
There is a deeper signal hiding here. From what surfaces when you actually run cohort analysis, lifetime value is often driven by product-category diversity, not raw frequency. One operator found buyers who added body care jumped 50 to 100% in LTV. I might be slightly off on the exact lift per brand, but the direction holds.
At Luca, we compute 60-day versus 1-year LTV by cohort automatically, and root-cause which segment is dragging the average down. That replaces the Sunday-night spreadsheet where you triangulate the same number by hand. It is the kind of work we cover in our guide to tracking e-commerce unit economics.
Where exactly are your customers leaking, and which churn zone do you fix first? [toc=3. Diagnose the Leak]
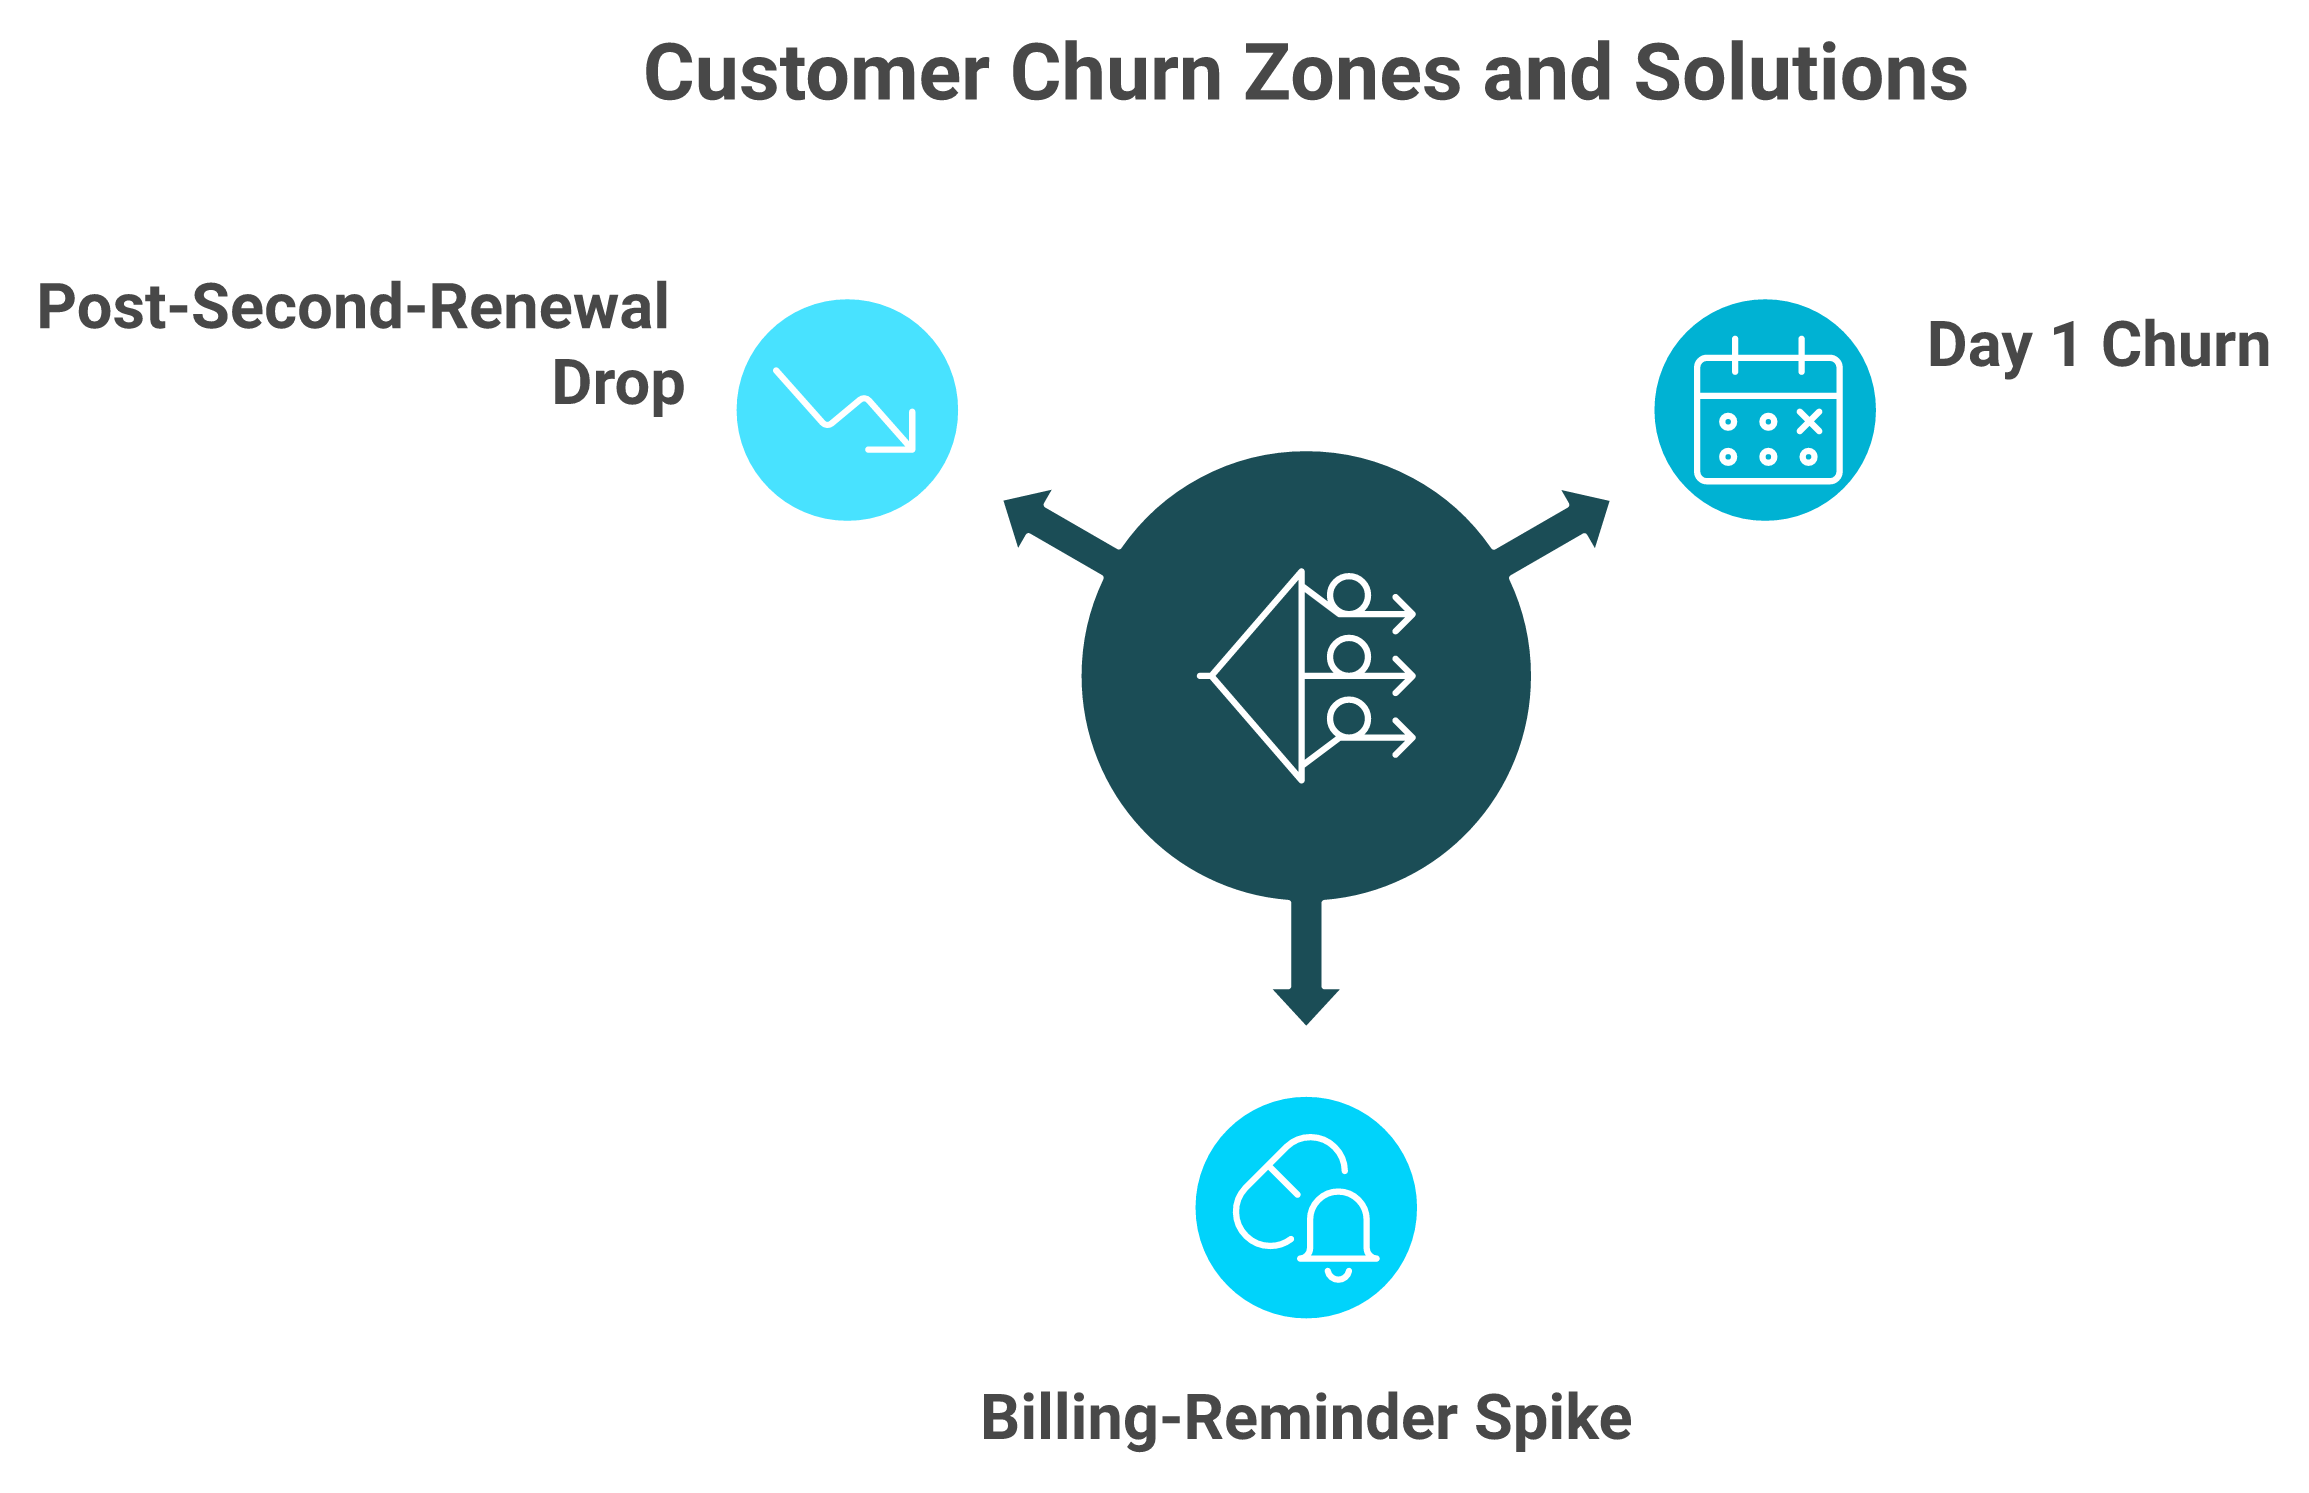
Churn clusters in three zones: Day 1 (discount shoppers who marry you for the honeymoon suite and file for divorce the next morning), the billing-reminder spike (second-guessers), and the post-second-renewal drop-off. Do not spread fixes evenly. Size each leak in dollars, find the one bleeding most, and attack it first. You cannot fix a leak you have not located.
⚠️ The three danger zones
Most founders treat churn as one blurry problem. It is not. It clusters in three predictable places.
- Day 1 churn. These bought only for the discount. They would marry you for the honeymoon suite and divorce the next morning.
- The billing-reminder spike. Subscribers see the "your card will be charged" email and second-guess.
- The post-second-renewal drop. The novelty fades right after the second charge.
Knowing the zone tells you the fix. A Day 1 churner needs a reason to stay. A billing-spike churner needs reassurance before the charge hits.
💰 Size each leak in dollars before you act
Here is the move most operators skip. Do not ask "what is my churn rate." Ask "which zone is costing me the most cash this quarter."
Pull the count of customers lost in each zone. Multiply by their average contribution margin. Now you have three dollar figures, not three percentages. The biggest figure is your first project. Everything else waits.
This is where targeted beats scattershot. One operator cut subscription churn from 24% to 17% by fixing a single zone, not by running ten tactics at once. Our data analysis and deep research capabilities are built for exactly this sizing exercise.
✅ Prioritize by revenue-at-risk
"Honestly stunned at how badly this was handled. Days of silence. Confusing, copy-and-paste answers. No one capable of actually interpreting multi-store data."
— Gemma Wayflyer Trustpilot Verified Review
That complaint is about a financing provider, but the lesson is the same: nobody could read the data and act. Diagnosis fails when no human (or tool) can interpret the numbers fast enough.
This is exactly the gap Luca closes on the analytics side. We scan your data 24/7, find the root cause and the influencing components of a cohort dip, and ping you on Slack or email before the quarter closes. Think of it as a junior data analyst who never sleeps and never sits on a finding, which is the heart of our agentic AI for e-commerce founders approach.
Pillar 1: Onboarding: how do you stop Day 1 churn and earn the second purchase? [toc=4. Pillar 1: Onboarding]
Day 1 churners bought only for the discount and cancel once the honeymoon ends. Beat it with three moves: pre-empt regret by promising a "real gift" in month two, personalize the welcome (a "newbie or not?" quiz or an AI welcome video that says their name), and trigger the second-purchase nudge inside the 21 to 35 day window while intent is warm.
🎁 Strategy 1.1: Bribe the Day 1 churner upfront
The discount buyer is already halfway out the door. So get ahead of the regret. Tell them, at checkout or in the first email, that a real gift is coming in month two if they stay.
This works because it reframes the relationship. They are no longer renting a one-time deal. They are waiting on something. I could be wrong on the exact gift, but the principle (give them a reason to still be here in 30 days) holds across every consumables brand I have seen.
🙋 Strategy 1.2: Personalize the welcome so it does not feel like a blast
A generic "thanks for your order" earns nothing. A personalized welcome earns a second look.
- The newbie quiz. Doe Lashes asks a simple "are you a newbie or not?" question, then tailors recommendations. Post-purchase satisfaction climbs because the first product actually fits.
- The AI welcome video. One operator sends a short video that says the customer's name. "They think I sent a personal email to them," he told me. Small lift, real lift.
Define the term once: a welcome flow is the automated email or SMS series that fires right after someone's first order. Pairing that flow with the right data is where our marketing analysis and automation use case earns its keep.
⏰ Strategy 1.3: Trigger the second purchase in the 21 to 35 day window
The second order is the whole game. Time it wrong, and you miss the warm window.
For a fast-replenish product (a 30-serving tub, a daily supplement), the right second-purchase nudge fires 21 to 35 days after delivery, while the product is running low and the brand is still top of mind. A healthy target: 20% of new customers make a second purchase within 30 days.
"You're talking to a computer that doesn't understand what it is saying. It's designed to agree with you."
— u/nur12fn, r/shopify Reddit Thread
That is the warning on generic AI helpers running your onboarding. Agreeable is not the same as accurate. Your second-purchase timing has to come from real cohort behavior, not a chatbot guessing, which is why we built Luca as a true AI co-founder for e-commerce rather than a yes-man bot.
On the analytics side, Luca flags when your Day 1 cancel rate climbs above your own cohort baseline, which usually means the welcome flow quietly broke. We do not run your email tool. We tell you when it stopped working, so you fix it before a month of new buyers leaks out. See how that fits a modern e-commerce tech stack.
Pillar 2: Loyalty & Community: which retention programs build margin instead of discounting it away? [toc=5. Pillar 2: Loyalty & Community]
Loyalty works only when it deepens the relationship, not when it bribes repeat discounts. The data point most operators miss: lifetime value is driven by product-category diversity, not raw frequency. Design loyalty and referrals to push customers into a second category rather than to reorder one SKU at a discount. That single shift can lift LTV 50 to 100%, and owned communities beat fragile acquisition channels like SEO.
⚠️ The standard loyalty playbook gets this backwards
Most points programs just train customers to wait for a discount. You are not building loyalty. You are renting a price cut and calling it a relationship.
The standard read says "buy more often." From what surfaces when you actually run cohort analysis, that is not the real lever. One operator ran four or five cohort analyses and found product-category diversity, not frequency, drove lifetime value the most. This is the kind of pattern our data analysis and deep research surfaces automatically.
🛍️ Strategy 1.4: Design loyalty around the second category
Here is the move. Stop rewarding the same reorder. Reward the jump into a new category.
One operator put it plainly to me: anybody who bought body care jumped 50 to 100% in LTV. So a candle buyer should earn points toward a diffuser, not a fifth candle. I might be off on the exact percentage per brand, but the direction is consistent.
🤝 Strategy 1.5: Make referrals and UGC do the acquisition
A loyal customer is your cheapest sales channel. A referral program turns them into one.
- Referrals. Reward the existing customer for the introduction, not just the new buyer.
- UGC (user-generated content). Real customer photos and reviews lower the trust barrier for the next buyer.
This is acquisition that costs a fraction of paid. The trust is borrowed from someone the prospect already knows, and tracking its true payback is where our marketing analysis and automation use case helps.
🌱 Strategy 1.6: Build an owned community, not a rented audience
SEO and paid social are rented land. The algorithm shifts, and your traffic evaporates overnight.
My read: an owned community (email list, private group, SMS) is the opposite. One founder built a 70 to 80% return-customer rate by treating retention like a long marriage, not a one-night discount. Shopify stores leaning on community report deeper loyalty and better margins, a theme we explore in how AI can actually help you run your e-commerce business.
"Most analytics tools added AI. Luca is AI."
On the analytics side, Luca runs the same cross-category cohort analysis that founder ran manually, but in plain English. You ask "which second category lifts LTV most," and you get the answer before you design the program, no SQL or analyst required. See the full picture across our use cases.
Pillar 3: Personalization & Subscriptions: how do you keep customers past the cancel cliffs? [toc=6. Pillar 3: Personalization & Subscriptions]
Subscribers churn at predictable cliffs: the billing-reminder spike and the post-second-renewal drop. Beat them with specific moves: a "stay subscribed past day 27, win 5 free cases" giveaway, and a plain-text founder email sent right at the billing spike that earned one brand $40,000. Personalize the mechanics (reorder timing, recommendations) while protecting the emotional layer, because buyers do not decide on a one or a zero.
⏰ Strategy 1.7: Personalize the replenishment timing
A subscription cancels when it arrives at the wrong time. Too soon, and the customer feels overstocked. Too late, and they already rebought elsewhere.
So personalize the cadence to actual usage, not a default 30 days. Replenishment flows (the reminder that you are about to run out) see 35 to 50% open rates when timed right. That is the highest-intent email you will ever send, and pairing it with real usage data is core to our product management use case.
💰 Strategy 1.8: Engineer interventions at the cancel cliffs
The cancel thought arrives at predictable moments. Get there first.
- The Day 27 giveaway. One brand offered: stay subscribed past day 27, and you could win 5 free cases. Churn dropped.
- The $40,000 email. A plain-text founder note, sent right at the billing-reminder spike, won back enough second-guessers to make one brand $40,000.
- The reply-to-buy SMS. 310 Nutrition prompted reorders by simple text reply, adding $400,000 a month.
None of these are a discount. They are timing plus a human touch, the kind of move our sales performance tracking is designed to spot.
🎨 Strategy 1.9: Personalize the mechanics, protect the soul
Here is the contested part. Over-optimize, and you strip the feeling that made people buy.
One fashion operator admitted they got too data-driven and lost the emotional side. Their lesson: people do not decide on a one or a zero. Use data for the mechanics (timing, recommendations), and protect the brand voice that earns the relationship.
"Clearco Lost Touch With Its Own Business Model. The new rep didn't take the time to understand our business or advocate for us internally."
— Melissa Clearco Trustpilot Verified Review
That is what losing the human layer looks like from the customer's seat. On the analytics side, Luca pings you when churn at a specific renewal cliff breaks its usual pattern, so you launch the Day 27-style intervention before the cohort cancels, not after the MRR report shows the damage. It works like agentic AI for e-commerce founders should.
Pillar 4: Reactivation: how do you win back lapsed customers, and which tactics pay back fastest? [toc=7. Pillar 4: Reactivation]
A single win-back email reactivates about 6.2% of lapsed customers. An optimized three-email sequence with segmentation, timing, and escalating incentives reactivates 14 to 18%. The move that beats a discount is a plain-text founder note sent at the right moment. Reactivation is cheaper than acquisition every time, so rank your tactics by effort versus payback, and build the highest-ROI flow first.
📧 Strategy 1.10: Build the segmented three-email win-back
One sad "we miss you" email is leaving money on the table. The data is clear on the gap.
- Single win-back email: about 6.2% reactivation.
- Optimized three-email sequence: 12 to 18% reactivation.
The sequence works because it segments by past value, times the sends, and escalates the incentive only if the first soft touch fails. Lead with a reminder, not a discount.
✍️ Strategy 1.11: Send the founder plain-text note
The same plain-text founder email that worked at the billing spike works for reactivation. No design, no header image, just a human asking what went wrong.
It converts because it does not look like marketing. I have watched these out-perform polished campaigns more than once. My read: the rawness is the feature, not a bug.
📱 Strategy 1.12: Use reply-to-buy SMS for the fast lane
For lapsed buyers, friction kills reactivation. A reply-to-buy SMS lets them reorder by texting back, no checkout flow needed. It is the cheapest path back for a customer you already paid to acquire.
📊 Effort versus payback across all 12 strategies
Prove the cheap moves first before scaling the expensive ones. Here is how I rank them.
"I would avoid if possible. First off customer support is non existent. We needed to reach their team on two separate occasions, and no one gets back to you."
— Terry Clearco Trustpilot Verified Review
That is a financing-provider complaint, but it doubles as a reactivation lesson: silence is what loses the customer in the first place. On the analytics side, Luca identifies the lapsed cohort worth winning back by past LTV, not recency alone, so your sequence targets the customers who will actually repay the effort. That is why operators compare us against Clearco alternatives.
Which intelligence layer actually fixes retention: dashboards, general AI, or an AI co-founder? [toc=8. The Intelligence Layer]
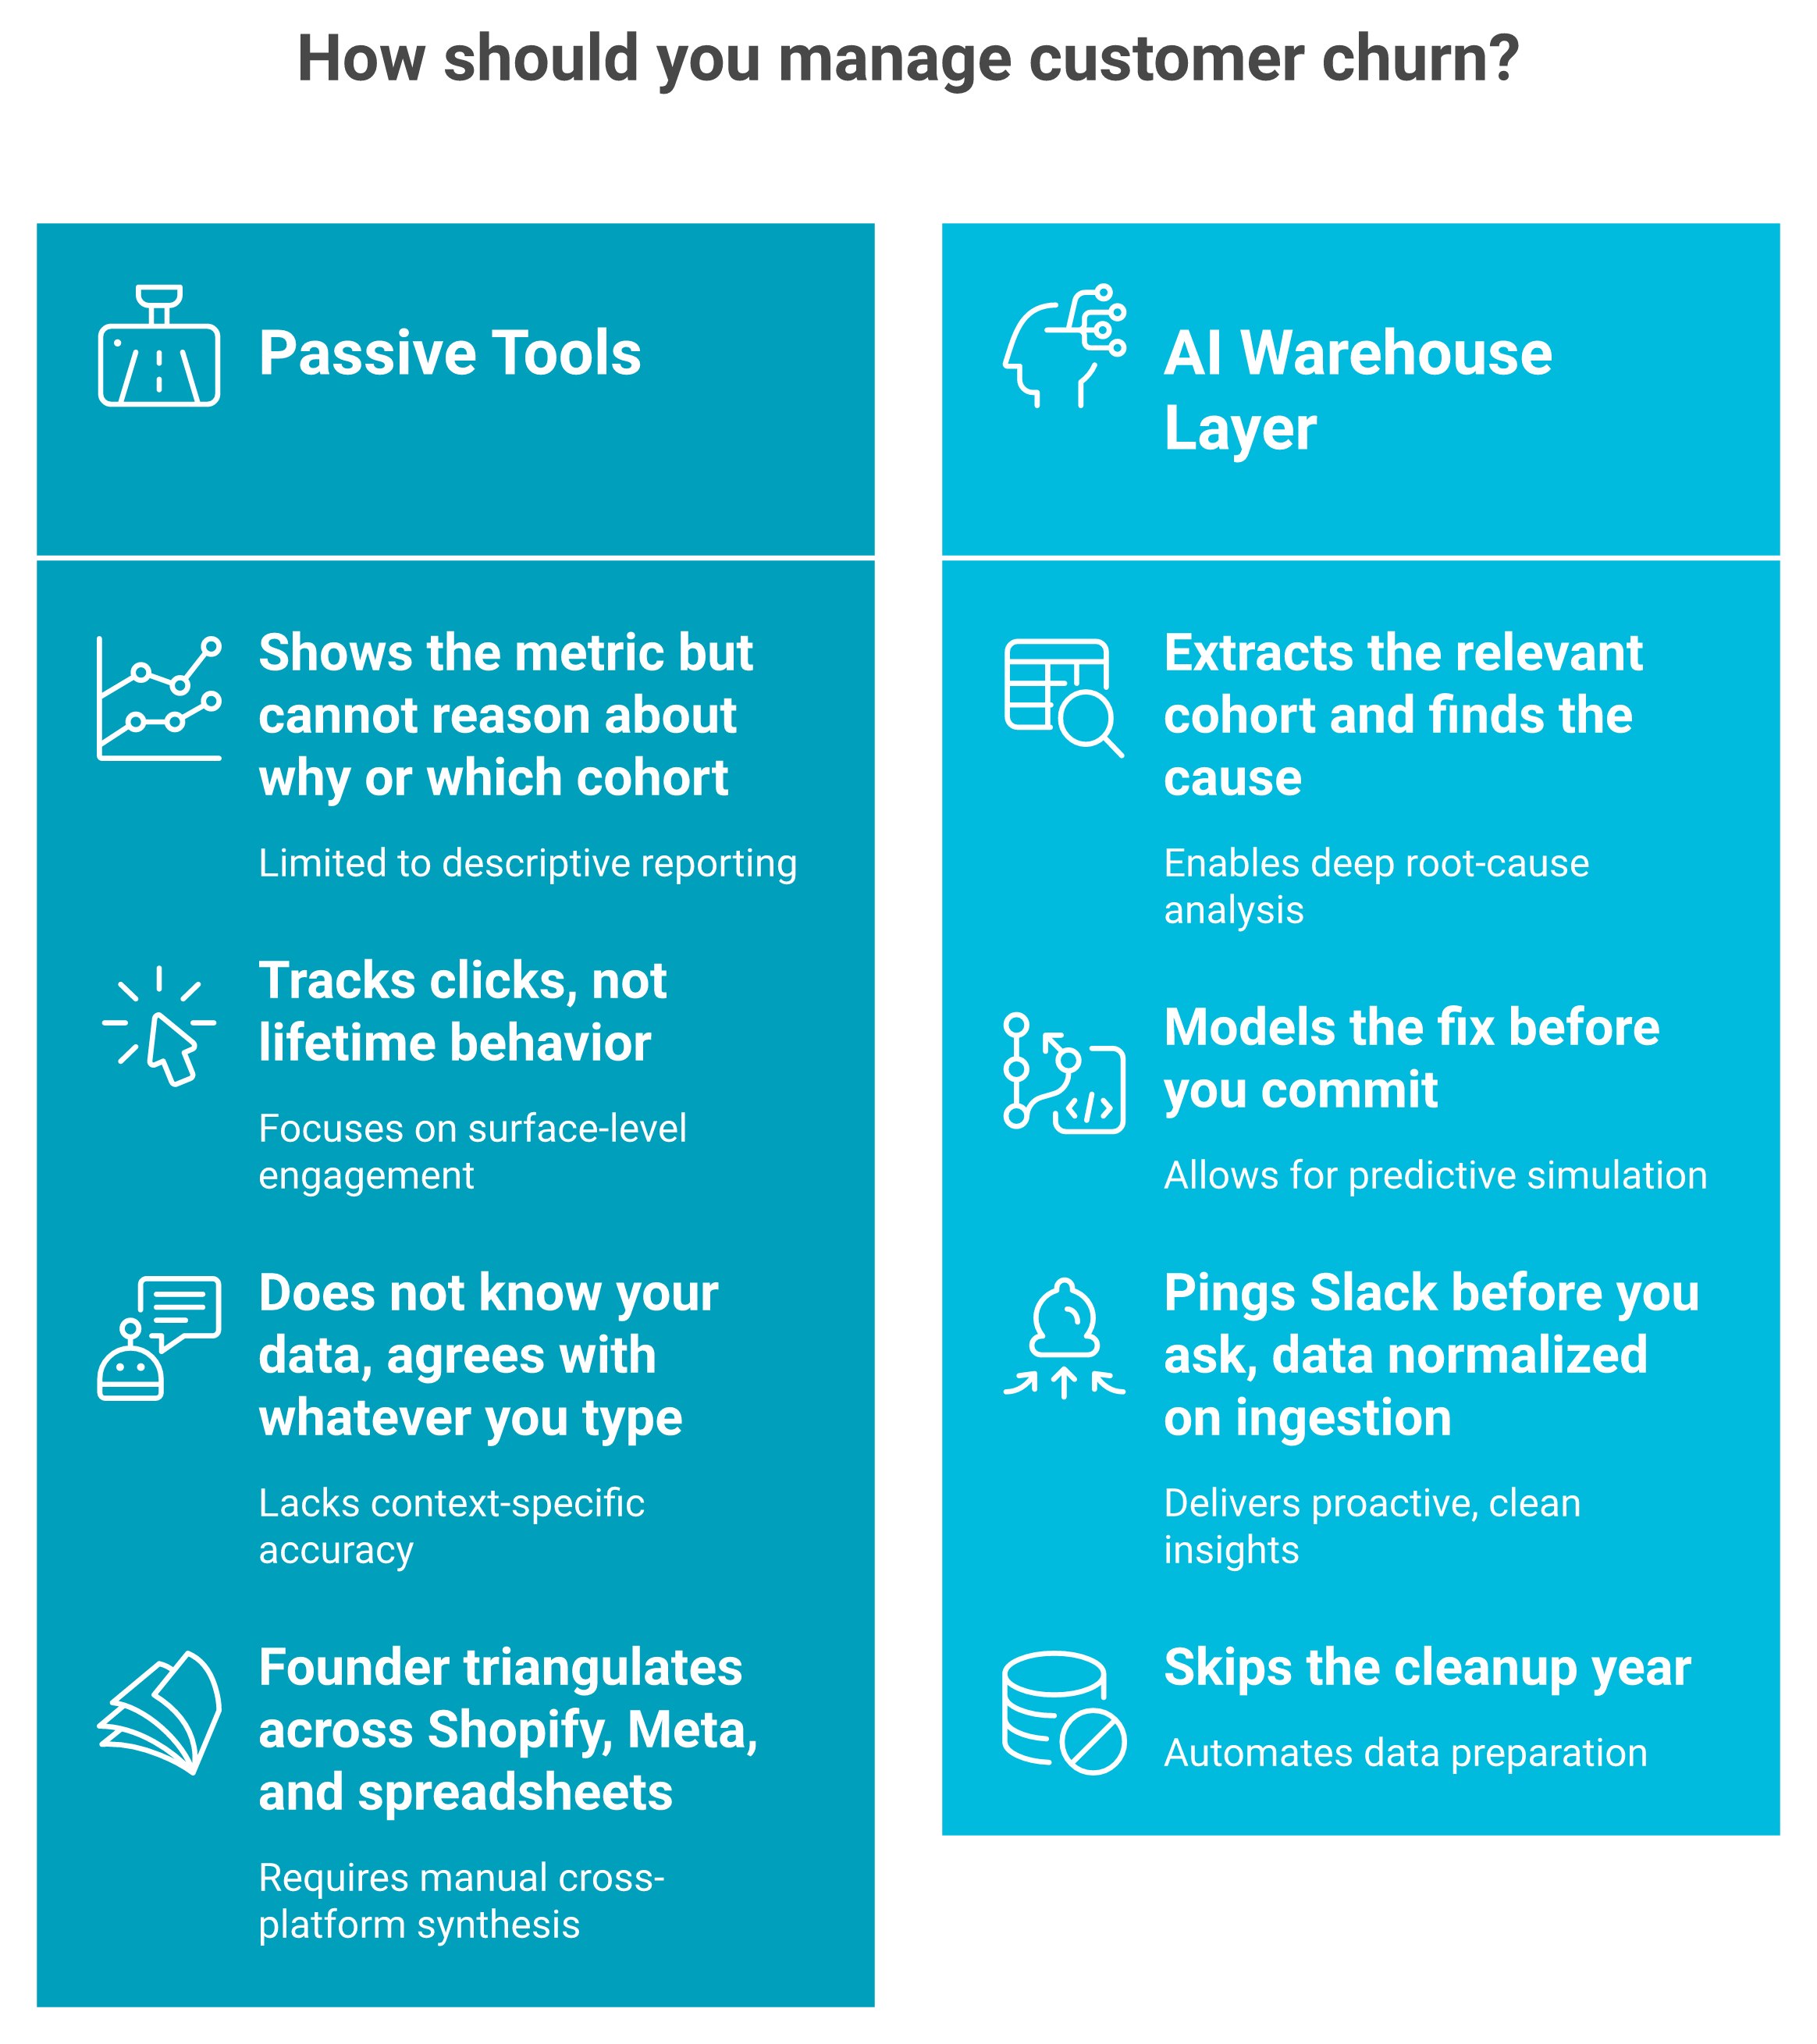
Dashboards show the leak but do not reason about it. General AI does not know your data. Attribution pixels track clicks, not lifetime behavior. What fixes retention is an AI layer sitting on your data warehouse that extracts the relevant cohort from the pool, finds the root cause, simulates the fix, and pushes the alert to Slack before you ask. That is the difference between reporting churn and preventing it.
🪞 Why dashboards leave you triangulating at 11pm
A dashboard is a rear-view mirror. It shows churn went up. It does not tell you why, or which cohort, or what to do.
So the founder ends up triangulating across Shopify, Meta, and a spreadsheet on Sunday night. That manual stitching is the real cost, and it is where decisions get slow and wrong. We compared this directly in our look at Triple Whale alternatives.
🤖 Dashboards vs general AI vs an AI layer over your warehouse
Here is the honest comparison on the analytics metrics that matter for retention.
✅ Luca reasons across marketing, finance, and operations in one place. ✅ It scans your data 24/7 and pings you when CAC spikes or a cohort's repeat rate dips. ❌ A dashboard only displays, leaving the synthesis to you. ✅ Luca finds the influencing components and the optimized areas, then pushes a weekly report with graphs and reasoning. ❌ An isolated tool cannot see the full picture, a gap we cover in ecommerce analytics platforms.
⚠️ Why general AI is not the answer either
A general chatbot does not know your store. It will agree with whatever you type, which is dangerous when real cash is on the line.
"You're talking to a computer that doesn't understand what it is saying. It's designed to agree with you."
— u/nur12fn, r/shopify Reddit Thread
"News at 10: AI systems agree with you because engagement is their primary function."
— u/nuqb4zg, r/shopify Reddit Thread
One health founder spent about $10 million building proprietary data tech, then watched general reasoning engines arrive ten times better. The lesson: do not build, and do not trust a chatbot that cannot see your numbers. Luca is the AI layer that normalizes your data on ingestion, so you skip the cleanup year. Plug in, ask, act. Most analytics tools added AI. Luca is AI, as we explain in what is Luca AI, the AI co-founder for e-commerce explained.
When retention needs inventory cash, how do you fund it without predatory financing? [toc=9. Funding the Fix]
Retention often needs cash up front: stock for the second purchase, a loyalty reorder, a replenishment run. Traditional revenue-based financiers fail here on the metrics that matter: opaque effective rates that work out near 36% APR, last-minute reversals after written approval, and slow disbursal when timing is the whole point. Judge capital on rate, speed to funds, and contract terms, nothing else.
💰 Retention is a cash problem before it is a marketing problem
Every retention tactic in this article needs inventory behind it. The second purchase needs stock on the shelf. The replenishment flow needs product to ship.
That is the trap. You break even on a new customer around month 12, so the cash to fund repeat orders is tight exactly when you need it most. Timing is the whole game, and that is where revenue-based financing (capital repaid as a slice of daily sales) keeps failing operators, a problem we unpack in calculating working capital for ecommerce business needs.
⚠️ Judge capital on three numbers, nothing else
When you are shopping for working capital, ignore the friendly sales rep. Judge the offer on three things only.
The effective rate is the one operators miss. A "6% for 4 months" offer with weekly repayment can work out near 36% APR, because you only hold half the money on average. We break down this math in funding to scale e-commerce marketing campaigns.
💸 What the reversals look like from the operator's seat
The worst failure is not the rate. It is getting approved, planning around it, then getting pulled at the last minute.
"After being offered funding in writing with specific amounts, repayment terms, and confirmation that the deal was approved, Wayflyer abruptly reversed their decision at the last minute. This caused significant disruption to our operations and cash flow."
— Geoff Brand Wayflyer Trustpilot Verified Review
"Signed a contract, got 0 funding due to tech issues. Kept an illegal UCC lien on my company for 6 months."
— E.S. 8fig Trustpilot Verified Review
"Wasted 10 days with daily promises that were never kept. Told me I don't have enough cash runway. Business doing 1.3mil turnover, 400k of stock, no debt, 100k profit. Good enough for everyone else, so went to a competitor."
— A Ovidiu Uncapped Trustpilot Verified Review
These are not edge cases. They are a pattern: clean numbers, written approval, then a reversal that wrecks the inventory plan. It is why founders keep searching for Wayflyer alternatives.
✅ Where Luca's capital fits
Data needs action. Action needs capital. Luca closes that loop inside one conversation.
On the capital side, we compete on the three numbers that matter: faster disbursal because funding sits in the same chat where the decision is made, a transparent rate you can see before you commit, and no underwriter behind a curtain reversing a written approval. My read, after watching too many founders get pulled at the last minute, is that predictability beats a slightly lower headline rate every time. That conviction sits at the heart of the intelligence capital thesis.
Here is the question I am sitting with for 2027. As capital moves inside the tools founders already use, does the standalone revenue-based financier survive at all, or does funding just become a button next to the insight that triggered it? Tell us what you are building, and where your cash actually gets stuck, on our contact page, or see how the model compares in Luca AI vs Wayflyer.
References [toc=References]
Sources are ordered by the trust hierarchy: operator threads and verified reviews first, then platform and aggregator data, then vendor and benchmark docs.
Operator Threads & Verified Reviews
- u/nur12fn. "You're talking to a computer that doesn't understand what it is saying. It's designed to agree with you." Reddit r/shopify. https://www.reddit.com/r/shopify/comments/1ppyyxv/comment/nur12fn
- u/nuqb4zg. "AI systems agree with you because engagement is their primary function." Reddit r/shopify. https://www.reddit.com/r/shopify/comments/1ppyyxv/comment/nuqb4zg
- Gemma. "Honestly stunned at how badly this was handled. No one capable of interpreting multi-store data." Trustpilot. https://www.trustpilot.com/reviews/698aae459329313c8d8ce89e
- Melissa. "Clearco Lost Touch With Its Own Business Model." Trustpilot, Jun 27, 2025. https://www.trustpilot.com/reviews/685d67d5d82c44a6f1af88c3
- Terry. "I would avoid if possible. Customer support is non existent." Trustpilot, Mar 6, 2024. https://www.trustpilot.com/reviews/65e78f87e0dea14e4836a696
- Geoff Brand. "Extremely disappointing. Reversed their decision at the last minute." Trustpilot, Oct 21, 2025. https://www.trustpilot.com/reviews/68f73d58d18488d7a62a838b
- E.S. "Professional on the outside, toxic inside. Kept an illegal UCC lien for 6 months." Trustpilot, Jan 22, 2026. https://www.trustpilot.com/reviews/6971f0b6bbacd1855fc0a07c
- A Ovidiu. "Wasted 10 days with daily promises that were never kept." Trustpilot, Jan 23, 2024. https://www.trustpilot.com/reviews/65aeb2342d927b7f283b6ce6
- Julian Fernau. "Pretty expensive product at 35-40% APR." Trustpilot, Jul 6, 2024. https://www.trustpilot.com/reviews/668845f277d732358cbeeb93
Platform & Aggregator Data
- Rivo. "Ecommerce Customer Retention Statistics 2026: 21 Data Points." 2025. https://www.rivo.io/blog/ecommerce-customer-retention-statistics
- RetentionLab. "Repeat Purchase Rate: Measure & Improve." 2026. https://www.retentionlab.ai/blog/repeat-purchase-rate-measure-benchmark-improve
- Common Thread Collective. "Ecommerce Customer Retention: 10 Strategies That Don't Take a Genius." 2025. https://commonthreadco.com/blogs/coachs-corner/ecommerce-customer-retention-strategies
- Ringly.io. "Ecommerce Customer Acquisition Cost Statistics 2026." 2026. https://www.ringly.io/blog/ecommerce-customer-acquisition-cost-statistics-2026
- LoyaltyLion. "The Average CAC in Ecommerce (2025)." 2025. https://loyaltylion.com/blog/blog-average-cac-ecommerce
- Nas.io. "Why every Shopify store needs a community in 2025." 2025. https://nas.io/blog/why-every-shopify-store-needs-a-community-in-2025
Creator & Operator Media
- Klaviyo. "Customer Retention: 8 Strategies to Keep Buyers Coming Back." Mar 2025. https://www.klaviyo.com/blog/retention-marketing-strategies-brands
- Recharge. "6 Ecommerce Retention Strategies to Maximize Repeat Business." May 2023. https://getrecharge.com/blog/6-ecommerce-retention-strategies-to-maximize-repeat-business/
- US Tech Automations. "E-Commerce Win-Back Email Automation: Reactivate 15% of Lapsed Customers." Mar 2026. https://ustechautomations.com/resources/blog/ecommerce-win-back-email-automation-reactivate-lapsed-customers
Vendor Docs
- Klaviyo. "How to calculate retention rate." Klaviyo Help Center. https://help.klaviyo.com/hc/en-us/articles/360042176831
- Darkroom. "Email Marketing Benchmarks Ecommerce 2026 (Klaviyo)." 2026. https://www.darkroomagency.com/observatory/email-marketing-benchmarks-ecommerce-2026
- LoyaltyLion. "Ecommerce Customer Retention Rate: Definitions, Formulas and Benchmarks." Mar 2024. https://loyaltylion.com/blog/customer-retention-rate

.webp)
.svg)
.webp)

.png)
