10 Best Lifetimely Alternatives That Let You Redefine LTV and CAC Yourself
11
mins read
TL;DR
The ten best Lifetimely alternatives in 2026 are Luca AI, Triple Whale, Polar Analytics, Peel Insights, Northbeam, Daasity, RetentionX, BeProfit, TrueProfit, and Sellerboard.
Operators leave Lifetimely for architectural reasons, not quality reasons. It holds 4.8 to 4.9 across roughly 490 Shopify App Store reviews.
Three ceilings trigger the switch: order-volume pricing that jumps at BFCM, Shopify-only coverage, and no QuickBooks or Xero connection.
Published DTC benchmarks use contribution-margin LTV. A gross-margin default can show 3.1:1 LTV to CAC when the true ratio is nearer 2.2:1.
Median blended CAC is projected at $58 by Q3 2026, up from $44, so a wrong CAC allocation now costs more than it did in 2021.
Below roughly $30K monthly revenue, a spreadsheet still beats every paid tool on return. Buying the wrong category is the expensive mistake.
Q1. What Are the 10 Best LTV & CAC Analytics Tools for E-commerce in 2026? [toc=1. 10 Best Tools]
The ten best Lifetimely alternatives in 2026 are Luca AI, Triple Whale, Polar Analytics, Peel Insights, Northbeam, Daasity, RetentionX, BeProfit, TrueProfit, and Sellerboard. Luca AI ranks first because it is an AI reasoning layer over your unified store data. It extracts the slice that matters, finds root cause, simulates changes, and answers LTV or CAC on the definition you specify in plain English.
I scored every tool on one question the rest of this SERP skips: can you change the formula yourself? Most comparison pages ask whether a tool has LTV and cohort reports. Almost every tool does. The real difference is whether you can edit the LTV window, swap gross margin for contribution margin, and slice a cohort by first product purchased without filing a support ticket. Published DTC benchmarks are built on contribution-margin LTV, not gross margin, so that choice moves your reported ratio by a full tier.
The 10 Best Lifetimely Alternatives at a Glance
Luca AI: Best for plain-English LTV and CAC on your own definitions
Triple Whale: Best for first-party attribution plus profit tracking
Polar Analytics: Best for custom metrics with warehouse access
Peel Insights: Best like-for-like cohort and retention swap
Northbeam: Best for high-spend media measurement
Daasity: Best for owning your own data warehouse
RetentionX: Best budget customer intelligence layer
BeProfit: Best simple multi-store profit tracker
TrueProfit: Best real-time net profit for small stores
Sellerboard: Best low-cost option for Amazon plus Shopify
Comparison Table
10 Best Lifetimely Alternatives Compared (Verified August 2026)
Tool
Key capabilities offered
Best For
Pricing
Luca AI ⭐⭐⭐⭐⭐
Plain-English querying, editable LTV and CAC definitions, root-cause analysis, predictive reorder and sales alerts, automated Slack and email reports
$1M to $5M DTC brands with piling data and no analyst
Real-time net profit, order-level COGS, ad-spend sync, LTV reporting
Sub-1,500-order stores needing net profit fast
$35 / Month to $200 / Month
Sellerboard ⭐⭐
Profit dashboard, FBA fee and reimbursement tracking, order-level costs
Amazon-first sellers with a Shopify side channel
$9 / Month to $79 / Month
1.1 Luca AI [toc=1.1 Luca AI]
Luca AI is an AI intelligence layer that sits on top of your unified store data. It connects your sources, normalizes them on ingestion, then answers questions in plain English across sales, marketing, product, profit, customer, and operational data.
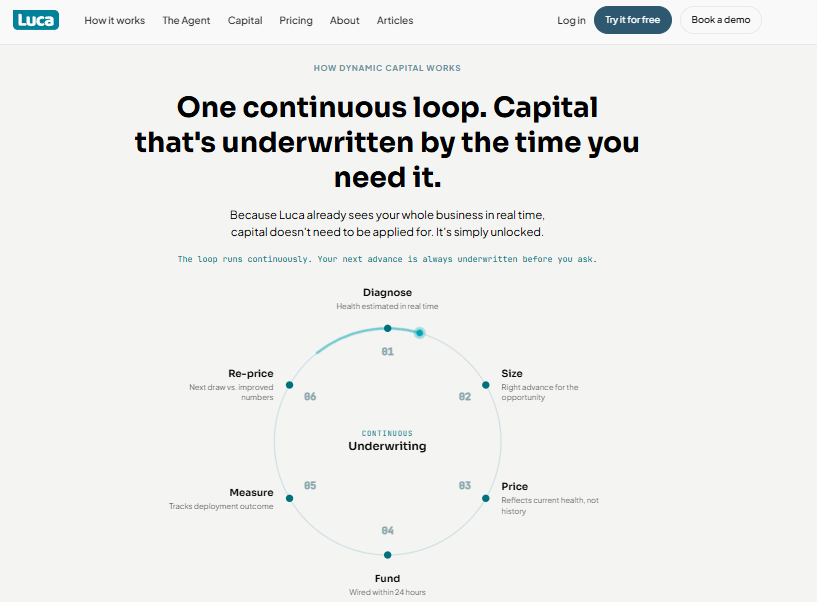
Luca AI underwrites capital continuously, pricing each advance on current business health, not past history.
🤔 Why did we choose this tool?
I am the founder of Luca AI, so put this first item under a microscope. I placed it first for one reason that fits this exact keyword. Every other tool here ships a fixed LTV formula. You get the vendor's window, the vendor's margin basis, and the vendor's cohort dimensions.
Luca AI has no fixed formula to fight. You ask for contribution-margin LTV by first product purchased, and it reasons across your Shopify, ad, and accounting data to answer. That is the whole promise of the title, so it earns position one.
🧩 Solutions Offered
Single source of truth across Shopify, Meta, Google, Klaviyo, and your accounting stack
📁 Case Study: The Best Seller That Was Losing Money
The problem. A skincare brand doing mid seven figures on Shopify had a hero SKU. The invoice showed 72% gross margin. The team was scaling paid spend behind it.
How Luca AI helped. Luca AI pulled every cost between the supplier invoice and the settled order. Freight, returns, payment fees, and support load all came in. One finding stood out. That single product drove 42% of all support tickets, which worked out to $1.45 per unit in real cost.
The outcome. True contribution margin on the hero SKU was 8%, not 72%. The founder cut spend behind it inside a week and moved budget to a lower-revenue SKU with real margin. Gross margin only tells you what it costs to make the thing. It never tells you what it costs to sell it.
Luca AI normalizes and standardizes every source on ingestion, so the cohort you ask for by discount code or first product purchased comes back as a reasoned answer instead of a feature request.
1.2 Triple Whale [toc=1.2 Triple Whale]
Triple Whale is the most common landing spot for operators leaving Lifetimely. It is also a category change, not a swap. You are buying first-party attribution with profit reporting attached, not a deeper cohort tool.
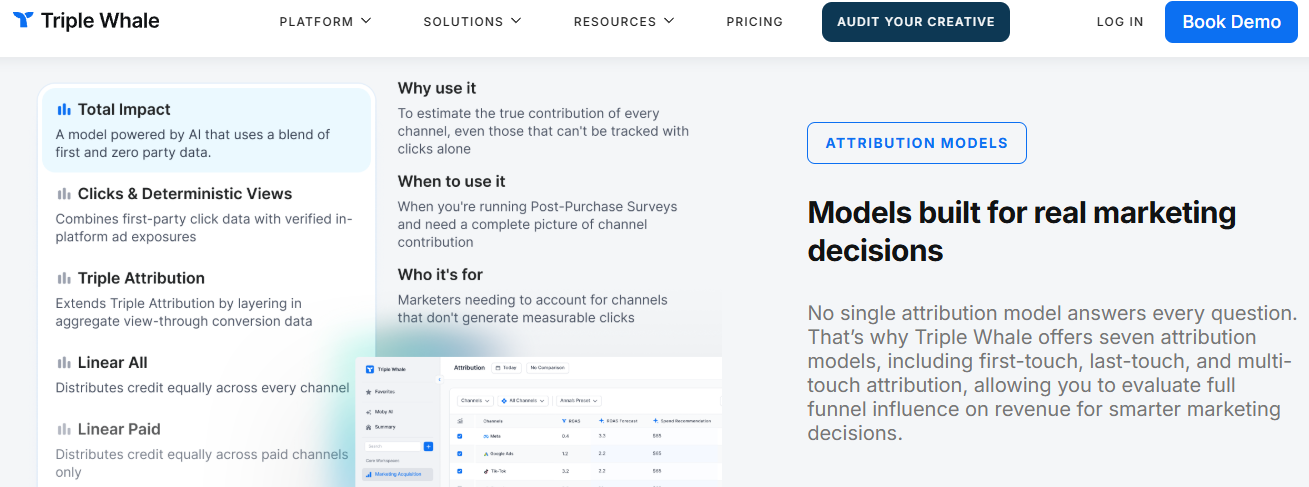
Triple Whale ships seven attribution models, solving channel credit rather than deeper cohort LTV reporting.
🤔 Why did we choose this tool?
Triple Whale earns its place on breadth and adoption. Triple Pixel collects tracking data independent of the ad platforms. Cohort analytics, creative reporting, and a SQL editor arrive on the higher tiers.
Definition control is partial and gated. You can customize which metrics appear and write SQL on upper plans. On entry tiers, you largely accept the attribution model as built, which is where most complaints land, as covered in our breakdown of Triple Whale alternatives.
🧩 Solutions Offered
Triple Pixel first-party tracking with multi-touch attribution models
Unified dashboard across ads, email, SMS, and organic channels
Cohort, creative, and product analytics on higher tiers
Moby AI for automated analysis and summaries
Slack alerts and a free Founders Dash for benchmarking
LTV method: Cohort-based LTV, available from the tier that unlocks cohort analytics
Platform coverage: Shopify-first, with broader coverage on custom tiers
Accounting integration: No native general-ledger connection, so profit is contribution-level
Data refresh: Near real-time on ad and order data
🎯 Best For
Brands spending heavily across Meta and Google that need channel truth first
Operators who value one dashboard over one accurate cohort, a trade-off we unpack in our guide to Shopify analytics apps
Teams under $1M GMV who can start on the free Founders Dash
⭐ Reviews
"Triple Whale is very user-friendly and easy to navigate to find the data you need across multiple channels. Relevant channels like emails, ads, organic, etc are already broken down for you and when looking at the specific channel, you have the option to customize the table displaying the data to choose which metrics are most relevant for your needs." Verified User, 4/5, Triple Whale G2 Verified Review
"Sometimes it does not update the numbers correctly and has errors with synchronisation." Verified User, 3/5, Triple Whale G2 Verified Review
Across 151 aggregated public mentions on Reddit, X, and LinkedIn, peer sentiment on Triple Whale grades as Good rather than world-class. That tracks with the reviews above. People like the interface and question the numbers.
⚠️ Skip It If
Skip Triple Whale if your problem is cohort depth rather than channel credit. Published pricing also varies widely by source and GMV tier, from a $129 entry to $1,290 and beyond. Get your own quote in writing before you plan a budget around any figure you read online, including mine.
Luca AI takes the opposite architectural bet: it is not an attribution pixel and does not replace one, so operators who need channel credit should run an attribution tool alongside it rather than instead of it. That distinction matters when you are separating platform ROAS from true profitability.
1.3 Polar Analytics [toc=1.3 Polar Analytics]
Polar Analytics is the strongest pick if you want to build metrics yourself without hiring an engineer. It is a category change from Lifetimely, not a swap.
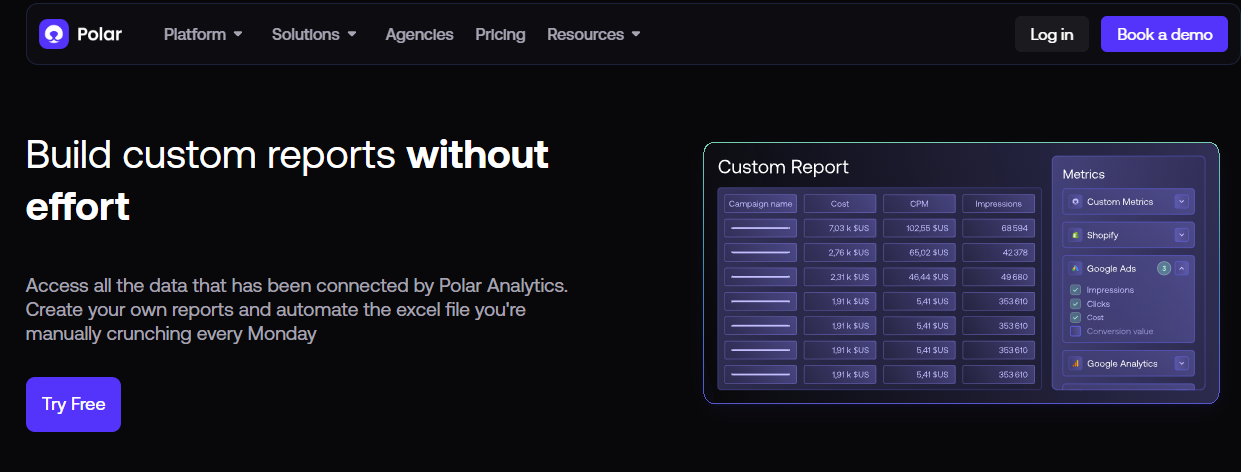
Polar Analytics builds custom metrics from connected data, replacing the Monday morning spreadsheet crunch.
🤔 Why did we choose this tool?
Polar ships a custom metric builder plus direct access to the underlying warehouse. That means you can define contribution-margin LTV on your own terms.
Peer sentiment across aggregated public posts grades Polar as world-class on attribution and data accuracy. The cost of that control is real, and the pricing scales with your GMV.
🧩 Solutions Offered
Custom metric builder with your own formulas
Snowflake warehouse access for raw queries
Ask Polar for natural-language questions
Klaviyo Audiences and omnichannel connectors
Incrementality testing as a paid add-on
📊 Core Evaluation Metrics
Metric definition control: High. Custom metrics plus SQL through warehouse access
LTV method: Cohort and custom, dependent on the cost data you load
Platform coverage: Shopify plus marketplace and retail connectors
Accounting integration: Limited native general-ledger support
Data refresh: Scheduled syncs, with reported update lags
🎯 Best For
Brands above $5M revenue that want warehouse control without engineers
Teams with a numbers owner who enjoys building metrics
"Shortly after onboarding we were assigned an account manager. About a month later, she was laid off and we were never assigned a new account manager. I have the direct email of a support specialist, but the response time has been less than ideal." Ben S., Director of Commercial Operations, 4/5, Polar Analytics G2 Verified Review
"The pricing communicated when installing the app via Shopify was completely different from the one provided by sales after the installation (which was much higher)." Maja, SE, Polar Analytics TrustPilot Verified Review
💰 Pricing: $720 / Month to $7,970 / Month, with a $3,200 per month incrementality add-on
⚠️ Skip It If
Skip Polar if you are under $2M in revenue. The entry price alone is roughly nine times Lifetimely's mid tier.
1.4 Peel Insights [toc=1.4 Peel Insights]
Peel Insights is the closest thing to a like-for-like Lifetimely swap. Cohorts and retention are the product, not a side feature.
🤔 Why did we choose this tool?
Peel automates cohort and retention analysis, and it runs deepest on subscription metrics. If your only problem is cohort depth, this is the cheapest honest fix.
Definition control is moderate. You get flexible cohort slicing, though the margin basis still depends on the cost data you feed it.
LTV method: Historical cohort LTV, strongest on subscription data
Platform coverage: Shopify and subscription platforms
Accounting integration: No native general-ledger connection
Data refresh: Scheduled daily refreshes
🎯 Best For
Subscription and replenishment brands with repeat purchase cycles
Operators who need cohorts, not attribution
Agencies managing up to three stores on one plan
⭐ Reviews
"It's very easy to set up and saves time. It was a good balance." Verified user, 4.5/5 average across 32 reviews, Peel Insights G2 Verified Review
"Peel Analytics is a bit more expensive than other analytics applications available, which can be a limitation for start-ups with limited budgets. Users must have a bit of technical knowledge to integrate Peel analytics with other websites." Verified user, Peel Insights G2 Verified Review
💰 Pricing: $179 / Month to $899 / Month
⚠️ Skip It If
Public sentiment volume is thin here, with only three classified public mentions and a negative net score. That is not damning, but it means fewer peers to ask before you buy.
1.5 Northbeam [toc=1.5 Northbeam]
Northbeam solves media measurement, not LTV definition. Buying it to replace Lifetimely means solving a different problem.
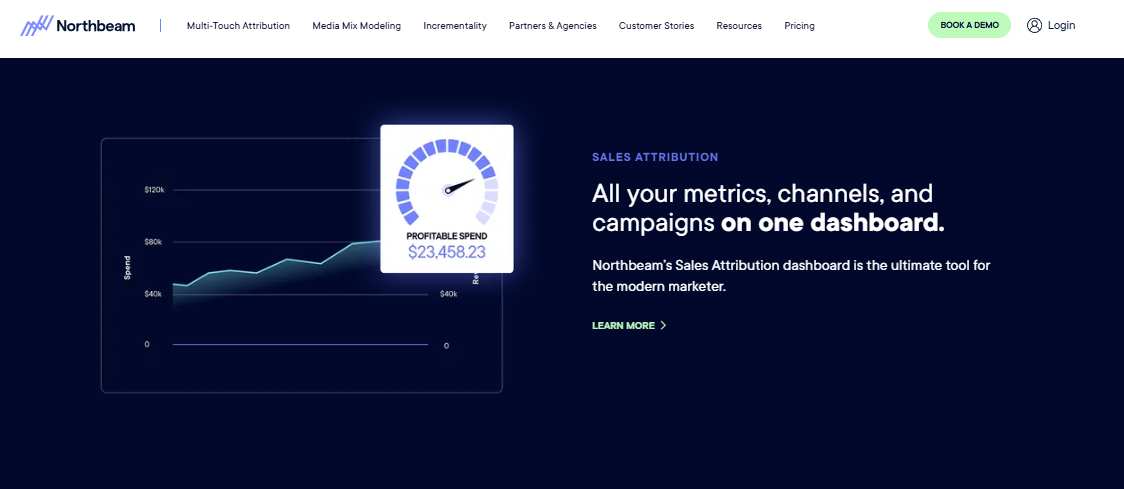
Northbeam consolidates profitable spend by channel, built for brands spending heavily on paid media.
🤔 Why did we choose this tool?
Northbeam earns inclusion because heavy spenders genuinely outgrow blended reporting. Multi-touch attribution and media mix modeling are its core.
The trade-off is cost and ramp. The Starter floor sits near $1,500 per month, with a 30 to 45 day onboarding period.
"Expensive - this is really targeted towards upper mid-size to enterprise operations. Smaller eCommerce brands should probably look elsewhere. Integration could be easier or more automated." Verified user, Northbeam G2 Verified Review
"I paid $3,000 in Northbeam's services for 3 months, including integration for Magento2 integration. The experience, especially with their attribution model, was dismal compared to Google Analytics 4 (GA4)." Verified reviewer, 3.2/5 TrustScore, Northbeam TrustPilot Verified Review
💰 Pricing: $1,500 / Month to Custom
⚠️ Skip It If
Skip Northbeam if your question is "which customers are worth more" rather than "which ad got credit."
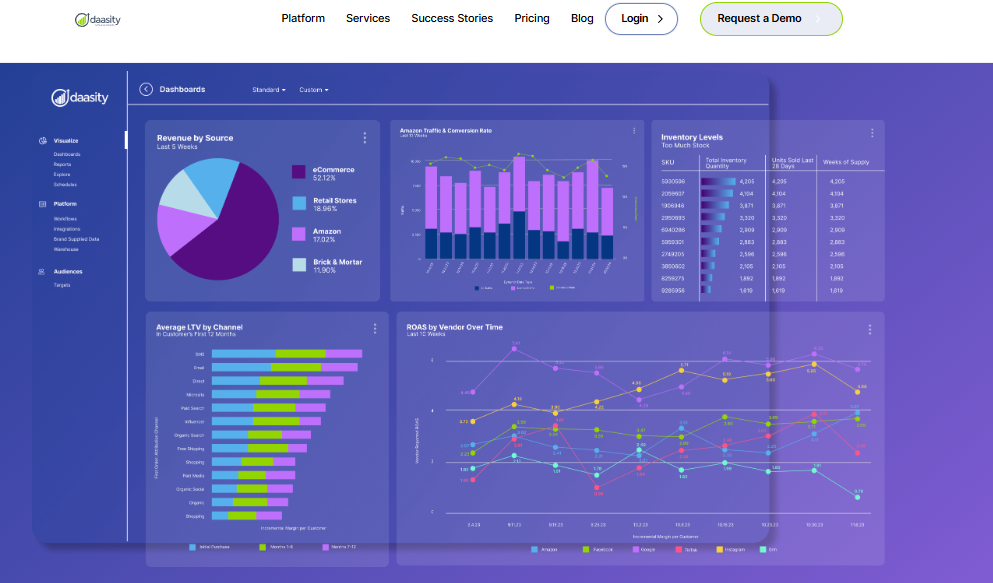
1.6 Daasity [toc=1.6 Daasity]
Daasity is an infrastructure change. You are buying a managed pipeline into your own warehouse, plus a modeling layer on top.
Daasity models omnichannel revenue, inventory and channel LTV inside your own managed data warehouse.
🤔 Why did we choose this tool?
Daasity is the honest answer for brands whose real problem is data plumbing. It handles extraction, normalization, and modeling across omnichannel sources.
Definition control is effectively total, because the SQL is yours. You just need someone who can write it.
"There are a few platforms that are not yet automated (we market in a few unique channels), so at times there is manual entry to create an overall marketing performance. Finally, at times I wish a few reports would refresh in real time (they do overnight)." Verified user, 4.5/5, Daasity G2 Verified Review
"Daasity has been a fantastic solution for us that has allowed us to connect multiple data sources (Shopify (including ReCharge), GA, Klayvio, ZenDesk and more)." Shopify merchant, Daasity Shopify App Store Verified Review
💰 Pricing: From $1,899 / Month
⚠️ Skip It If
Skip Daasity if nobody on your team writes SQL. You will pay for a warehouse and still wait on someone else for answers.
1.7 RetentionX [toc=1.7 RetentionX]
RetentionX is a direct swap on the customer side, at a fraction of enterprise pricing.
🤔 Why did we choose this tool?
RetentionX focuses on customer intelligence: LTV, churn risk, and segmentation. Entry pricing starts at $49 per month, which makes it the cheapest serious cohort option here.
Definition control is moderate. Segments are flexible, but the margin basis follows the cost fields you populate.
LTV method: Historical and predictive customer LTV
Platform coverage: Shopify plus non-Shopify sources
Accounting integration: No native general-ledger connection
Data refresh: Scheduled syncs
🎯 Best For
Retention-led brands under $5M revenue
Teams that live in email and SMS segmentation
Operators priced out of Polar or Northbeam
💰 Pricing: $49 / Month to $249 / Month
⚠️ Skip It If
Skip RetentionX if you need ad-spend truth in the same view. Customer intelligence is the strength, and paid measurement is not.
1.8 BeProfit [toc=1.8 BeProfit]
BeProfit is a straightforward profit tracker with LTV and cohort reporting attached. It is a swap, not an upgrade.
🤔 Why did we choose this tool?
BeProfit covers real-time P&L, cost breakdowns, and multi-store dashboards. Paid plans start at $49 per month, with a free tier for small stores.
Definition control is low. You choose which costs to include, though the underlying LTV logic stays fixed.
🧩 Solutions Offered
Real-time profit and loss dashboard
Order-level cost and margin breakdowns
LTV and cohort reporting
Ad-spend syncs across major channels
Multi-shop view in one account
📊 Core Evaluation Metrics
Metric definition control: Low. Cost inputs are editable, formulas are not
LTV method: Historical cohort LTV
Platform coverage: Shopify, WooCommerce, and other carts
Accounting integration: Limited
Data refresh: Near real-time on orders
🎯 Best For
Small multi-store operators comparing margin across shops
Stores under 3,000 monthly orders
Founders who want one profit number, fast
💰 Pricing: $49 / Month to $249 / Month
⚠️ Skip It If
Skip BeProfit if your reason for leaving Lifetimely was rigid LTV logic. You are trading one fixed formula for another.
1.9 TrueProfit [toc=1.9 TrueProfit]
TrueProfit is the cheapest way to see real net profit per order. It is a swap for the profit half of Lifetimely, not the cohort half.
🤔 Why did we choose this tool?
TrueProfit holds a 5.0 rating across 739 Shopify App Store reviews, which is unusual at any scale. Per-SKU profitability and P&L reporting are its strengths.
The limits are clear. There is no QuickBooks or Xero integration, product analytics sit behind the $99 tier, and orders above your cap add fees.
🧩 Solutions Offered
Real-time net profit per order and per product
P&L report with per-platform ad spend
Customer LTV cohort table by acquisition month
Marketing attribution with assisted and last-click views
Automated cost syncs from ad platforms
📊 Core Evaluation Metrics
Metric definition control: Low. Cost fields are editable, cohort logic is fixed
LTV method: Historical cohort LTV by acquisition month
Platform coverage: Shopify only
Accounting integration: None
Data refresh: Real time on orders and spend
🎯 Best For
Stores under 1,500 monthly orders running paid ads
Founders who need margin clarity before cohort depth
Operators wanting a cheap first step out of spreadsheets, ahead of a full unit economics system
⭐ Reviews
"The transaction fees are calculated by a formula although this can be pulled directly from Shopify. The result is that the transaction fees are calculated incorrectly." Shopify merchant, TrueProfit Shopify App Store Verified Review
"Always have issues every month with reporting and charge me so much! I ask for a partial discount for the month to rectify the situation and they said NO." Verified reviewer, TrueProfit TrustPilot Verified Review
💰 Pricing: $35 / Month to $200 / Month, plus per-order overage fees
⚠️ Skip It If
Skip TrueProfit if you sell on Amazon. It is built for Shopify, and marketplace sellers will hit that wall quickly.
1.10 Sellerboard [toc=1.10 Sellerboard]
Sellerboard is the only option here built Amazon-first. It earns two stars on this rubric because definition control is minimal.
🤔 Why did we choose this tool?
Sellerboard tracks profit after every FBA fee, which Shopify-native tools miss entirely. Entry pricing sits near $19 per month, the lowest on this list.
The LTV and cohort layer is thin. This is a profit dashboard for marketplace sellers, not a customer intelligence tool.
"It miscalculates VAT and significantly inflates margins, sometimes by 2-3 times the actual values!" Verified reviewer, 4.1/5 TrustScore across 78 reviews, sellerboard TrustPilot Verified Review
Skip Sellerboard if Shopify is your main channel. You will save money and lose the cohort layer you came here for.
Luca AI sits at the opposite end of this list from Sellerboard on one axis only: who owns the formula. Every other tool here ships a fixed definition of LTV and CAC, and my honest read is that this is the real reason operators keep switching and staying unhappy. If you want the reasoning layer instead of another dashboard, start with how operators actually use Luca AI.
Q2. How Were These 10 Tools Scored and Ranked? [toc=2. Scoring Methodology]
Five weighted criteria total 100: Metric Definition Control 30%, Cross-Functional Data Coverage 25%, Reasoning and Automation Depth 15%, Verified User Reviews 15%, and Pricing Transparency 15%. Bands run one star for 0 to 20, up to five stars for 81 to 100. Definition control carries the heaviest weight because a locked formula is a P&L decision a vendor made on your behalf.
⚖️ Why definition control outweighs feature counts
Most comparison pages score tools on how many reports they ship. That is the wrong test for this keyword.
Every tool on this list can show you an LTV number. Very few let you decide what goes into it. Metric definition control means four things: the time window, the margin basis, the cohort dimension, and how returns are handled.
📐 What each criterion measures
Scoring Rubric and Criteria Weights
Criterion
Weight
What it measures
Metric Definition Control
30%
Can you edit the LTV window, margin basis, cohort dimension, and CAC allocation without SQL
Cross-Functional Data Coverage
25%
Does it reach past ads and orders into accounting, banking, and operations
Reasoning and Automation Depth
15%
Root cause analysis, forecasting, and alerts that reach you without opening a dashboard
Verified User Reviews
15%
G2, Trustpilot, and app store verbatims, plus aggregated public sentiment
Pricing Transparency
15%
Is the full cost published, including add-ons and overage fees
Verification came from three places. Published pricing pages were checked directly. Review scores came from G2, Trustpilot, and Shopify App Store listings. Peer sentiment came from a leaderboard that classifies public posts on Reddit, X, and LinkedIn, with sponsored content filtered out.
🚫 What was deliberately left out
Feature counts were not scored. Neither were logo walls, funding rounds, or integration totals. A tool with 200 connectors and a fixed LTV formula still cannot answer the question in this article's title.
Setup time was folded into Reasoning and Automation Depth rather than scored alone. My reasoning is simple. A tool that takes six weeks to configure and then answers your real question beats one that installs in ten minutes and never does. That distinction shows up clearly when you compare ecommerce analytics platforms side by side.
💰 The disclosure
I founded the company that sits at position one. That is a conflict, and you should read this list with that in mind.
The rubric appears before the ranking for exactly that reason. If you disagree with the 30% weight on definition control, re-score the table yourself. Drop it to 15%, raise pricing transparency, and TrueProfit or RetentionX moves up.
⏰ One thing this rubric assumes
Every criterion here assumes you will revisit your numbers monthly. Unit economics are not a one-time audit. Shipping rates rise, return rates shift with seasons, and supplier costs move.
A tool that got your LTV right in January and cannot be re-pointed in July has failed you. That is why definition control is a durability score, not a features score, and why we treat unit economics tracking as an ongoing discipline.
Luca AI is our product, which is why the rubric appears before the ranking rather than after it. Anyone can build a scoring system that lands their own tool first. Publishing the weights lets you check whether we did, and you can see how Luca thinks before you take our word for anything.
Q3. Why Do Operators Leave Lifetimely, and Who Should Stay? [toc=3. Why Operators Switch]
Operators leave for architectural reasons, not quality reasons. Lifetimely prices by monthly orders: free under 50, $79 to 500, $149 to 3,000, $299 to 7,000, $499 to 15,000, $749 to 25,000, and $999 unlimited, plus a $75 per month Amazon add-on. It is Shopify-only, has no QuickBooks or Xero connection, and refreshes every few hours rather than in real time.
⭐ Start with what actually works
Lifetimely holds a 4.8 to 4.9 rating across roughly 490 Shopify App Store reviews, with about 97% at five stars. On G2 it sits at 4.6, and it tracks over 45,000 stores.
Serious agencies publish full implementation guides for it. Brandon Amoroso of Electriq recorded a report-by-report walkthrough covering how to set it up and act on each view. Nobody does that for a bad product.
💸 Ceiling one: pricing scales with your best month
The pricing ladder is the first wall operators hit. A Black Friday spike that pushes you from 1,500 to 3,000 monthly orders moves you a tier, with no way to opt out for one month.
For agencies, the pricing is per store, so the problem compounds across a portfolio. Billing mechanics can bite too.
"I downgraded the app during the free trial period but was charged the most expensive plan. Their weighted LTV is also very inaccurate." Shopify merchant, Lifetimely Shopify App Store Verified Review
🔌 Ceiling two: Shopify or nothing
Lifetimely does not support WooCommerce, BigCommerce, or headless setups. Amazon arrives through the paid add-on, refreshing once daily.
Operators are actively hunting for an equivalent elsewhere. One thread asks plainly for a WordPress or WooCommerce plugin that tracks profit and calculates precise lifetime value, which is a plumbing question about ecommerce platform integration more than a reporting one.
🧾 Ceiling three: the profit number is not net profit
There is no general-ledger connection, so rent, payroll, software, and insurance never enter the math. What you see is contribution margin, which is revenue minus variable costs.
That gap matters when you are deciding whether to take on inventory. A brand can look profitable on the dashboard and still be short on cash, which is why cash flow forecasting belongs next to your margin reporting.
⏰ Ceiling four: refresh cadence
Data updates every few hours, and Amazon updates once per day. If you make intraday spend decisions, that lag rules it out.
✅ Who should stay
Stay on Lifetimely if you are Shopify-only, between roughly $50K and $300K in monthly revenue, and need line-item P&L with CAC payback math. Below about $30K per month, a spreadsheet still wins on return.
Cracks tend to appear past $5M in annual revenue, when churn prediction and non-Shopify channels enter the picture. I moved off manual exports late myself, so I understand the inertia.
Luca AI prices on business context rather than order count, so a Black Friday spike changes what you learn that week, not what you are billed for it. We connect Shopify, Meta, Google, Klaviyo, and your accounting stack into one model, which closes the general-ledger gap that Shopify-only tools structurally cannot. You can check the tiers on our pricing page.
Q4. What Does Redefining LTV Yourself Actually Involve? [toc=4. Redefining LTV]
Redefining LTV means controlling four inputs: the time window, the margin basis, the cohort dimension, and the treatment of returns. Published DTC benchmarks are built on contribution-margin LTV, not gross-margin LTV. Luca AI computes the margin basis from your connected cost and accounting data, so a tool default never silently decides your ratio for you.
🧮 The four inputs you should own
The time window sets how far forward you count revenue. Ninety days, twelve months, and lifetime give very different answers.
The margin basis decides what gets subtracted. The cohort dimension decides how customers are grouped. Returns treatment decides whether refunded orders still count, a detail most guides to Shopify LTV skip entirely.
⚠️ The benchmark trap nobody names
Published CFO benchmarks are explicit: use contribution-margin LTV, not gross-margin, and measure payback as first-order payback at contribution margin. Almost no comparison page checks which basis a tool actually uses.
Here is what that costs you. A brand computing on gross margin can report a 3.1:1 LTV to CAC ratio. Recompute on contribution margin, after fulfilment, returns, and payment fees, and the same brand lands near 2.2:1. Benchmarks put the median DTC brand at 2.4:1 against a 3:1 target.
📉 Gross margin hides the costs of selling
Gross margin tells you what it costs to make the thing. It says nothing about what it costs to sell the thing, a distinction we break down in contribution margin versus gross margin.
A skincare founder I know had a hero SKU invoiced at 72% gross margin. Costed line by line, true contribution margin came to 8%. One driver was support load: that single product generated 42% of all tickets, which worked out to $1.45 per unit.
🔄 The reversal worth reading
Andrew Faris has grown ecommerce brands since 2014 and ran strategy at Common Thread Collective. In 2026, he published an episode titled "I Was Wrong About LTV In DTC Businesses," reframing the decision around CAC, AOV, and total contribution margin.
My read is that he is largely right. If the metric itself is under revision, buying a tool with a frozen formula is the wrong bet.
🎯 Predictive LTV is a model, not a fact
Blended predictive LTV averages away the decision. Median 12-month LTV runs $148 in apparel, $187 in beauty, and $263 in supplements. One number across a mixed catalog tells you nothing actionable, which is the case for segment-level customer analysis instead.
Operators notice when the model misses. The candid version of this complaint appears in reviews, and the honest response is to inspect the assumptions rather than trust the output.
"Mobile limitations and the platform isn't a plug-and-play solution, it requires time and effort to learn its advanced features and capabilities." Charlene R., Head of Operations, HR & Culture, 5/5, Polar Analytics G2 Verified Review
I assumed frequency was the main LTV lever. Get people buying more often, and lifetime value rises.
One operator's data said otherwise. Product category diversity was the stronger driver, and customers who added body care jumped 50% to 100% in LTV. I might be over-reading a single dataset, so test it on yours before you rebuild a merchandising plan.
Luca AI traces which cohort attribute is driving an LTV shift, rather than returning the metric you already knew to ask for. That is the difference between a chart and an answer, and it is the whole reason definition control sits at the top of our rubric. If you want to see that on your own numbers, tell us what you are building.
Q5. How Should You Define CAC Now That Blended CAC Has Risen 32%? [toc=5. Redefining CAC]
Treat CAC as a variable cost inside unit economics, not a marketing line item. Median blended CAC is projected to reach $58 by Q3 2026, up from $44 a year earlier across 6,800 Shopify brands. Luca AI monitors that ratio continuously and alerts you on breach, so payback drift gets caught in-month rather than at quarter close.
💸 CAC is a variable cost, full stop
If you must spend money to acquire a customer before you can sell that unit, that spend is variable. Leaving it out of unit economics produces decisions built on a number that does not exist.
Most operators still park CAC in a marketing budget line. Then they compute gross margin per unit, feel good, and wonder why cash keeps tightening, which is exactly the pattern we unpack in our guide to ecommerce profit margins.
📊 The 2026 benchmarks you are actually competing against
2026 DTC CAC and Payback Benchmarks
Metric
Top performers
Median
Bottom
CAC payback (first-order, contribution margin)
Under 3 months
6 to 9 months
Over 12 months
LTV to CAC ratio
Above 5:1
2.5:1 to 3.5:1
Below 2:1
Blended CAC (DTC, 2026)
Varies by AOV
$70 to $115
Varies by AOV
Sources: CFO benchmark set for payback and ratio bands, aggregated 2026 DTC benchmarks for blended CAC.
Two numbers matter most here. Median payback stretched to 9.4 months in 2025, from 5.8 months in 2020. Anything past 12 months gets flagged in private-equity diligence.
⚠️ Why channel ROAS keeps lying to you
Channel-reported ROAS is a platform's self-assessment of its own work. It also ignores every cost that sits between the click and the settled order, a gap we cover in declining platform ROAS versus true profitability.
Nick Shackelford has said a version of this for years: you have to look beyond ROAS, because ROAS on its own does not exist as a business number. My read is that blended MER plus contribution margin is the honest replacement. MER means marketing efficiency ratio, total revenue divided by total ad spend.
✅ The allocation rule to adopt this week
Pick one rule and apply it consistently across every channel. Total paid acquisition spend, divided by new customers only, not total orders.
Then verify your tool actually does that. Ask Luca AI to rebuild your CAC using new-customer orders only, then compare it against the figure your current dashboard reports. If the two disagree by more than 10%, you have been budgeting on the wrong number, which is a common finding in AI marketing analytics work.
🤔 Where operators legitimately disagree
Not everyone agrees on including creative production, agency retainers, or affiliate commissions. Some argue those are fixed costs, and at low spend levels that is defensible.
I lean toward including anything that scales with acquisition volume. I could be too aggressive here, and if your creative team is salaried and fixed, the case for excluding it is stronger.
⏰ Enforcement beats definition
A correct CAC definition that gets recalculated once a quarter is nearly useless. Shipping rates move, return rates shift with seasons, and platform costs climb.
Luca AI pushes the weekly CAC report to Slack or email with the reasoning attached, including Meta and Google spend and your chosen attribution basis. That turns the allocation rule into a habit instead of an annual argument, which is what automated data reporting is actually for.
Luca AI enforces the definition you set rather than the one a vendor shipped, which is the practical difference between measuring CAC and managing it. That matters more in 2026 than it did in 2021, because a 32% CAC increase punishes a wrong formula much faster.
Q6. Which Replacement Fits Your Stage, Platform and Budget? [toc=6. Choosing By Stage]
Peel Insights and RetentionX are direct swaps replicating cohort and LTV reporting. Triple Whale and Northbeam are category changes solving attribution, not LTV. Daasity is infrastructure. Luca AI is a category change from dashboards to reasoning. Below roughly $30K in monthly revenue, a spreadsheet still beats every tool here on return.
🔀 Four kinds of replacement, not one
Picking the wrong category is the expensive mistake at this stage. You end up paying more to solve a problem you never had.
Direct swap: Peel Insights, RetentionX, BeProfit, TrueProfit, Sellerboard
Category change (reasoning): Luca AI, which answers questions across sources rather than shipping a fixed dashboard
Infrastructure change: Daasity, Polar Analytics with warehouse access
📈 Stage boundaries that actually hold
Which Replacement Fits Your Revenue Stage
Stage
What to do
Why
Under $30K/mo
Buy nothing yet
A spreadsheet wins on return at this volume
$50K to $300K/mo
Direct swap or a reasoning layer
Line-item P&L and payback math are the real need
Past $5M/year
Category change
Churn prediction and non-Shopify channels appear
$15M+ omnichannel
Infrastructure
Retail and wholesale data need modeling
Analytics tools are a speedometer. They tell you how fast you are going. A reasoning layer behaves more like navigation, which is why Luca AI is priced and positioned against dashboards rather than against attribution pixels. That difference is the core of the ecommerce business intelligence shift underway right now.
💰 Three pricing models, three different punishments
Order-volume pricing punishes your best month. A BFCM spike from 1,500 to 3,000 orders moves you a tier, with no single-month opt-out.
GMV-based pricing punishes growth itself. Polar runs $720 to $7,970 per month on that model, plus a $3,200 incrementality add-on. Flat pricing is the only structure that survives a spike unchanged, which is why Luca AI holds at €299 and €499 regardless of your order count.
"Sometimes the data takes time to update, and some ratios are more difficult to understand." Juliette P., CEO, 4.5/5, Polar Analytics G2 Verified Review
🔌 Platform routing, decided in one line
WooCommerce or BigCommerce: BeProfit, Daasity, or RetentionX support non-Shopify carts
Amazon-first: Sellerboard, because FBA fees need native handling
Headless: Warehouse-based options only, since app-store tools assume a storefront
Shopify plus accounting: Ask Luca AI to blend Xero or QuickBooks data with orders, which app-store profit tools cannot reach
Connector gaps are the most common post-purchase regret I hear. Check yours before you sign anything, and map them against your wider ecommerce tech stack first.
Fixating on a single number is like studying a painting through a magnifying glass fixed on one square inch. You miss how the parts interact.
That is the real argument for a cross-functional view. Luca AI reasons across ad spend, orders, inventory, and accounting in one pass, which is where the interactions between metrics actually live. If you are still choosing between point tools, our roundup of AI tools for Shopify owners covers the trade-offs.
Luca AI sits in the category-change column and says so plainly. An operator running 400 orders a month who only needs cohort reporting should buy the cheaper swap, and I would rather tell you that here than after you pay us.
Q7. How Do You Run the Definition Audit and Migrate Without Losing History? [toc=7. Audit and Migration]
Write down your current LTV window, margin basis, CAC allocation, and payback basis, then check whether your tool computes them that way or a vendor chose for you. Compare the result against contribution-margin benchmarks. Luca AI normalizes and standardizes data on ingestion, which removes the schema cleanup that usually stalls a migration. Export at least 24 months of order history before cancelling anything.
🧾 The seven-step sequence
Run the definition audit. Write down four things: LTV window, margin basis, CAC allocation rule, and payback basis. Then find where your current tool documents each one. If you cannot find it, that is your answer.
Export 24 months of order history. Do this before you touch billing. Orders, line items, refunds, and costs, as raw CSV. Most tools do not hand history back after cancellation.
Normalize the schema. Retail week conventions are the quiet killer here. One system uses a 5-5-4 calendar, another uses 4-4-5, and cohort math silently breaks. Ask Luca AI to reconcile the calendar conventions across sources before you compare any cohort.
Run both tools in parallel for one full month. Not two weeks. You need a complete billing cycle, a full ad cycle, and at least one return wave.
Set your alert thresholds. Pick three: CAC breach, ROAS dip, and inventory floor. Luca AI scans continuously and pings Slack or email when one trips, so nobody has to remember to check.
Hold the first monthly unit-economics review. Thirty minutes, calendar invite, recurring. Recompute contribution margin per SKU, then compare against the benchmark bands.
Decide on cancellation. Only after the parallel month closes and the numbers reconcile within 10%.
⏰ Why the monthly cadence is the real deliverable
The audit is not a one-time exercise. Unit economics move because shipping rates rise, return rates shift with seasons, and supplier terms change.
A definition that was right in January and never revisited is just a stale opinion by July. Luca AI runs the recalculation on a schedule and sends the reasoning with it, which is how the discipline survives a busy quarter. Treat it as part of your ecommerce reporting rhythm, not a side project.
💸 What the cleanup year actually costs
Most operators I talk to have lived in exports. Shopify exports, returns-system exports, then a spreadsheet holding it together at 11pm on Sunday.
Richie Jones scaled to £200 million in GMV and describes starting exactly there, with most of the business tied up in manual reporting tools. The work that used to take two weeks of data manipulation now runs in about 90 seconds. That is the single biggest change in this category since 2023, and it is why agentic AI for ecommerce founders stopped being a novelty.
🤔 What I am still unsure about
I do not know how far predictive LTV can be trusted at low order volumes. Below roughly 500 orders a month, the models get noisy and confidence intervals widen.
My current view is that under that threshold you should use historical cohorts only and treat predictions as directional. Luca AI shows the underlying cohort data alongside any forecast for that reason, though I might be more conservative here than the math strictly requires. If you want the deeper version, read our take on predictive analytics for ecommerce.
If you run the audit and the four numbers come back different from what your dashboard reports, I genuinely want to hear which one broke. That gap is the most interesting thing in DTC measurement right now, and I do not think anyone has mapped it properly yet.
FAQ's
What are the best Lifetimely alternatives in 2026?
The answer depends on which ceiling you hit, not on which tool ships the most reports. We ranked ten options and grouped them by the job they actually solve.
Reasoning layer: Luca AI, for plain-English LTV and CAC on definitions you set yourself
Attribution: Triple Whale and Northbeam, which solve channel credit rather than cohort depth
Direct cohort swaps: Peel Insights and RetentionX
Infrastructure: Daasity and Polar Analytics with warehouse access
Budget profit trackers: BeProfit, TrueProfit, and Sellerboard
Luca AI ranks first on our rubric because it is the only option that lets you edit the LTV window, the margin basis, and the cohort dimension without SQL or a support ticket. Every other tool on the list ships a fixed formula.
Be honest about your stage before you buy. Under roughly $30K in monthly revenue, a spreadsheet still wins on return. Between $50K and $300K per month, a direct swap or a reasoning layer is usually enough. Past $5M in annual revenue, churn prediction and non-Shopify channels push you toward a category change. If you want to see how the reasoning layer differs from another dashboard, our use cases page walks through real operator workflows.
Why do Shopify operators actually leave Lifetimely?
Not because it is a weak product. Lifetimely holds a 4.8 to 4.9 rating across roughly 490 Shopify App Store reviews, with about 97% at five stars, and sits at 4.6 on G2. Operators leave for architectural reasons.
Order-volume pricing: a Black Friday spike from 1,500 to 3,000 monthly orders moves you a tier, with no single-month opt-out. Agencies pay per store, so the problem compounds.
Shopify-only: no WooCommerce, BigCommerce, or headless support. Amazon arrives through a $75 per month add-on that refreshes once daily.
No general ledger: without a QuickBooks or Xero connection, rent, payroll, software, and insurance never enter the math. The dashboard figure is contribution margin, not true net profit.
Refresh cadence: data updates every few hours, which rules it out for intraday spend decisions.
Stay on Lifetimely if you are Shopify-only, between roughly $50K and $300K in monthly revenue, and need line-item profit and loss with CAC payback math. Cracks appear past $5M in annual revenue. Luca AI prices on business context rather than order count, so a peak month changes what you learn that week instead of what you are billed. Compare that against your wider ecommerce tech stack before switching anything.
Is there a free Lifetimely alternative worth using?
Yes, though free tiers here are entry ramps rather than complete tools.
Lifetimely itself offers a genuine free plan for stores under 50 monthly orders, not a trial.
Triple Whale ships a free Founders Dash with basic benchmarking, useful under $1M GMV.
BeProfit runs a free plan for very small storefronts before paid tiers start at $49 per month.
TrueProfit starts at $35 per month, with per-order overage fees above your cap.
Sellerboard is the cheapest paid option at roughly $19 per month, built Amazon-first.
Here is the honest version. If you are running under roughly 400 orders a month and only need one profit number, a free tier plus a spreadsheet genuinely beats paying for anything on this list. The moment you need cohort slicing by discount code, campaign source, or first product purchased, free tiers stop working.
Luca AI does not compete at the free tier and we say so plainly, because an operator at that volume does not yet have enough data to reason against. When your order history gets deep enough to matter, our guide to tracking unit economics covers what to measure first.
What does it mean to redefine LTV and CAC yourself?
It means controlling four inputs instead of accepting a vendor's defaults: the time window, the margin basis, the cohort dimension, and how returns are treated.
The margin basis is where most brands quietly lose the plot. Published CFO benchmarks are explicit that LTV should be computed on contribution margin, not gross margin, and that payback should be measured as first-order payback at contribution margin. A brand reporting a healthy 3.1:1 LTV to CAC on gross margin often lands near 2.2:1 once fulfilment, returns, and payment fees come in. The median DTC brand sits at 2.4:1 against a 3:1 target.
On CAC, the rule we recommend is simple: total paid acquisition spend divided by new customers only, never total orders. Then verify your tool applies it. If your rebuilt number and your dashboard number disagree by more than 10%, you have been budgeting against fiction.
Luca AI computes the margin basis from your connected cost and accounting data, so a default never silently decides your ratio for you. The distinction matters enough that we wrote a full breakdown of contribution margin versus gross margin for exactly this decision.
How do you switch tools without losing your cohort history?
Run a definition audit first, then migrate in a fixed sequence. Rushing the export is how brands lose two years of cohort history permanently.
Audit your definitions: write down your LTV window, margin basis, CAC allocation rule, and payback basis, then find where your current tool documents each one.
Export 24 months of history before you touch billing. Orders, line items, refunds, and costs as raw CSV. Most tools do not return history after cancellation.
Normalize the schema. Retail week conventions break cohort math silently when one system uses a 5-5-4 calendar and another uses 4-4-5.
Run both tools in parallel for one full month, not two weeks. You need a complete billing cycle, ad cycle, and at least one return wave.
Set three alert thresholds: CAC breach, ROAS dip, and inventory floor.
Cancel only once the parallel month reconciles within 10%.
Luca AI normalizes and standardizes data on ingestion, which removes the schema cleanup that usually stalls a migration for weeks. Work that used to take two weeks of manual data manipulation now runs in about 90 seconds. Treat the recalculation as a monthly habit, the way we frame ecommerce reporting rather than a one-off project.
Enjoyed the read? Join our team for a quick 15-minute chat — no pitch, just a real conversation on how we’re rethinking Ecommerce with AI - Luca
Loading Schedule...
Your AI Co-Founder is here.
Here’s why:
Shopify, Meta, Xero - one brain.
"Should I scale?" Answered with real data.
Growth capital. No applications. One click.
Thank you! Your submission has been received! Please book a time slot for the Meeting
Oops! Something went wrong while submitting the form.