AI Marketing Analytics for Ecommerce: Tools covering Attribution, Forecasting, Creative Intelligence, and Customer Analytics
13
mins read
In this article
TL;DR
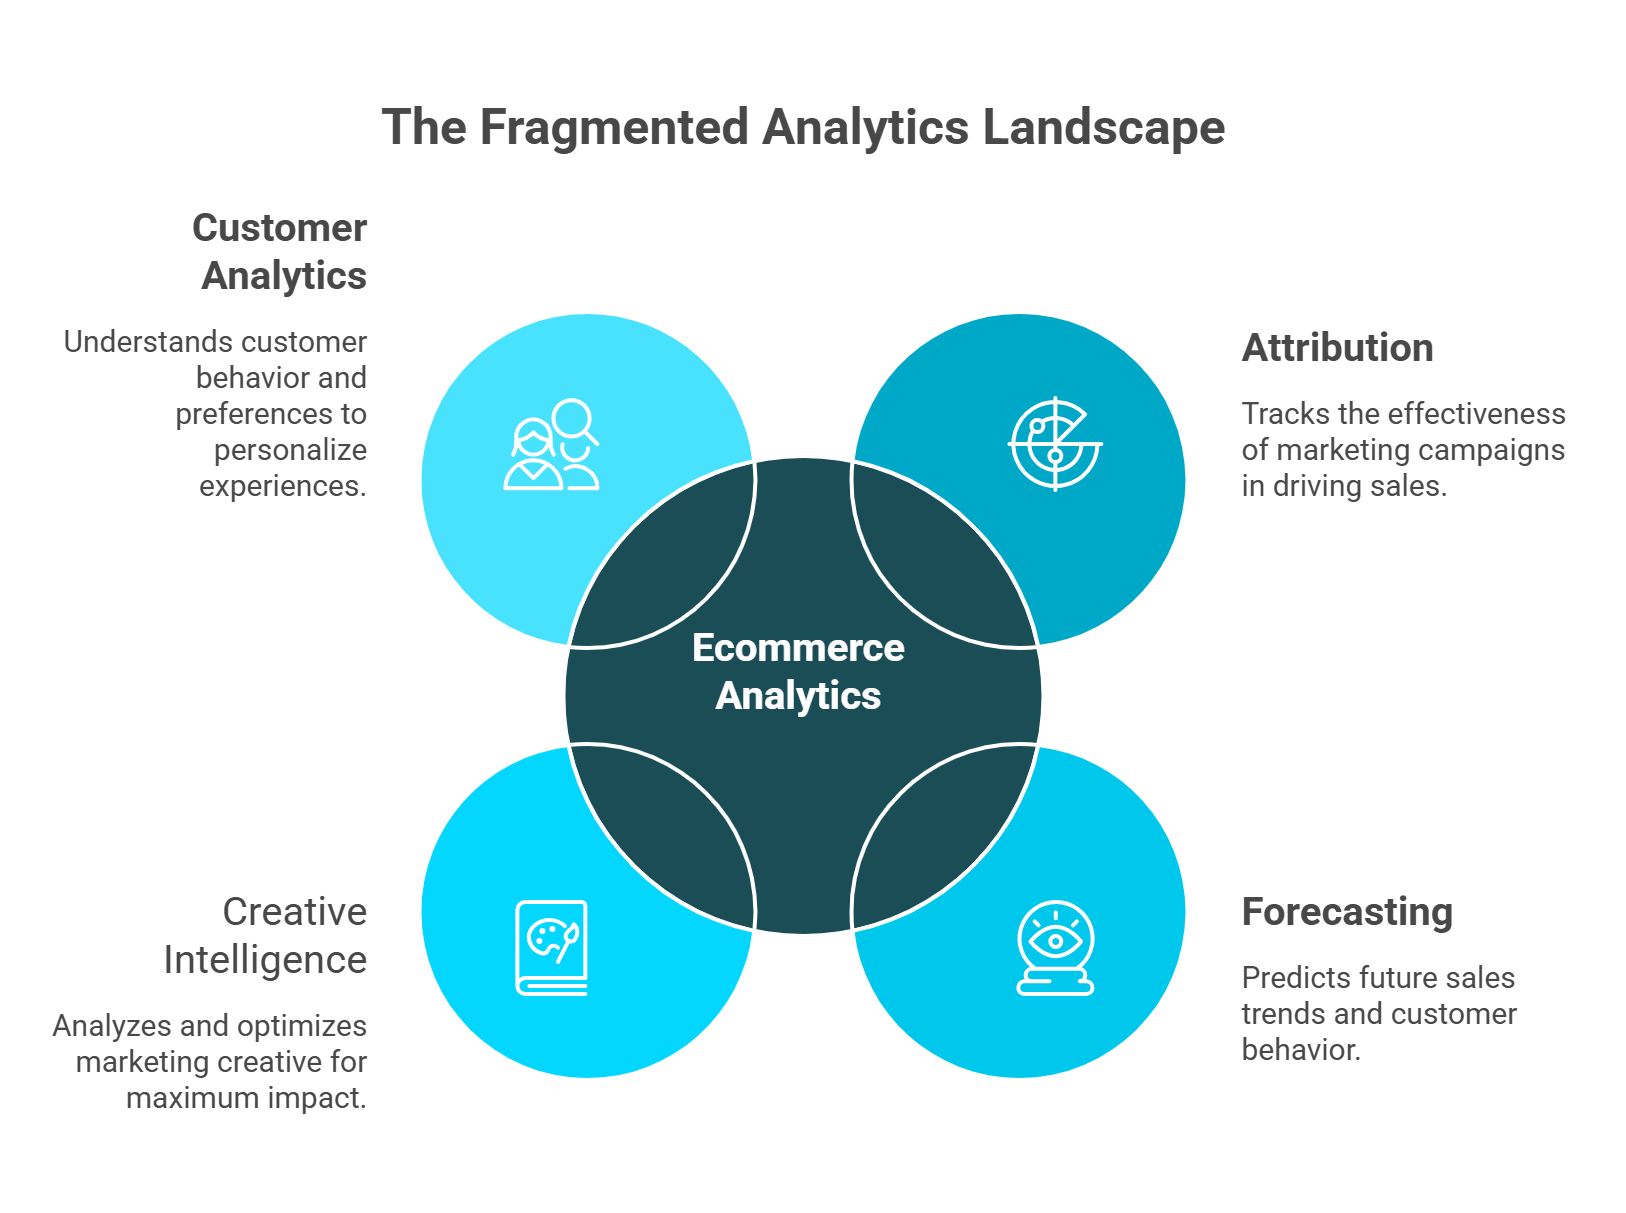
The AI ecommerce analytics market clusters into four pillars: attribution, forecasting, creative intelligence, and customer analytics, but most tools cover only one or two.
Attribution numbers from Triple Whale, Northbeam, and GA4 never reconcile because each uses different methodology and different definitions of revenue and conversion.
Predictive forecasting tools project LTV and demand in isolation, disconnected from cash flow reality, meaning you can forecast growth you cannot financially sustain.
Creative intelligence is the most under-invested category, with no tool connecting ad creative performance to downstream customer profitability and cohort quality.
Brands typically pay for 3 to 5 overlapping tools covering attribution and cohorts while financial analytics, cross-functional reasoning, and proactive intelligence go entirely uncovered.
Enterprise brands like Amazon, Gymshark, and ASOS solved fragmentation by building unified analytics internally; Luca AI delivers equivalent cross-functional intelligence to mid-market brands through a single conversational interface.
Six systematic gaps persist across the industry: cross-functional reasoning, creative-to-revenue linkage, insight-to-action execution, incrementality measurement, real-time financial modeling, and proactive intelligence.
A 7-criteria evaluation framework (cross-functional access, data consistency, time-to-insight, TCO, action capability, platform coverage, intelligence architecture) reveals best-of-breed stacks score 4/14 vs. unified platforms at 14/14.
Q1: What Does the AI Marketing Analytics Landscape Actually Look Like for Ecommerce in 2026? [toc=AI Analytics Landscape 2026]
The AI marketing analytics market for ecommerce has expanded to over 50 tools, but strip away the vendor marketing and they cluster into four distinct capability categories: attribution, forecasting, creative intelligence, and customer analytics. Most founders don't realize these categories exist separately because every platform markets itself as "all-in-one analytics." The reality is far more fragmented.
The Four Pillars and Who Plays Where
AI Marketing Analytics Categories for Ecommerce in 2026
Category
What It Solves
Leading Tools
✅ Unified / Cross-Functional
Spans all four pillars + financial data in one reasoning layer
Why Specialization Creates the Fragmentation Problem
Most tools specialize in one, occasionally two, of these categories. Triple Whale handles attribution and some forecasting but has no creative intelligence layer. Motion delivers creative analytics but cannot connect those insights to customer LTV data. Klaviyo excels at retention analytics but is blind to ad attribution.
The downstream effect: a typical 1M+ ecommerce brand runs 8 to 12 disconnected tools, including Shopify for commerce, Meta Ads Manager for acquisition, GA4 for web behavior, Klaviyo for email, Xero for accounting, and spreadsheets as the integration layer holding it all together.
Most ecommerce brands operate four disconnected analytics categories with spreadsheets as the only integration layer. Luca AI replaces manual reconciliation with a unified reasoning engine that connects all four pillars plus financial and commerce data.
How Enterprise Brands Solved This and Why Mid-Market Can't Replicate It
Amazon, Walmart, and ASOS each invested hundreds of millions building proprietary unified analytics engines internally, systems that connect marketing signals to supply chain data to financial forecasting in real time. Gymshark built a custom data warehouse integrating marketing and financial data before scaling past £500M.
Mid-market DTC brands, the 1M to 100M range, don't have this luxury. They're left stitching together point solutions with manual CSV exports and spreadsheet reconciliation, spending 10 to 15 hours a week just assembling a picture of business health that enterprise competitors see automatically. If you're experiencing this data overload without clarity, you're not alone.
Where Luca AI Sits in This Landscape
Luca AI is the only platform currently designed to span all four analytics pillars, attribution context, forecasting, creative performance signals, and customer analytics, plus financial and operational data from Shopify, Meta, Google Ads, Stripe, and Xero, all accessible through a single conversational interface. It gives mid-market brands the cross-functional intelligence that enterprises built internally, without the engineering team or seven-figure BI investment.
Q2: How Do AI Attribution Tools Work for Ecommerce and Where Do They Fall Short? [toc=Attribution Tools Shortcomings]
It's 9 PM on a Tuesday. You've got Meta Ads Manager open in one tab claiming 100K in attributed revenue. Shopify is open in another, showing 60K in actual orders. Google Analytics, in a third tab, claims credit for the same conversions Meta does. You've been at this for two hours, and the numbers will never reconcile. This is the daily reality of ecommerce attribution in 2026.
Why Attribution Numbers Never Match
The root cause is structural, not technical. Every ad platform practices self-attribution bias. Meta, Google, and TikTok each take credit for every conversion they touched, even when the customer interacted with all three before purchasing. Layer on these compounding issues:
⚠️ Cookie deprecation post-iOS 14.5: Apple's App Tracking Transparency eliminated up to 40% of trackable signals for Meta advertisers
⚠️ Cross-device identity gaps: a customer who discovers your product on mobile and purchases on desktop appears as two separate users
⚠️ Click-based vs. impression-based model mismatch: Google counts clicks while Meta counts 1-day view-throughs, creating phantom overlap
Every ad platform practices self-attribution bias, each claiming full credit for shared conversions. One customer journey can generate 255K in combined platform claims against 60K in actual orders, which is why attribution numbers never reconcile.
Tools like Triple Whale (proprietary pixel + server-side tracking), Northbeam (statistical multi-touch modeling), and Cometly (server-side attribution) each attempt different solutions to this problem. But they all operate within the same architectural constraint: they live inside the marketing data silo.
The Hidden Cost of Misattribution
Misattribution doesn't just create reporting headaches. It drives real budget waste:
💸 20 to 30% budget misallocation when platforms over-claim credit for shared conversions
⏰ Delayed scaling decisions on genuinely winning campaigns because the data lacks confidence
❌ Over-investment in last-click channels that claim inflated credit while top-of-funnel discovery channels get starved
Real users confirm this frustration. One multi-channel seller described their Triple Whale experience:
"Broken Integrations & Fake Attribution for External Marketplaces. Since day one, the data has been inaccurate. Daily revenue totals are wrong, entire order blocks are missing... Triple Whale shows orders from external marketplaces as if they were real conversions even though these orders never go through our Shopify store and could not possibly be tracked." -XTRA FUEL Trustpilot Verified Review
"It has been unable to deliver on the promise to provide any insights or accurate data to our business, and we end up reverting back to direct data sources like Meta, Shopify, Recharge, etc." -Matt Huttner Trustpilot Verified Review
GA4 faces similar trust issues. A verified retail user noted:
"It is becoming very opaque, it doesn't have real-time, the sampling is increasingly wild... it's really difficult to trust it 100% and it complicates decision-making." -Verified User in Retail, Mid-Market G2 Verified Review
What Attribution Should Actually Deliver
The ideal system doesn't just re-attribute clicks across channels. It connects attribution data to actual revenue, true contribution margins, and business-level profitability, answering "Which campaign drove profitable growth?" not just "Which campaign got the last click?" Understanding your true profitability beyond platform-reported ROAS is essential.
How Luca AI Approaches Attribution Differently
Luca AI connects attribution signals to financial outcomes across Shopify, Meta, Google, Stripe, and Xero simultaneously. When you ask "What's my true ROAS on Campaign X?", the answer includes actual margins, fulfillment costs, and operational overhead, not just the platform-reported revenue figure that every other attribution tool stops at. This is the foundation of Luca AI's marketing analysis capability.
Q3: What Can Predictive Marketing Analytics Actually Forecast and What Remains Guesswork? [toc=Predictive Analytics Limits]
Predictive marketing analytics for ecommerce falls into four distinct applications, each powered by different machine learning approaches and serving different operational decisions:
Customer LTV prediction: uses purchase frequency models (BG/NBD, Pareto/NBD) to estimate future revenue per customer
Churn probability scoring: applies survival analysis to flag customers likely to lapse before they disappear
Demand and inventory forecasting: relies on time-series models (ARIMA, Prophet) to project unit demand by SKU
Revenue projection: models future revenue based on ad spend efficiency, seasonality, and historical growth patterns
Which Tools Cover What
Predictive Analytics Coverage by Tool
Tool
LTV Prediction
Churn Scoring
Demand Forecasting
Revenue Projection
Cross-Functional
Luca AI
✅
✅
✅
✅
✅ Connects to financial + operational data
Peel
✅ Cohort-based
◐ Retention curves
❌
◐
❌
Daasity
◐
◐
✅ Multi-channel
✅
❌
Klaviyo
✅ Predictive LTV
✅ Next-purchase probability
❌
❌
❌
Triple Whale
◐
❌
❌
✅ Ad-spend based
❌
Northbeam
❌
❌
❌
✅ Incrementality-based
❌
The Accuracy Problem Nobody Talks About
Predictive models for mid-market ecommerce are only as good as their data inputs, and almost every tool forecasts within a single domain silo. Klaviyo can predict which customers will churn, but it has no visibility into whether your marketing budget can fund the win-back campaigns needed to retain them. Triple Whale can project revenue based on ad spend modeling, but it cannot tell you whether you have the cash runway to sustain that spend level for the next 90 days.
Enterprise players like Target and Walmart succeed at predictive analytics precisely because their systems unify demand signals across marketing, supply chain, and finance departments. Their models answer cross-functional questions, "If holiday demand increases 30%, do we have the inventory and cash position to fulfill it?", that no mid-market point solution can touch. Accurately tracking your unit economics is a prerequisite for any forecast to be actionable.
The Critical Gap: Marketing Forecasts Disconnected from Financial Reality
This is the largest unaddressed opportunity in ecommerce analytics. You can predict that a customer cohort will have 3x LTV. You can forecast that scaling Meta spend 40% will drive a proportional revenue increase. But no standalone forecasting tool can model whether you have the working capital to finance the 90-day payback period required to acquire those high-LTV customers in the first place. If you're navigating this challenge, understanding how to forecast cash flow for ecommerce is critical.
You can predict 3x LTV and project 40% revenue growth from scaling Meta spend. But no standalone forecasting tool can tell you whether you have the working capital to survive the 90-day payback period required to acquire those customers.
How Luca AI Bridges the Forecasting-to-Finance Gap
Luca AI connects marketing forecasts to cash flow projections and operational capacity within the same data model. Ask "What's my projected LTV for August Meta cohorts?" and "Can I sustain the acquisition cost for the next 90 days?" and get both answers in a single query, calculated against your live Shopify, Stripe, and Xero data. This is the core of Luca AI's financial management capability.
Q4: Is Creative Intelligence the Most Under-Invested Category in Ecommerce Analytics? [toc=Creative Intelligence Gap]
Most ecommerce brands treat creative as a production problem, make more ads, test more hooks, ship more variants, rather than an analytics problem. The average DTC brand producing 50 to 200 ad creatives per month has almost no systematic framework for understanding why some creatives drive revenue and others burn budget. The analysis typically stops at comparing CTR and CPC inside Meta Ads Manager, metrics that measure attention, not business outcomes.
The "Rear-View Mirror" Problem in Creative Analytics
Current tools fall into two camps, both with significant limitations:
Platform-native metrics (Meta Ads Manager, TikTok Ads): give you surface-level engagement data (CTR, CPC, thumbstop rate) per creative, but cannot tell you whether the customers those creatives attract are actually profitable over time
Dedicated creative analytics platforms (Motion, Neurons, AdCreative.ai): offer deeper analysis. Motion auto-tags creative assets with AI to identify winning patterns across hooks, formats, and visual elements. Neurons predicts attention using neuroscience-backed models. AdCreative.ai generates AI-optimized variants
❌ None of these tools connect creative performance to downstream business outcomes. A creative that drives a 4% CTR but attracts customers with a 30-day churn rate is destroying value, not creating it.
The New Wave: AI-Powered Creative Intelligence
AI is enabling an entirely new analytical layer that barely existed 18 months ago:
Automated fatigue detection: flags when a creative's performance is decaying before it tanks your ROAS
Element-level analysis: identifies which specific headlines, colors, CTAs, and hooks correlate with conversion (not just engagement)
Generative optimization: AI-produced creative variants based on statistically winning patterns from your historical data
Competitor creative tracking: monitors what competitors are running and which formats dominate in your category
Motion leads this emerging category, analyzing over $14B in media spend annually and offering AI agents that produce weekly creative performance briefs automatically. But even Motion operates within the marketing silo. It can tell you which creative won, but not which customers that creative attracted or how profitable those customers became.
The Missing Link: Creative-to-Revenue Connection
This is the gap that defines the creative intelligence category's biggest limitation. You can know that "Creative A" has the best engagement metrics. You can identify that UGC-style hooks outperform studio-shot content by 2x on CTR. But without connecting creative performance data to customer LTV, cohort behavior, and margin contribution, you're optimizing for clicks, not profit.
The creative that drives your highest-LTV customer segment might have a mediocre CTR. The creative with the best thumbstop rate might attract one-time discount buyers who never return. Without cross-referencing creative data against customer analytics and financial outcomes, these patterns remain invisible. Understanding true profitability beyond surface-level ROAS is what separates scaling brands from stagnating ones.
How Luca AI Connects Creative Signals to Business Outcomes
Luca AI's unified data model connects creative performance signals across Meta, Google, and TikTok to actual customer outcomes and financial impact in Shopify and Xero. Creative decisions get evaluated on profit contribution and customer quality, not vanity engagement metrics, because the system that sees your ad performance also sees your margins, cohort retention, and cash flow. Explore how Luca AI surfaces sales performance insights that connect creative investment to revenue outcomes.
Q5: What Does the Customer Analytics Layer Cover and Why Do Most Tools Only Show Half the Picture? [toc=Customer Analytics Gaps]
Most ecommerce customer analytics tools, Klaviyo, Peel, Amplitude, Polar Analytics, excel at segmentation and behavioral analysis but fail at connecting customer value to acquisition cost and financial capacity. You can identify your best customers. You cannot model the financial impact of acquiring more of them.
Where Customer Analytics Tools Stop Short
⚠️ Cohort analysis shows retention curves but rarely includes true CAC per cohort blended across channels. You see that your March cohort retained at 40% over 90 days, but not that it cost 48 per acquisition through Meta and 22 through Google, making the unit economics radically different depending on the source
⚠️ RFM segmentation identifies high-value segments but doesn't connect to campaign-level acquisition data. You know who your best customers are, but not which campaigns built them, making it impossible to deliberately replicate that outcome
⚠️ Journey mapping tracks behavior but ignores the financial dimension entirely. What does each journey stage cost to operate? What's the margin contribution at each touchpoint? These questions remain unanswered
⚠️ LTV projections exist in isolation from cash runway. Knowing a cohort has 3x LTV doesn't help if you can't finance the 90-day payback period to acquire more of them. A 120 LTV customer acquired at 40 CAC looks great, until you realize you need 200K in working capital to scale that acquisition before revenue materializes
The Fundamental Disconnect
The pattern across all four limitations is identical: customer analytics tools see the customer but not the business. They operate inside a behavioral data silo, powerful for understanding who your customers are and what they do, but architecturally incapable of answering the strategic question that follows: "Now that I know this, what should I do about it, and can I afford to?"
This disconnect is well-documented by practitioners. As one ecommerce operator put it on Reddit:
"As ecommerce professionals, we meticulously track every aspect of our operations, yet we often find ourselves overwhelmed by an abundance of data that lacks significance... we frequently spend hours navigating through multiple tools and spreadsheets to draw meaningful insights." -r/ecommerce Reddit Thread
Another DTC founder described the same challenge from a different angle:
"It's all swivel chair from this platform to another platform. Google ads, fb, tiktok, amazon, bing. Then we have meta analysis sheets that contain everything that's ever happened to a product." -r/ecommerce Reddit Thread
How Luca AI Closes the Customer-to-Business Gap
Luca AI unifies customer analytics with marketing attribution and financial data in a single reasoning layer. When you identify a high-LTV cohort, you can immediately trace which campaigns built it, calculate the true blended CAC across channels, and model whether scaling acquisition for that segment is operationally sustainable, all in one conversational query, without opening a spreadsheet.
Q6: How Do Data Infrastructure, Privacy, and Platform Constraints Shape What These Tools Can Actually Deliver? [toc=Data Infrastructure Constraints]
Every analytics capability described in the previous sections is only as good as the data infrastructure underneath it. Three foundational challenges determine what any AI marketing analytics tool can actually deliver: data fragmentation across siloed platforms, privacy-driven signal loss, and platform dependency that locks out non-Shopify brands.
The Data Silo Problem
The average 1M+ ecommerce brand operates 8 to 12 disconnected tools, Shopify for commerce, Meta for ads, GA4 for web behavior, Klaviyo for email, Xero for accounting, Stripe for payments. Each tool carries its own definition of "revenue," "customer," and "conversion." Shopify counts gross sales; Stripe records net after fees; Meta attributes revenue it influenced; GA4 models revenue through sampled data.
This semantic fragmentation means analytics tools inherit conflicting data before they even start analyzing. The numbers will never reconcile because they were never measuring the same thing. This is precisely why ecommerce founders are drowning in data without gaining clarity.
⚠️ Privacy and Signal Loss
Server-side tracking has become the minimum viable infrastructure for ecommerce attribution in 2026. Adoption has reached 67% among B2B companies, with data quality improving by an average of 41% after migration. Tools like Triple Whale's pixel, Cometly, and Elevar have shifted data collection from the browser to the server, bypassing ad blockers (95% bypass rate) and extending cookie lifetimes from 7 days under ITP to 90 to 400 days.
But server-side tracking only solves the data collection problem. It does not solve the data synthesis problem. You can track more events with higher fidelity and still have them siloed across disconnected tools. Layer on GDPR consent requirements (especially for EU-based brands) and CCPA regulations, and the available data narrows further, making cross-functional synthesis even more critical.
As one frustrated store owner described:
"My store's analytics tells me one story, but my actual orders tell another. My conversion rates move without a clear reason... I had to choose one reliable source of truth, Shopify in my case, and accept that the other platforms would be a bit inconsistent." -r/ecommerce Reddit Thread
The Non-Shopify Coverage Gap
The vast majority of AI analytics tools remain Shopify-centric. Brands running WooCommerce, BigCommerce, Magento, or selling primarily through Amazon face significantly fewer options:
Platform Support Matrix Across Analytics Tools
Tool
Shopify
WooCommerce
BigCommerce
Amazon
Platform-Agnostic
Luca AI
✅
✅
✅
✅
✅
Triple Whale
✅
◐ Limited
◐ Limited
❌
❌
Northbeam
✅
✅
✅
❌
◐
Peel
✅
❌
❌
❌
❌
Polar Analytics
✅
❌
❌
❌
❌
Cometly
✅
✅
✅
◐
✅
GA4
✅
✅
✅
❌
✅ (surface-level)
Triple Whale's architecture was built around Shopify, it now supports WooCommerce and BigCommerce via integrations, but the experience and depth remain Shopify-first. Peel and Polar Analytics remain Shopify-only entirely. For a deeper look at Shopify-specific options, see our guide to the best Shopify analytics apps.
How Luca AI Solves the Infrastructure Layer
Luca AI's data layer connects to commerce (Shopify, WooCommerce, BigCommerce), marketing (Meta, Google Ads, TikTok), finance (Xero, QuickBooks), and payments (Stripe), building a normalized, unified data model where "revenue" means the same thing regardless of origin. The synthesis happens at the infrastructure level, not in a spreadsheet. Learn more about how Luca AI unifies data analysis across your entire operation.
Q7: The Capability-Overlap Matrix, Where Are Ecommerce Brands Paying Twice for the Same Analytics? [toc=Capability Overlap Matrix]
One of the least-discussed problems in ecommerce analytics is redundancy. Brands pay for 3 to 5 tools that all claim to offer "attribution," "insights," or "AI-powered analytics," but the actual capability overlap means you're paying twice (or three times) for the same function while critical capabilities go uncovered entirely.
Attribution: Triple Whale, Northbeam, Cometly, and GA4 all claim multi-touch attribution, yet each uses different methodology, producing different numbers. Brands running two attribution tools aren't getting "confirmation," they're getting conflicting answers that erode confidence
Customer analytics / cohorts: Klaviyo, Peel, Amplitude, and Polar Analytics all offer cohort and segmentation analysis. Running two of these tools means paying twice for overlapping behavioral data while the financial context both lack remains absent
Dashboards and reporting: Every single tool in this matrix offers dashboards. The dashboard is the most commoditized, least differentiated feature in ecommerce analytics, yet it's the primary deliverable of most platforms
If you're evaluating whether your current ecommerce tech stack has this redundancy problem, auditing capability overlap is the first step.
❌ Where Nobody Covers: The Gap Zones
Three capability areas are nearly empty:
Financial analytics: Only Luca AI connects marketing data to accounting systems (Xero, QuickBooks) and payment platforms (Stripe). No other tool in this matrix touches financial data
Cross-functional reasoning: Requires a unified data model spanning commerce, marketing, finance, and operations. No single-category tool can build this architecture, it requires ground-up design for synthesis, not bolted-on integrations
Proactive intelligence: Most tools are reactive, you query, they respond. Klaviyo and Amplitude offer basic threshold alerts, but none continuously scan across multiple business domains to surface cross-functional opportunities and risks without being prompted
The Structural Truth This Matrix Reveals
The ecommerce analytics market is crowded where it matters least (attribution dashboards) and nearly empty where it matters most (cross-functional reasoning, financial integration, proactive intelligence). Brands assembling a best-of-breed stack end up with deep overlap in attribution and segmentation, and zero coverage of the capabilities that actually drive scaling decisions. For a comparison of leading ecommerce analytics platforms, see our detailed breakdown.
Q8: What Are the Biggest Gaps That No AI Marketing Analytics Tool Fully Solves Today? [toc=Biggest Unsolved Gaps]
After mapping what the landscape covers, what constrains it, and where it overlaps, the critical question is: what's missing? Based on analysis of current tools, verified user pain points, and architectural limitations, six systematic gaps remain unaddressed across the industry.
Gap 1: Cross-Functional Reasoning
No standalone analytics tool connects marketing performance to financial outcomes and operational capacity in real time. Triple Whale sees ad spend but not cash flow. Klaviyo sees customer behavior but not inventory constraints. GA4 sees web traffic but not contribution margins. Founders are forced to be the "manual middleware," synthesizing insights across 5+ platforms in their heads or in spreadsheets to make a single growth decision.
Gap 2: Creative-to-Revenue Linkage
Creative analytics exists (Motion, Neurons, AdCreative.ai) but isn't connected to customer LTV, margin contribution, or cohort quality data. You can identify your best-performing creative, you cannot identify whether it attracts profitable customers or discount-seekers who never return.
⚠️ Gap 3: The Insight-to-Action Chasm
Every current tool tells you what happened. Almost none can execute the response, pause a campaign, reallocate budget, generate a cross-functional report, or trigger an inventory reorder automatically. Users are left as the integration layer between insight and action. This is what separates passive dashboards from an agentic AI approach that can actually execute.
One Triple Whale user captured this frustration precisely:
"Overall it has been unable to deliver on the promise to provide any insights or accurate data to our business, and we end up reverting back to direct data sources like Meta, Shopify, Recharge, etc." -Matt Huttner Trustpilot Verified Review
Another multi-channel seller described months of unresolved data issues:
"We've been stuck in months of pointless back and forth with Triple Whale because their integration simply does not work. Since day one, the data has been inaccurate. Daily revenue totals are wrong, entire order blocks are missing." -XTRA FUEL Trustpilot Verified Review
Gap 4: Incrementality Measurement
Most attribution is correlational, not causal. True incrementality testing, holdout experiments, geo-lift studies, matched-market analysis, remains manual, expensive, and outside the scope of current tools. Brands are making multi-million-euro allocation decisions based on models that measure correlation, not causation.
💰 Gap 5: Real-Time Financial Impact Modeling
No marketing analytics tool answers the question: "If I scale this campaign 30%, what happens to my cash position, inventory needs, and operational margin over 90 days?" This question spans three domains, marketing, finance, and operations, and requires a unified data model that no single-category tool possesses. Understanding how to forecast cash flow with AI is the first step toward closing this gap.
Gap 6: Proactive Intelligence
Every current tool is reactive. You query, it responds. None continuously scan across marketing, customer, and financial data for cross-functional opportunities and risks without being prompted. A creative that's fatiguing while inventory is overstocked on the same SKU is a cross-functional signal, but no tool connects those dots automatically.
The Architectural Root Cause
These six gaps share a single origin: tools were designed to solve isolated problems within single domains. Closing them requires a system built from the ground up for cross-functional synthesis, connecting commerce, marketing, finance, and operations into one reasoning layer. This is the design premise behind Luca AI's unified intelligence architecture, where every data source feeds a single context-aware model that reasons across domains, surfaces risks proactively, and connects insights to action.
Q9: Best-of-Breed Stack or Unified Platform, How Do the Most Successful Ecommerce Brands Decide? [toc=Best-of-Breed vs Unified]
The biggest architecture decision in ecommerce analytics isn't which tool to buy, it's whether to stitch together 4 to 5 specialized tools or adopt a unified platform. The answer, overwhelmingly, points toward unification, but the path matters as much as the destination.
How Enterprise Brands Solved This Problem
Amazon built a proprietary unified analytics engine connecting marketing, supply chain, and finance into a single decision layer. Gymshark, after scaling past £500M in revenue, turned to Google Cloud to standardize what its CEO Ben Francis called a "mish-mash" of IT systems, investing in centralized data warehousing and real-time analytics to replace outdated, siloed tools. ASOS built a Centralised Marketing Dataset (CMDS) using BigQuery and Looker to unify cross-functional reporting across its entire marketing operation. The pattern is consistent: successful brands unify. The question for mid-market brands is how, without Amazon's engineering team or Gymshark's Google Cloud budget.
❌ The Wrong Way to Decide
Most founders choose tools based on feature checklists or peer recommendations. This ignores the operational cost of maintaining a multi-tool stack, the 10 to 15 hours/week of manual reconciliation, conflicting numbers between platforms, and the inability to ask questions spanning marketing + finance + operations. As one martech analysis noted: "Features impress in demos. Data flow wins in the market". If your current ecommerce tech stack was assembled tool by tool, you're likely experiencing this firsthand.
"Many retailers possess effective tools, yet these tools often fail to integrate into a single, cohesive report or perspective, leaving you without a clear understanding of what's truly effective." -u/KevinFromAdAmplify, r/ecommerce Reddit Thread
✅ The 7-Criteria Evaluation Framework
Score each approach 0 to 2 per criterion:
Cross-functional data access, Can one query span marketing + finance + operations?
Data consistency, Is "revenue" defined the same way across all views?
Time-to-insight, Seconds or hours?
Total cost of ownership, Tools + analyst time + reconciliation hours
Action capability, Can the system execute, not just report?
Platform coverage, Does it support all your commerce platforms, not just Shopify?
Intelligence architecture, AI reasoning engine vs. pre-built static dashboards
Scoring the Two Approaches
Best-of-Breed Stack vs Unified Platform Evaluation
Criterion
Best-of-Breed Stack
Unified Platform (Luca AI)
Cross-functional data access
◐ (1), Requires manual stitching
✅ (2), Native cross-domain queries
Data consistency
❌ (0), Each tool defines metrics differently
✅ (2), Unified schema
Time-to-insight
◐ (1), Hours of reconciliation
✅ (2), Seconds via conversational AI
Total cost of ownership
❌ (0), 500+/mo tools + 10 hrs/week labor
✅ (2), Flat subscription, zero reconciliation
Action capability
❌ (0), Report only
✅ (2), Execute + fund
Platform coverage
◐ (1), Shopify-centric majority
✅ (2), Shopify, WooCommerce, BigCommerce, Amazon
Intelligence architecture
◐ (1), Static dashboards
✅ (2), AI reasoning engine
Total
4/14
14/14
Luca AI scores full marks because it was architecturally designed for cross-functional synthesis, not retrofitted from a single-category analytics tool. The same unified intelligence that Amazon built for billions is now accessible through a conversational interface at a flat monthly subscription.
Q10: Is Your Marketing Analytics Stack Actually Ready, A Practical Self-Assessment [toc=Analytics Readiness Checklist]
Before you add another tool to your stack, or renew your current subscriptions, score your marketing analytics setup against these 7 readiness criteria.
Does your system connect marketing attribution to actual financial outcomes automatically (not via spreadsheet)?
Can you model cross-functional scenarios, "If I scale Campaign X by 30%, what's the cash flow and inventory impact over 90 days?"
Does your analytics proactively alert you to cross-functional risks (not just single-metric threshold breaches)?
Are your marketing, customer, and financial analytics unified in one view, or do you reconcile across 3+ dashboards?
Can your non-technical team members get complex answers without SQL, analyst dependency, or hours of manual work?
Does your analytics cover all your commerce platforms (Shopify + Amazon + WooCommerce), not just one?
⭐ Score Interpretation
Analytics Readiness Score Interpretation
Score
Assessment
Recommended Action
6 to 7 ✅
Your analytics stack is mature
Focus on optimization, not overhaul
3 to 5 ✅
Critical gaps exist
You're likely making decisions on incomplete data, consolidation should be a near-term priority
0 to 2 ✅
Fragmentation is costing you revenue
Manual processes dominate your workflow, immediate consolidation needed
Why Most Brands Score Below 5
The reality is that most scaling ecommerce brands check 2 to 3 boxes at best. Attribution tools handle box one partially, but can't connect to financial outcomes (box two). No standalone marketing tool can model cross-functional scenarios (box three). Proactive cross-domain alerts (box four) require a unified data model that point solutions can't build. And platform coverage (box seven) eliminates most Shopify-only tools for multi-channel sellers.
"Anyone else drowning in data but still making terrible decisions?" -r/ecommerce Reddit Thread
"It can be VERY hard to decipher what I am seeing. You really need your web programming team to be fully invested." -Verified User in Marketing and Advertising G2 Verified Review
✅ How Luca AI Converts Unchecked Boxes
Luca AI is purpose-built to turn every unchecked box into a ✅. Cross-functional data synthesis across 20+ sources, proactive intelligence scanning 24/7, scenario modeling that spans marketing + finance + operations, and a conversational interface accessible to every team member, no SQL, no analyst bottleneck, no platform limitations.
💰 Scored below 5? Take a free analytics gap assessment at ask-luca.com to see exactly how unified intelligence fills the holes in your current stack.
Q11: The Capability-Overlap Matrix, Where Are Ecommerce Brands Paying Twice for the Same Analytics? [toc=Capability Overlap Matrix]
One of the least-discussed problems in ecommerce analytics is redundancy. Brands pay for 3 to 5 tools that all claim to offer "attribution," "insights," or "AI-powered analytics," but the actual capability overlap means you're paying twice (or three times) for the same function while critical capabilities go uncovered entirely.
Attribution: Triple Whale, Northbeam, Cometly, and GA4 all claim multi-touch attribution, yet each uses different methodology, producing different numbers that erode rather than build confidence
Customer analytics/cohorts: Klaviyo, Peel, Amplitude, and Polar Analytics all offer cohort and segmentation analysis, running two of these tools means double-paying for overlapping behavioral data
Dashboards and reporting: Every tool in the matrix offers dashboards, the most commoditized, least differentiated feature in ecommerce analytics
If you're running multiple overlapping tools, our comparison of ecommerce analytics platforms breaks down where the real differentiation lies.
❌ The Gap Zones, Where Nobody Covers
Financial analytics: Only Luca AI connects marketing data to accounting systems (Xero, QuickBooks) and payment platforms (Stripe). This is core to Luca AI's financial management capability
Cross-functional reasoning: Requires a unified data model spanning commerce, marketing, finance, and operations, no single-category tool can build this
Proactive intelligence: Klaviyo and Amplitude offer basic threshold alerts, but none continuously scan across multiple business domains to surface cross-functional risks and opportunities without being prompted
The matrix reveals a structural truth: the ecommerce analytics market is crowded where it matters least (attribution dashboards) and nearly empty where it matters most (cross-functional reasoning, financial integration, proactive intelligence).
Q12: What Are the Biggest Gaps That No AI Marketing Analytics Tool Fully Solves Today? [toc=Biggest Unsolved Gaps]
After mapping what the landscape covers, what constrains it, and where it overlaps, the critical question is: what's missing? Based on analysis of current tools and verified user pain points, six systematic gaps remain unaddressed across the industry.
Gap 1: Cross-Functional Reasoning
No standalone analytics tool connects marketing performance to financial outcomes and operational capacity in real time. Triple Whale sees ad spend but not cash flow. Klaviyo sees customer behavior but not inventory constraints. Founders become the "manual middleware," synthesizing insights across 5+ platforms to make a single growth decision. This is why so many founders report drowning in data without gaining clarity.
Gap 2: Creative-to-Revenue Linkage
Creative analytics tools (Motion, Neurons) exist but aren't connected to customer LTV, margin contribution, or cohort quality data. You can identify your best-performing creative, you cannot identify whether it attracts profitable customers or discount-seekers who churn.
⚠️ Gap 3: The Insight-to-Action Chasm
Every current tool tells you what happened. Almost none can execute the response, pause a campaign, reallocate budget, or trigger an inventory reorder automatically. Users remain the integration layer between insight and action. The shift from passive dashboards to agentic AI is what closes this chasm.
"Overall it has been unable to deliver on the promise to provide any insights or accurate data to our business, and we end up reverting back to direct data sources like Meta, Shopify, Recharge, etc." -Matt Huttner Trustpilot Verified Review
"We've been stuck in months of pointless back and forth with Triple Whale because their integration simply does not work. Since day one, the data has been inaccurate." -XTRA FUEL Trustpilot Verified Review
Gap 4: Incrementality Measurement
Most attribution is correlational, not causal. True incrementality testing, holdout experiments, geo-lift studies, remains manual, expensive, and outside the scope of current tools. Multi-million-euro allocation decisions rest on models measuring correlation, not causation.
💰 Gap 5: Real-Time Financial Impact Modeling
No marketing analytics tool answers: "If I scale this campaign 30%, what happens to my cash position, inventory needs, and operational margin over 90 days?" This question spans three domains and requires a unified data model that no single-category tool possesses. Understanding how to forecast cash flow with AI is the first step toward closing this gap.
Gap 6: Proactive Intelligence
Every current tool is reactive. You query, it responds. None continuously scan across marketing, customer, and financial data to surface cross-functional opportunities and risks without being prompted. A creative fatiguing while inventory is overstocked on the same SKU is a cross-functional signal no tool connects automatically.
All six industry-wide gaps share one architectural root cause: tools were designed to solve isolated problems within single domains. Closing them requires a system built from the ground up for cross-functional synthesis.
The Architectural Root Cause
These six gaps share a single origin: tools were designed to solve isolated problems within single domains. Closing them requires a system built from the ground up for cross-functional synthesis, connecting commerce, marketing, finance, and operations into one reasoning layer. This is the design premise behind Luca AI's unified intelligence architecture, where the same system that identifies an opportunity can model its financial impact, recommend the action, and fund it instantly.
FAQ's
What are the main categories of AI marketing analytics tools for ecommerce in 2026?
We identify four distinct capability categories that define the AI marketing analytics landscape for ecommerce: attribution (which campaigns drive real conversions), predictive forecasting (LTV prediction, demand planning, revenue projection), creative intelligence (which ad elements drive performance and when creatives fatigue), and customer analytics (cohort analysis, RFM segmentation, retention mapping).
Attribution tools like Triple Whale and Northbeam focus on tracking campaign-level conversions but operate within the marketing silo.
Forecasting tools like Peel and Daasity predict customer value and demand but lack financial context.
Creative intelligence platforms like Motion analyze ad performance at the element level but cannot connect creative data to customer profitability.
Customer analytics tools like Klaviyo and Amplitude segment behavior but miss acquisition cost and cash flow dimensions.
Most tools specialize in one or two of these categories, leaving founders to manually reconcile insights across 8 to 12 disconnected platforms. We built Luca AI's marketing analysis layer to span all four pillars plus financial and operational data in a single reasoning engine, eliminating the manual triangulation that costs scaling brands 10 to 15 hours every week.
Why do ecommerce attribution tools like Triple Whale and Northbeam show different revenue numbers than Shopify?
We see this question constantly from founders, and the root cause is structural, not technical. Every ad platform practices self-attribution bias: Meta, Google, and TikTok each claim credit for conversions they touched, even when the customer interacted with multiple channels before purchasing. Attribution tools attempt to resolve this with proprietary pixels and statistical models, but each uses a different methodology, producing different numbers.
Triple Whale uses a proprietary pixel with server-side tracking and its own attribution model.
Northbeam applies statistical multi-touch modeling with incrementality signals.
GA4 relies on sampled, cookie-based data with default last-click attribution.
Shopify records actual completed orders at the transaction level.
The numbers diverge because they are measuring different things with different definitions of 'revenue' and 'conversion.' Running two attribution tools does not give you confirmation; it gives you conflicting answers that erode confidence. We designed Luca AI to connect attribution signals to actual financial outcomes across Shopify, Stripe, and Xero, so when we report ROAS, it reflects real margins and fulfillment costs, not platform-inflated revenue figures.
How can AI predict customer lifetime value and demand for ecommerce brands?
We break predictive marketing analytics for ecommerce into four distinct applications, each powered by different machine learning approaches. Customer LTV prediction uses purchase frequency models (BG/NBD, Pareto/NBD) to estimate future revenue per customer. Churn probability scoring applies survival analysis to flag customers likely to lapse. Demand forecasting relies on time-series models (ARIMA, Prophet) to project unit demand by SKU. Revenue projection models future income based on ad spend efficiency and seasonality.
Tools like Klaviyo offer predictive LTV and next-purchase probability. Daasity covers multi-channel demand forecasting. Triple Whale projects revenue based on ad-spend modeling. However, every tool forecasts within a single domain silo.
Klaviyo predicts churn but cannot see if your budget can fund win-back campaigns.
Triple Whale projects revenue but cannot tell you if you have 90-day cash runway to sustain that spend.
Enterprise brands like Target succeed because their systems unify demand signals across marketing, supply chain, and finance. We built Luca AI's forecasting to connect marketing predictions directly to cash flow projections and operational capacity within the same model, so you get both the forecast and the financial feasibility in one query.
Should ecommerce brands use a best-of-breed analytics stack or a unified platform?
We analyzed how the most successful ecommerce brands approach this decision, and the pattern is clear: brands that scale successfully unify their data. Amazon built a proprietary unified analytics engine. Gymshark invested in centralized data warehousing on Google Cloud after scaling past £500M. ASOS built a Centralised Marketing Dataset using BigQuery and Looker.
Mid-market brands (1M to 100M revenue) face a different reality. They cannot replicate enterprise-level data engineering, so they stitch together point solutions with CSV exports and spreadsheets. We recommend evaluating your stack against seven criteria:
Cross-functional data access across marketing, finance, and operations
Data consistency (is 'revenue' defined the same way everywhere?)
Time-to-insight (seconds or hours?)
Total cost of ownership including analyst time and reconciliation
Action capability beyond reporting
Multi-platform coverage beyond Shopify
Intelligence architecture (AI reasoning vs. static dashboards)
Best-of-breed stacks typically score high on individual depth but low on consistency, TCO, and action capability. We built Luca AI as a unified platform that scores across all seven criteria because it was designed from the ground up for cross-functional synthesis, not retrofitted from a single-category tool.
What analytics gaps do most AI marketing tools fail to solve for ecommerce?
We have identified six systematic gaps that remain unaddressed across the ecommerce analytics industry, all stemming from one architectural root cause: tools were designed to solve isolated problems within single domains.
Cross-functional reasoning: No standalone tool connects marketing performance to financial outcomes and operational capacity in real time.
Creative-to-revenue linkage: Creative analytics tools exist but are not connected to customer LTV, margin contribution, or cohort quality.
Insight-to-action chasm: Tools tell you what happened but cannot execute responses like pausing campaigns or reallocating budget automatically.
Incrementality measurement: Most attribution is correlational, not causal. True incrementality testing remains manual and expensive.
Real-time financial impact modeling: No marketing tool answers 'If I scale this campaign 30%, what happens to cash position and inventory over 90 days?'
Proactive intelligence: Every current tool is reactive. None continuously scan across marketing, customer, and financial data to surface cross-functional risks without being prompted.
Closing these gaps requires a system built for cross-functional synthesis from the ground up. We designed Luca AI's unified intelligence architecture so every data source feeds a single context-aware model that reasons across domains, surfaces risks proactively, and connects insights to action and capital.
Enjoyed the read? Join our team for a quick 15-minute chat — no pitch, just a real conversation on how we’re rethinking Ecommerce with AI - Luca
Loading Schedule...
Your AI Co-Founder is here.
Here’s why:
Shopify, Meta, Xero - one brain.
"Should I scale?" Answered with real data.
Growth capital. No applications. One click.
Thank you! Your submission has been received! Please book a time slot for the Meeting
Oops! Something went wrong while submitting the form.
.svg)
.svg)

.jpg)
.png)
.png)
.png)

.svg)
.webp)

.png)
