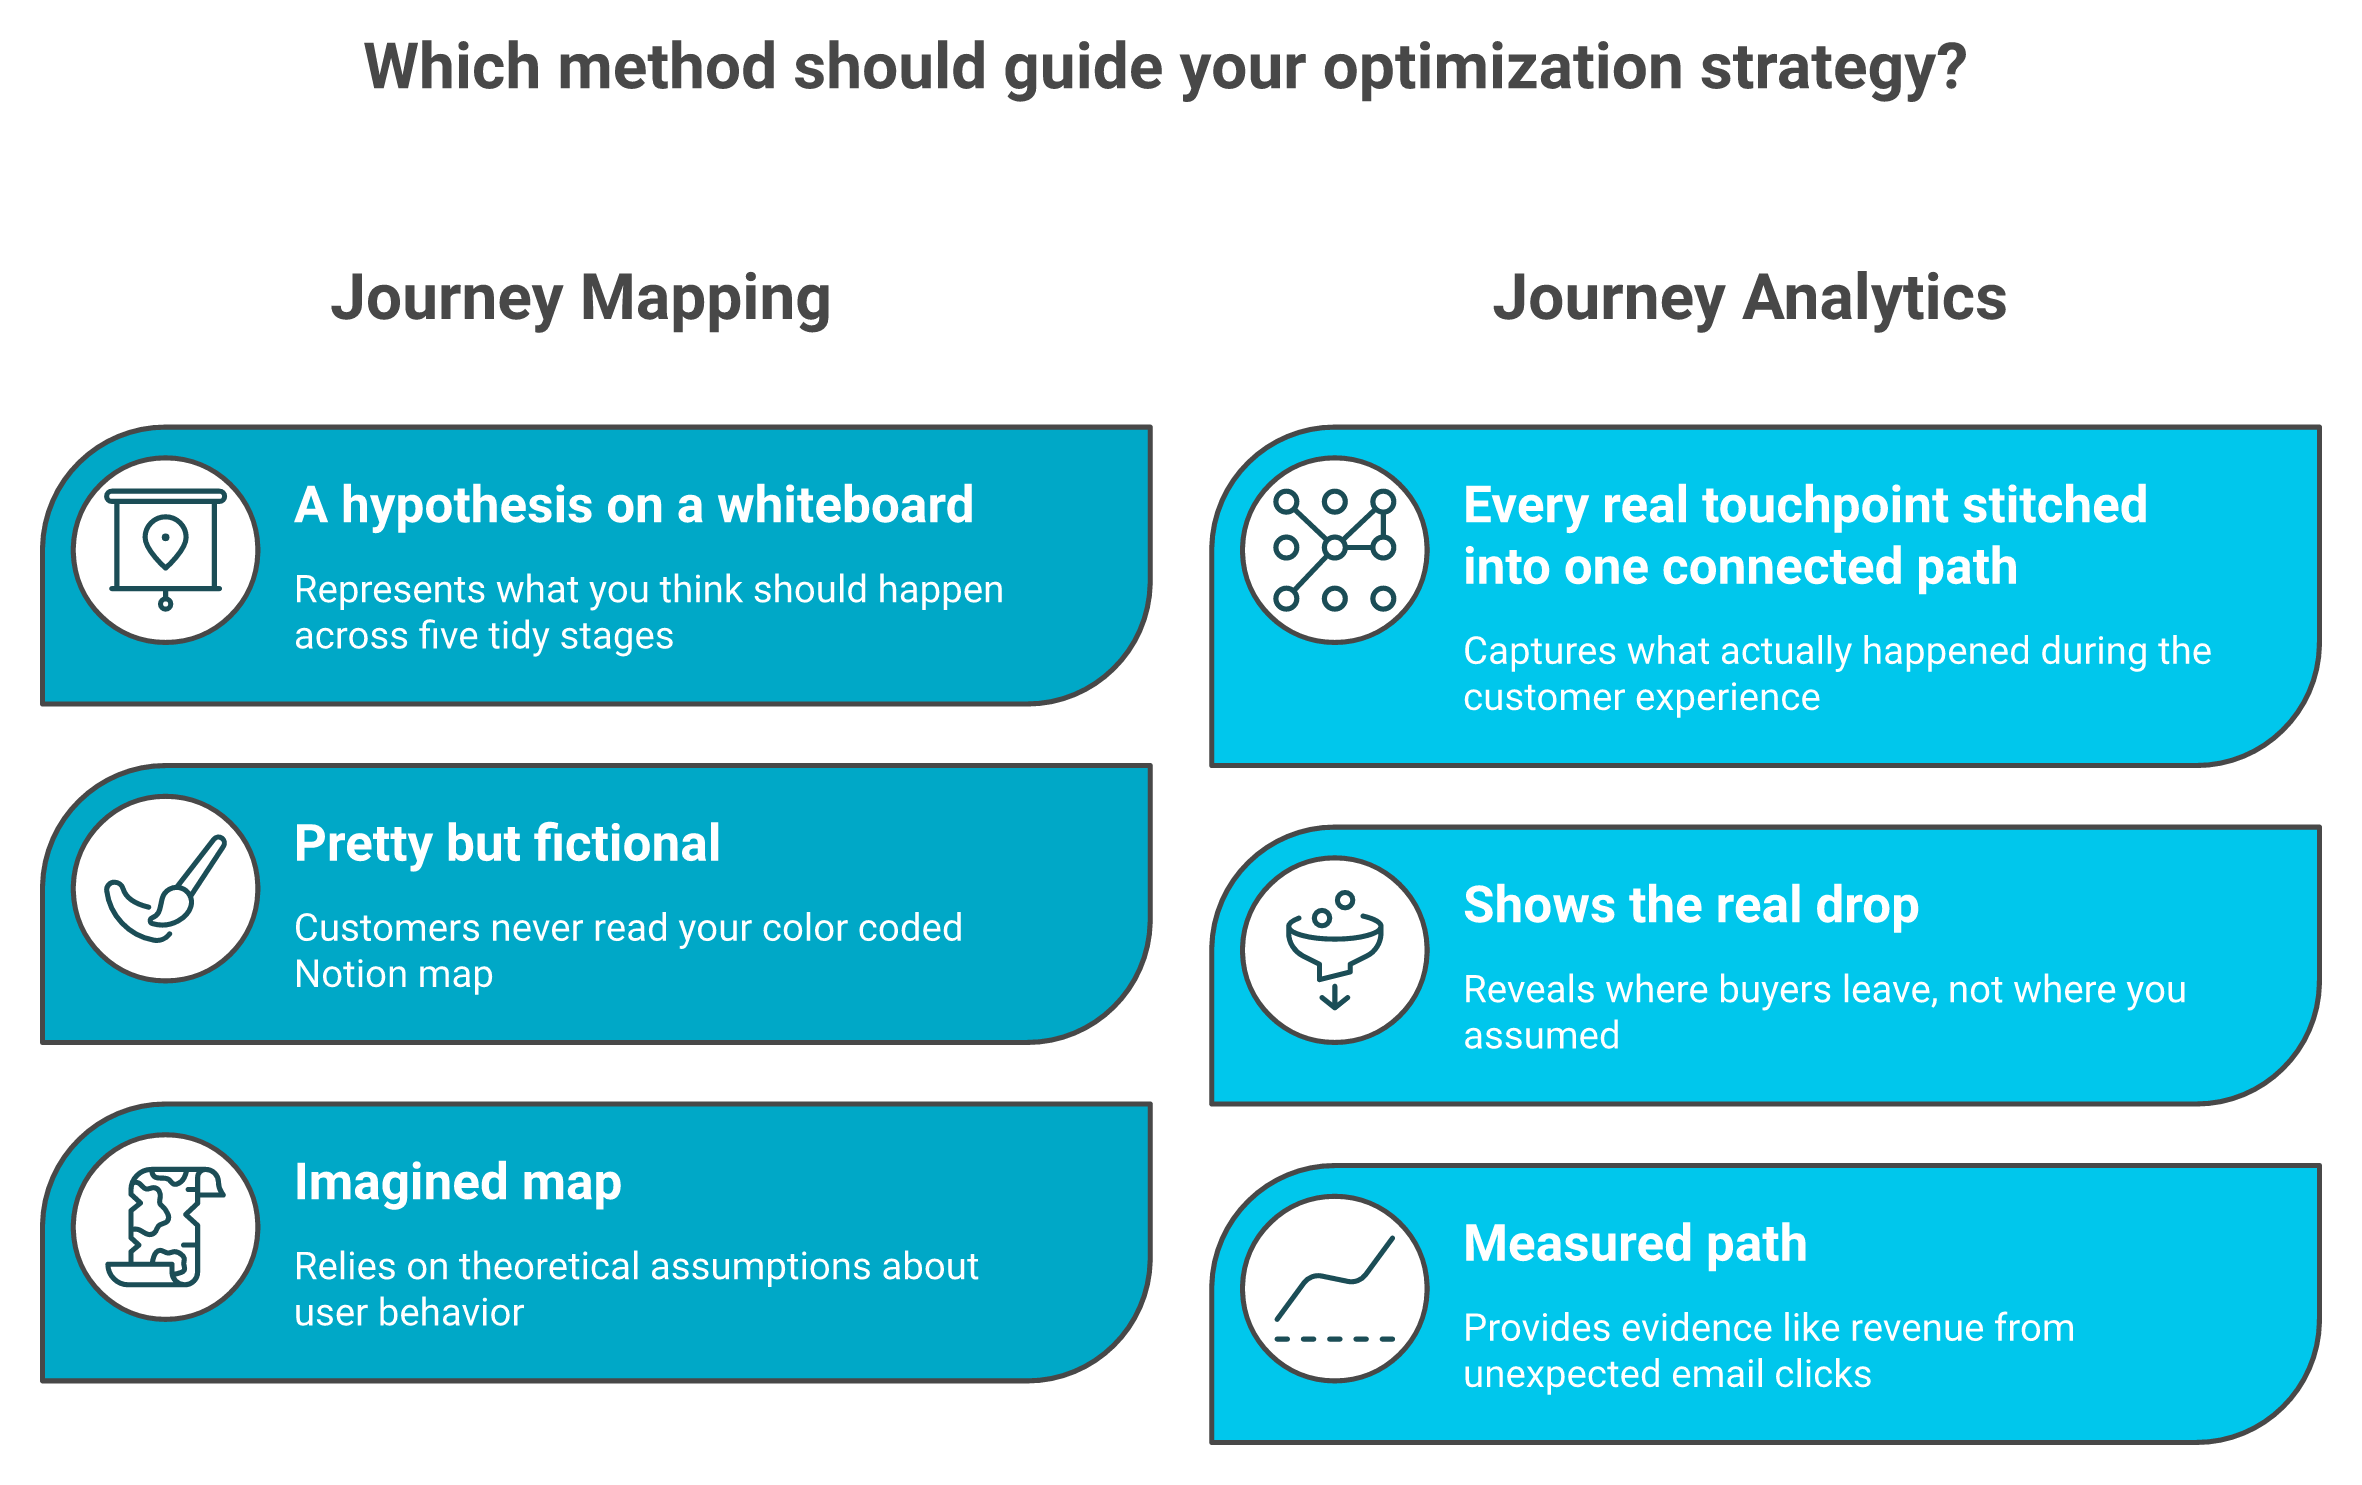
Journey mapping is a hypothesis on a whiteboard, while ecommerce customer journey analytics is the receipt from your data showing the path buyers actually took.
Each stage has one truth-teller metric and several flatterers; track checkout-completion and 90-day LTV, not impressions, bounce, or blended conversion rate.
Instrumentation starts with a touchpoint inventory, one shared customer ID, and tagged GA4 events from view_item through purchase plus your highest-friction step.
Attribution distorts the journey through last-click bias, double-counting, and cookieless gaps, so triangulate every platform number against blended CAC.
Rank leaks by dollars lost; recovering just 5 percent of a coffee store's abandoned carts modeled to roughly 211,000 dollars a year from one shipping fix.
No single tool wins; pair an AI layer over your warehouse with an attribution pixel, and always test accuracy against your raw Shopify data first.
Q1. What is ecommerce customer journey analytics (and how is it different from journey mapping)? [toc=1. Analytics vs Mapping]
Ecommerce customer journey analytics stitches every real touchpoint a shopper hits, ad click, product page, cart, checkout, email, repeat purchase, into one connected path so you see where buyers actually drop, not where you assumed. Journey mapping is the hypothesis on a whiteboard. Journey analytics is the receipt from your data showing whether that hypothesis was ever true.
🗺️ The map is a guess. The analytics is the receipt.
Last month I sat with a founder who had a gorgeous five-stage journey map in Notion. Awareness, consideration, decision, the works. Color-coded.
Then we pulled her actual data. Almost 60% of her revenue came from people who clicked an email, landed on an old product page she had written off, and bought without ever touching the "consideration" content she had spent three months building.
Her map was fiction. A pretty one, but fiction. Her customers never read it.
Journey mapping is what you think happens. Journey analytics is what your data proves happened across every touchpoint.
That gap is the whole point. Journey mapping is what you think should happen. Journey analytics is what did happen, traced across every system that touched the buyer. This is the core of any real ecommerce website analytics practice.
💡 Why this distinction touches your bank account
Here is the part nobody tells you. Most stores burn quarters optimizing the map instead of measuring the path.
You can spend twelve weeks rewriting middle-funnel content because the map says that is where people decide. Meanwhile the real leak is a shipping cost that appears at checkout and kills 30% of carts. The map will never show you that. The analytics will.
The reason this stays hard is structural, not lazy. A typical Shopify store at $1M revenue runs 8 to 12 separate tools, and each one sees a fragment. None sees the whole. So the founder becomes the integration layer, manually triangulating numbers at 11pm on a Sunday, a problem we unpack in why e-commerce founders are drowning in data.
That manual triangulation is the disease. Journey analytics is the cure, and it only works when the data is connected, which is exactly the problem we built Luca to solve later in this article.
⚠️ The one question to ask your own data on Monday
Pull your last 1,000 orders and ask a single thing: what was the real first touch, and what was the real last touch before purchase?
Not the attributed touch. The actual one. If your answer is "I am not sure," you do not have a journey problem. You have a measurement problem, and that is fixable with the right ecommerce analytics platforms.
"Daily revenue totals are wrong, entire order blocks are missing... Triple Whale shows orders from external marketplaces as if they were real conversions even though these orders never go through our Shopify store." XTRA FUEL, 1-star Triple Whale Trustpilot Verified Review
That review is a warning. If your analytics layer invents touchpoints that never happened, your "journey" is just a prettier guess. Garbage in, confident garbage out.
Q2. Which metric categories actually matter at each journey stage? [toc=2. Stage-by-Stage KPIs]
Each stage has one metric that tells the truth and three that flatter you. Awareness: new-visitor rate and assisted reach, not impressions. Consideration: product-page-to-cart rate, not bounce. Conversion: checkout-completion, not blended conversion rate. Retention: repeat-purchase rate and 90-day LTV (lifetime value). Advocacy: referral and review rate. Track the truth-tellers, ignore the flatterers.
📊 The truth-teller versus the flatterer
Impressions have never paid an invoice. Neither has bounce rate.
After looking at a lot of Shopify P&Ls, what jumps out is how many founders track the metrics that feel good instead of the ones that move cash. Every stage has a flatterer that goes up and to the right while your bank balance goes nowhere. Knowing the best way to track e-commerce unit economics is what separates the two.
The test I use is simple, and it is the only test that matters: does this number ladder to money? If a metric can double while your profit stays flat, it is a flatterer. Cut it from your dashboard.
Here is the per-stage split I would actually run.
Truth-Teller KPIs vs Vanity Metrics, by Journey Stage
Journey stage
Truth-teller KPI
Flatterer to ignore
What a bad number costs you
Awareness
New-visitor rate, assisted reach
Raw impressions
You pay for reach that never enters the funnel 💸
Consideration
Product-page-to-cart rate, micro-conversions
Bounce rate, time on site
Traffic lands but never signals intent
Conversion
Checkout-completion rate
Blended site conversion rate
Carts fill, then die at a step you cannot see
Retention
Repeat-purchase rate, 90-day LTV
Total order count
You buy customers once and never again 💰
Advocacy
Referral rate, review rate
Follower count
Growth stays fully paid, never organic
🎯 Why the conversion row is the one most stores get wrong
Blended conversion rate is the worst flatterer of them all. It averages your best traffic with your worst and hides the exact step that is bleeding you.
A "micro-conversion" just means a small yes on the way to the big yes: an add-to-cart, an email signup, a size selected. These signals tell you intent is building before the purchase ever lands.
Checkout-completion rate is different. It isolates the people who already said "I want this" and shows how many you lost after they reached for their wallet. That is where the cheapest revenue in your entire store is hiding.
The trouble starts when you try to track these five truth-tellers across five different tools, each with its own definition of "conversion." That is the exact consolidation pain a tool like Luca's unified use cases removes by holding one definition across every source, which is where the next section picks up.
Q3. How do you instrument the journey across a fragmented Shopify stack (touchpoints + GA4 events)? [toc=3. Hands-On Instrumentation]
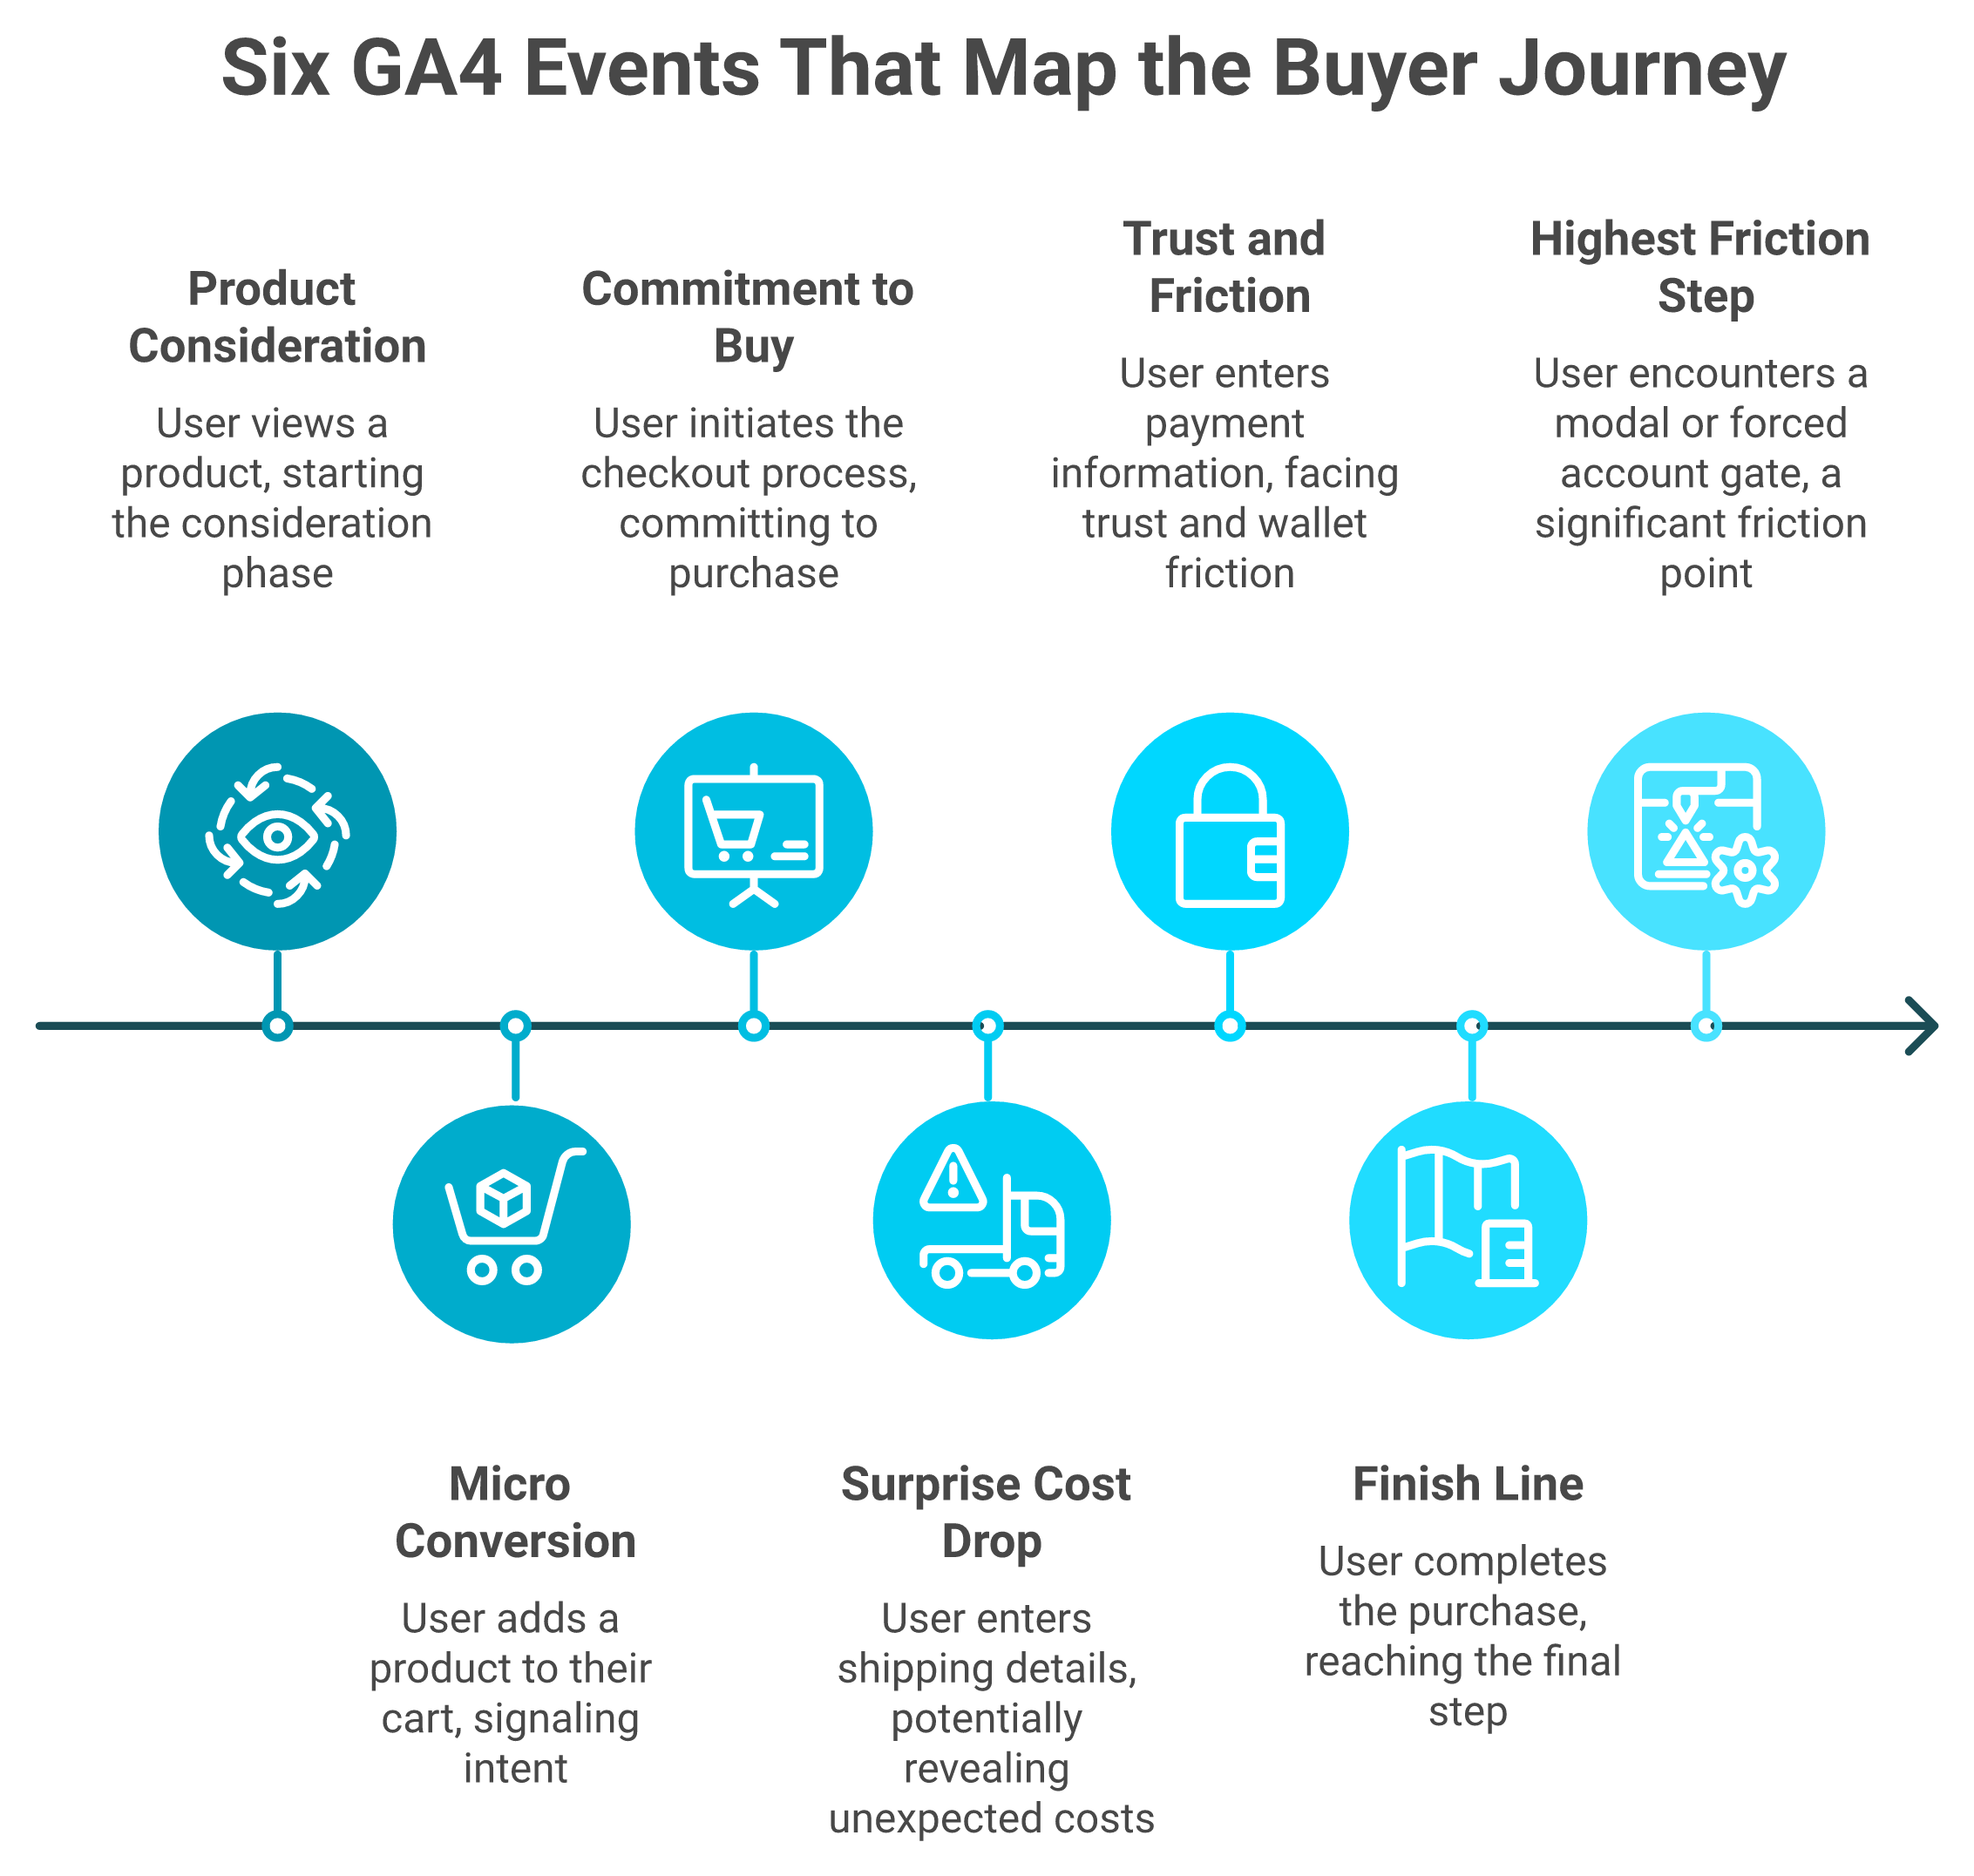
List every system that touches a customer, Meta, Google, Shopify, Klaviyo, your reviews app, your 3PL, then force one shared customer ID and one definition of each event across them. In GA4, instrument view_item, add_to_cart, begin_checkout, add_shipping_info, add_payment_info, and purchase, plus a custom event for your highest-friction step. The Funnel and Path Exploration reports then show drop-off without SQL.
🧾 Start with a touchpoint inventory, not a tool
Before you tag anything, write down every system that touches a buyer. This is boring and it is the step everyone skips.
Here is the inventory for a typical Shopify store:
Acquisition: Meta Ads, Google Ads, TikTok, organic search
On-site: Shopify storefront, GA4, your reviews and search apps
Lifecycle: Klaviyo email and SMS
Post-purchase: your 3PL, returns portal, support inbox
Each one reports its own slice. Each one thinks it owns the customer. None of them agree. Mapping your full e-commerce tech stack first is what makes the rest possible.
🔀 The real problem is identity, not tracking
Here is what nobody tells you. The hard part is not collecting data. It is making three systems agree on what a "conversion" even means.
Meta reports on a 7-day-click window. GA4 reports last-non-direct. Shopify reports the actual order. I have watched these three disagree by 30% on the same week of sales, and every one of them swears it is right.
If you never reconcile them, you build your journey on three contradictory stories. So you force one shared customer identifier (usually email or a hashed ID) and one shared definition of each event across all systems. That is the unglamorous work that makes everything downstream true.
🏷️ The exact GA4 events to tag
GA4 gives you the journey almost for free if you tag the right ecommerce events. If you have not yet connected it, start with adding Google Analytics to Shopify. Tag these, in this order:
Tag these GA4 events in order to read drop off at every stage, including the high friction shipping and payment steps.
view_item they looked at a product (consideration starts)
add_to_cart intent signal, your first real micro-conversion
begin_checkout they committed to buying
add_shipping_info the classic surprise-cost drop point ⚠️
add_payment_info trust and wallet friction shows here
purchase the finish line
one custom event for your single highest-friction step (a subscription modal, a forced-account-creation gate)
That last one earns its keep. We tagged a subscription_modal_view event for a coffee subscription store and found the modal, not checkout, was the real drop. Nobody would have guessed that from a dashboard.
📈 Which report reads each stage
Use GA4's Funnel Exploration to see stage-by-stage drop-off across those events. Use Path Exploration to see the messy, non-linear routes people actually take, the ones your journey map pretends do not exist. For a deeper walkthrough, see our guide to Google Analytics for ecommerce.
Now the warning. If you plug raw, unnormalized data into any layer, you lose a year cleaning it before it tells you anything true. This is the cleanup year, and it is brutal.
We built Luca to skip it. It is an AI layer over your data warehouse that normalizes and standardizes data on ingestion, so "revenue" means the same thing whether it comes from Shopify or Stripe, and you can ask the journey question in plain English instead of building SQL or another dashboard, exactly the kind of data analysis and deep industry research it was made for.
"The integrations are inconsistent... it has been unable to deliver on the promise to provide any insights or accurate data to our business, and we end up reverting back to direct data sources like Meta, Shopify, Recharge." Matt Huttner Triple Whale Trustpilot Verified Review
"Since day one, the data has been inaccurate. Daily revenue totals are wrong, entire order blocks are missing." XTRA FUEL, 1-star Triple Whale Trustpilot Verified Review
Read those two and you see the stakes. If the normalization is wrong, operators abandon the tool and go back to checking five tabs by hand. The instrumentation is only as good as the layer that unifies it.
Q4. Why does attribution distort the journey, and how do you read it honestly? [toc=4. Attribution & Cookieless Reality]
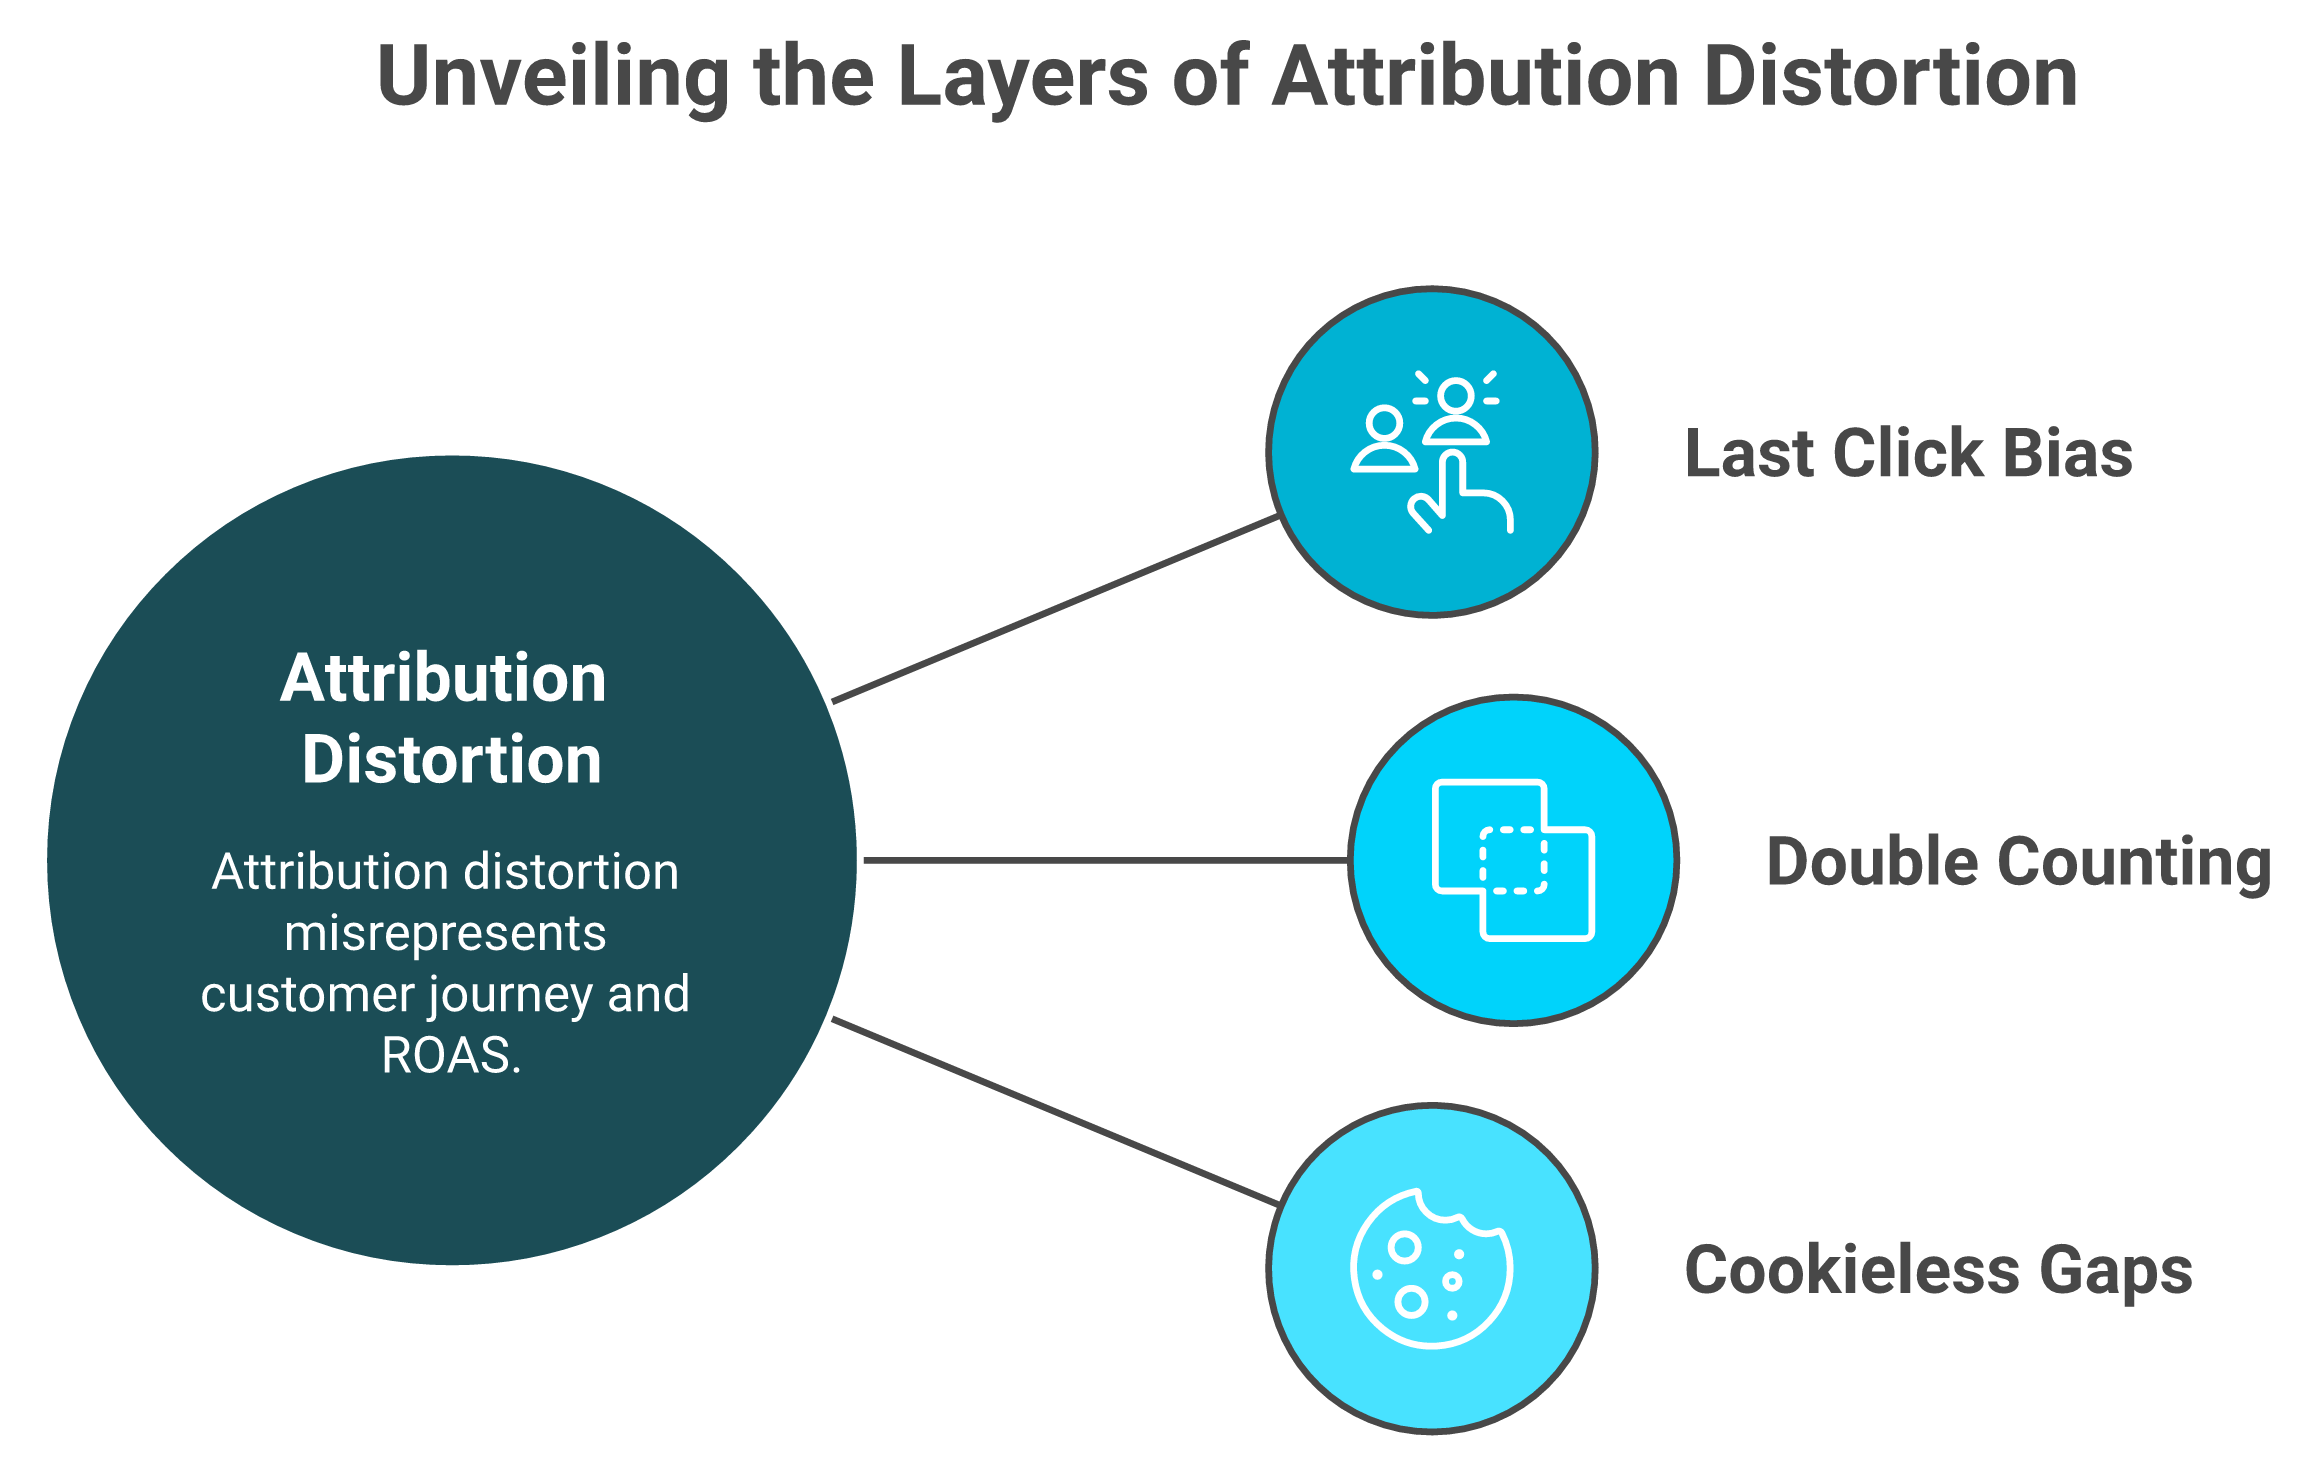
Attribution is where journey analytics quietly lies. Last-click starves the awareness content that fed the sale, while Meta and Google both claim the same conversion, so platform ROAS (return on ad spend) double-counts. As cookies die, cross-device gaps widen. Read attribution as a directional story, and triangulate every platform number against your real blended CAC (customer acquisition cost) from Shopify and your bank.
🎭 The claim: your platforms are overstating themselves
If you add up the revenue Meta claims and the revenue Google claims, you get a number bigger than your actual sales. Every operator has seen this. Few say it out loud.
My read, and I could be off on the exact figure, is that platform-reported ROAS is inflated for almost every store running two or more paid channels. The platforms are not evil. They are just each grading their own homework, a gap we cover in declining platform ROAS vs true profitability.
❌ The three ways attribution breaks the journey
Three specific failures distort the path you are trying to read:
Three failure modes radiate from one problem: attribution overstates itself, which is why blended CAC is the honest read.
Last-click bias. It hands all the credit to the final touch, usually a branded search or a retargeting ad. The top-of-funnel content that actually created the demand gets starved of budget because the model says it did nothing.
Double-counting. If both Meta and Google say they drove the same sale, one of them is lying. Both pixels fire, both claim the win, and your reported ROAS becomes fiction.
Cookieless gaps. As third-party cookies disappear and buyers hop from phone to laptop, cross-device journeys break into disconnected fragments. The path looks shorter and cleaner than it really is.
✅ The honest read: blended CAC is your lie detector
Here is the move. Stop trusting any single platform's self-reported number and pull back to blended CAC.
Blended CAC is dead simple: total marketing spend divided by total new customers, straight from Shopify and your bank statement. It cannot be gamed by a pixel because it does not care which channel takes credit. It only knows what left your account and what came back. This is the heart of real marketing analysis and automation.
Platform attribution is still useful as a directional story for which creative or audience is trending. Just never treat it as gospel for how you allocate real cash.
One honest boundary on Luca here, because it matters. Luca is not an attribution pixel and does not replace one. What it does is sit as an AI layer over your warehouse, reconcile the platform-reported numbers against your actual financial data, and surface the root cause when your CAC spikes, the influencing components a single dashboard cannot connect, a job suited to financial management done right.
"Triple Whale shows orders from external marketplaces as if they were real conversions even though these orders never go through our Shopify store... They still appear in attribution. Completely fake data." XTRA FUEL, 1-star Triple Whale Trustpilot Verified Review
"Overall it has been unable to deliver on the promise to provide any insights or accurate data... we end up reverting back to direct data sources like Meta, Shopify, Recharge." Matt Huttner Triple Whale Trustpilot Verified Review
Both reviews land on the same nerve. When attribution invents conversions, operators stop trusting the tool and crawl back to raw sources. That is the cost of reading attribution as truth instead of as a directional signal.
Q5. How do you run a journey deviation analysis to find the single highest-cost leak? [toc=5. Journey Deviation Analysis]
Journey deviation analysis compares the path you expected customers to take against the path they actually took, then ranks each deviation by dollars lost. A spike at add_shipping_info means surprise shipping. A drop at account creation means a forced-login gate. A stall at payment means a trust gap. Find the single worst deviation, size it in cash, fix that one thing first.
🔥 The situation: 71% of carts gone, no idea why
A coffee subscription founder I worked with had a 71% cart abandonment rate. That is not unusual. Baymard pegs the global average at 70.19% across 49 studies.
But "average" does not pay rent. She was losing real orders every day and had no idea which step was doing the damage. Her dashboard just showed the bleak, not the hole.
She had done the textbook thing. Klaviyo flows, retargeting, and a discount popup. None of it moved the number, because none of it touched the actual cause. This is where a proper Shopify analytics dashboard earns its keep.
🔍 The complication: which step is the leak?
Cart abandonment is a symptom, not a cause. The job is to find the one step where real behavior deviates hardest from the expected path.
Here is what the deviation usually traces back to, with the Baymard checkout data behind it:
Spike at add_shipping_info ➝ surprise shipping cost. This is the big one. 39% of shoppers abandon because extra costs are too high. 💸
Drop at account creation ➝ a forced-login gate. 19% abandon because the site made them create an account.
Stall at add_payment_info ➝ a trust gap. 19% abandon because they did not trust the site with their card.
So the question is never "why is abandonment high." It is "which of these three is my leak."
📐 The resolution: isolate it, then size it in cash
We pulled her GA4 funnel, and the deviation was obvious. The drop concentrated at add_shipping_info, not checkout. Her shipping cost appeared late and surprised people.
Then we sized it. This is the step operators skip, and it is the whole point. Sizing the deviation in dollars tells you if it is worth your week.
Finding that deviation step, its root cause, and the influencing components around it is exactly the analytics job we built Luca to run. It scans the data and pings you when a pattern like this breaks, so you are not hunting the funnel by hand every Monday, the kind of always-on process troubleshooting a static tool cannot match.
✅ The payoff: fix one step, recover the cohort
She moved shipping cost into the cart, before checkout. No surprise at the end. The deviation at add_shipping_info flattened within two weeks.
Then she pointed a Klaviyo flow at the cohort that had already dropped at that exact step. Recovering even 10% of that group was real money, because these were buyers who wanted the product and balked at one number.
One honest limit. If your store is below the volume where the funnel has enough sessions to read, this analysis is noise. Wait until the data can actually talk.
"Since day one, the data has been inaccurate. Daily revenue totals are wrong, entire order blocks are missing." XTRA FUEL, 1-star Triple Whale Trustpilot Verified Review
That is the failure mode to avoid. If your analytics layer is missing orders, your "deviation" might just be a data gap, and you will fix the wrong thing.
Q6. How do you analyze retention and churn across the post-purchase journey? [toc=6. Retention & Churn]
Most journey analytics stops at the first purchase, which is where the money actually starts. Track repeat-purchase rate by acquisition cohort, time-to-second-order, and subscription churn timing. A buyer who orders twice in 60 days is worth modeling differently from a one-and-done, and channels never produce equally loyal buyers, so judge them on 90-day LTV, not first-order ROAS.
💰 Why the journey does not end at checkout
Here is the thing the top guides get backwards. They treat the purchase as the finish line. It is the starting line.
The first order usually just pays back your acquisition cost. The profit lives in the second, third, and fourth orders. If your journey analytics goes dark after checkout, you are blind to where the actual margin is made, a gap that good unit-economics tracking closes.
A "cohort" just means a group of customers who first bought in the same window, say January buyers. You track them as a group over time to see how many come back.
📈 The three retention signals that matter
You do not need a wall of retention metrics. Three signals tell you almost everything:
Repeat-purchase rate by cohort ➝ what share of each month's new buyers come back at all.
Time-to-second-order ➝ how long until the second purchase. This is your reorder rhythm, and it tells you when to send the next email.
Subscription churn timing ➝ for subscriptions, the exact month people cancel. Most churn clusters, often right after the first renewal.
Watching these over months is hard with a static dashboard. This is where Luca earns its place. It gives you cohort-level vigilance without you building a cohort-level dashboard, and it studies the pattern over time, then pings you when this month's cohort starts behaving worse than usual, the proactive sales-performance monitoring most tools lack.
⚠️ Your best-ROAS channel is often your worst-LTV channel
Now the contrarian part, and I will hedge it: my read is that most stores judge channels on the wrong number.
Acquisition channels do not produce equally loyal buyers. A channel can post a beautiful first-order ROAS (return on ad spend) and bring you customers who never come back. Another can look mediocre on day one, and quietly deliver your most loyal cohort.
So judge channels on 90-day LTV (lifetime value, the total profit a customer brings in 90 days), not first-order ROAS. The channel you were about to cut might be your best one. The "winner" might be renting you one-time buyers, a trap we explore in declining platform ROAS vs true profitability.
Q7. Which customer journey analytics tools fit which stage of store? [toc=7. Tool Comparison]
No single tool wins for everyone. An AI layer over your data warehouse answers cross-functional "why" and root-cause questions in plain English. GA4 is free but punishing to configure. Fullstory and Amplitude add behavioral depth for funded teams. Triple Whale unifies marketing and commerce but stops at the finance line. Pick by your stage and the question you keep failing to answer.
🧰 Stop buying tools. Start buying answers.
Most operators do not have a tool problem. They have a "five tabs open and none of them agree" problem.
The right way to choose is not by feature list. It is by the one question you keep failing to answer, then buying the thing that answers it. Here is how the main options actually stack up, and our deeper roundup of the best Shopify analytics apps goes further.
Ecommerce Analytics Tools, Compared
#
Tool
Data scope
Best-fit stage
The question it can't answer
1.1
Luca
Marketing, commerce, finance, and ops, in one AI layer
Stores past the cleanup-year pain, wanting plain-English answers
(Honest limit: it is not an attribution pixel, so pair it with one)
1.2
GA4
Web behavior, ecommerce events
Every store, day one (free)
"Why did this happen, in plain English?" 😵
1.3
Amplitude
Product and behavioral analytics
Funded teams with an analyst
"What does this do to my cash position?"
1.4
Fullstory
Session replay, behavioral depth
UX-focused teams
Cross-channel financial context
1.5
Triple Whale
Marketing plus commerce attribution
DTC stores scaling paid
"Can I afford the working capital to scale?" ❌
🎯 How to actually pick
If you are starting out, GA4 is enough, and it is free. The pain is configuration, not capability, so budget a weekend.
If your real bottleneck is asking a question and getting a reasoned answer without building a dashboard or hiring an analyst, that is the gap Luca fills. Most analytics tools added AI on top of a dashboard. Luca is AI over your data, which is a different thing, and our Triple Whale alternatives guide unpacks why.
The honest trade-off with Triple Whale is real. It is strong on the marketing-plus-commerce picture, but, by design, it stops at the finance line. It cannot tell you whether scaling a winning campaign will break your cash position.
"It has been unable to deliver on the promise to provide any insights or accurate data to our business, and we end up reverting back to direct data sources like Meta, Shopify, Recharge." Matt Huttner Triple Whale Trustpilot Verified Review
"Triple Whale shows orders from external marketplaces as if they were real conversions even though these orders never go through our Shopify store." XTRA FUEL, 1-star Triple Whale Trustpilot Verified Review
I am not posting these to dunk on Triple Whale. The repeated one-star pattern, data you cannot trust, is the single thing that breaks any analytics purchase, theirs or ours. Test accuracy on your own data before you commit.
Q8. How do you turn journey analytics into action, and what's the ROI of fixing the right leak first? [toc=8. ROI & Monday Playbook]
Journey analytics only pays when it changes what you do this week. Rank leaks by dollars lost, not ease of fix. A 2-point lift on a step 10,000 sessions hit beats a 10-point lift on one nobody reaches. Build first-party data as cookies die, then fund the proven winner before the moment passes.
🎯 Rank leaks by dollars, not by how easy they are
The mistake I see most is fixing the easy thing instead of the expensive thing. Easy feels productive. Expensive pays.
Rank every leak by dollars lost, top to bottom. A 2-percentage-point lift on a step that 10,000 sessions hit beats a flashy 10-point lift on a step nobody reaches. Attack the top of that list first, always.
🧮 The worked ROI math
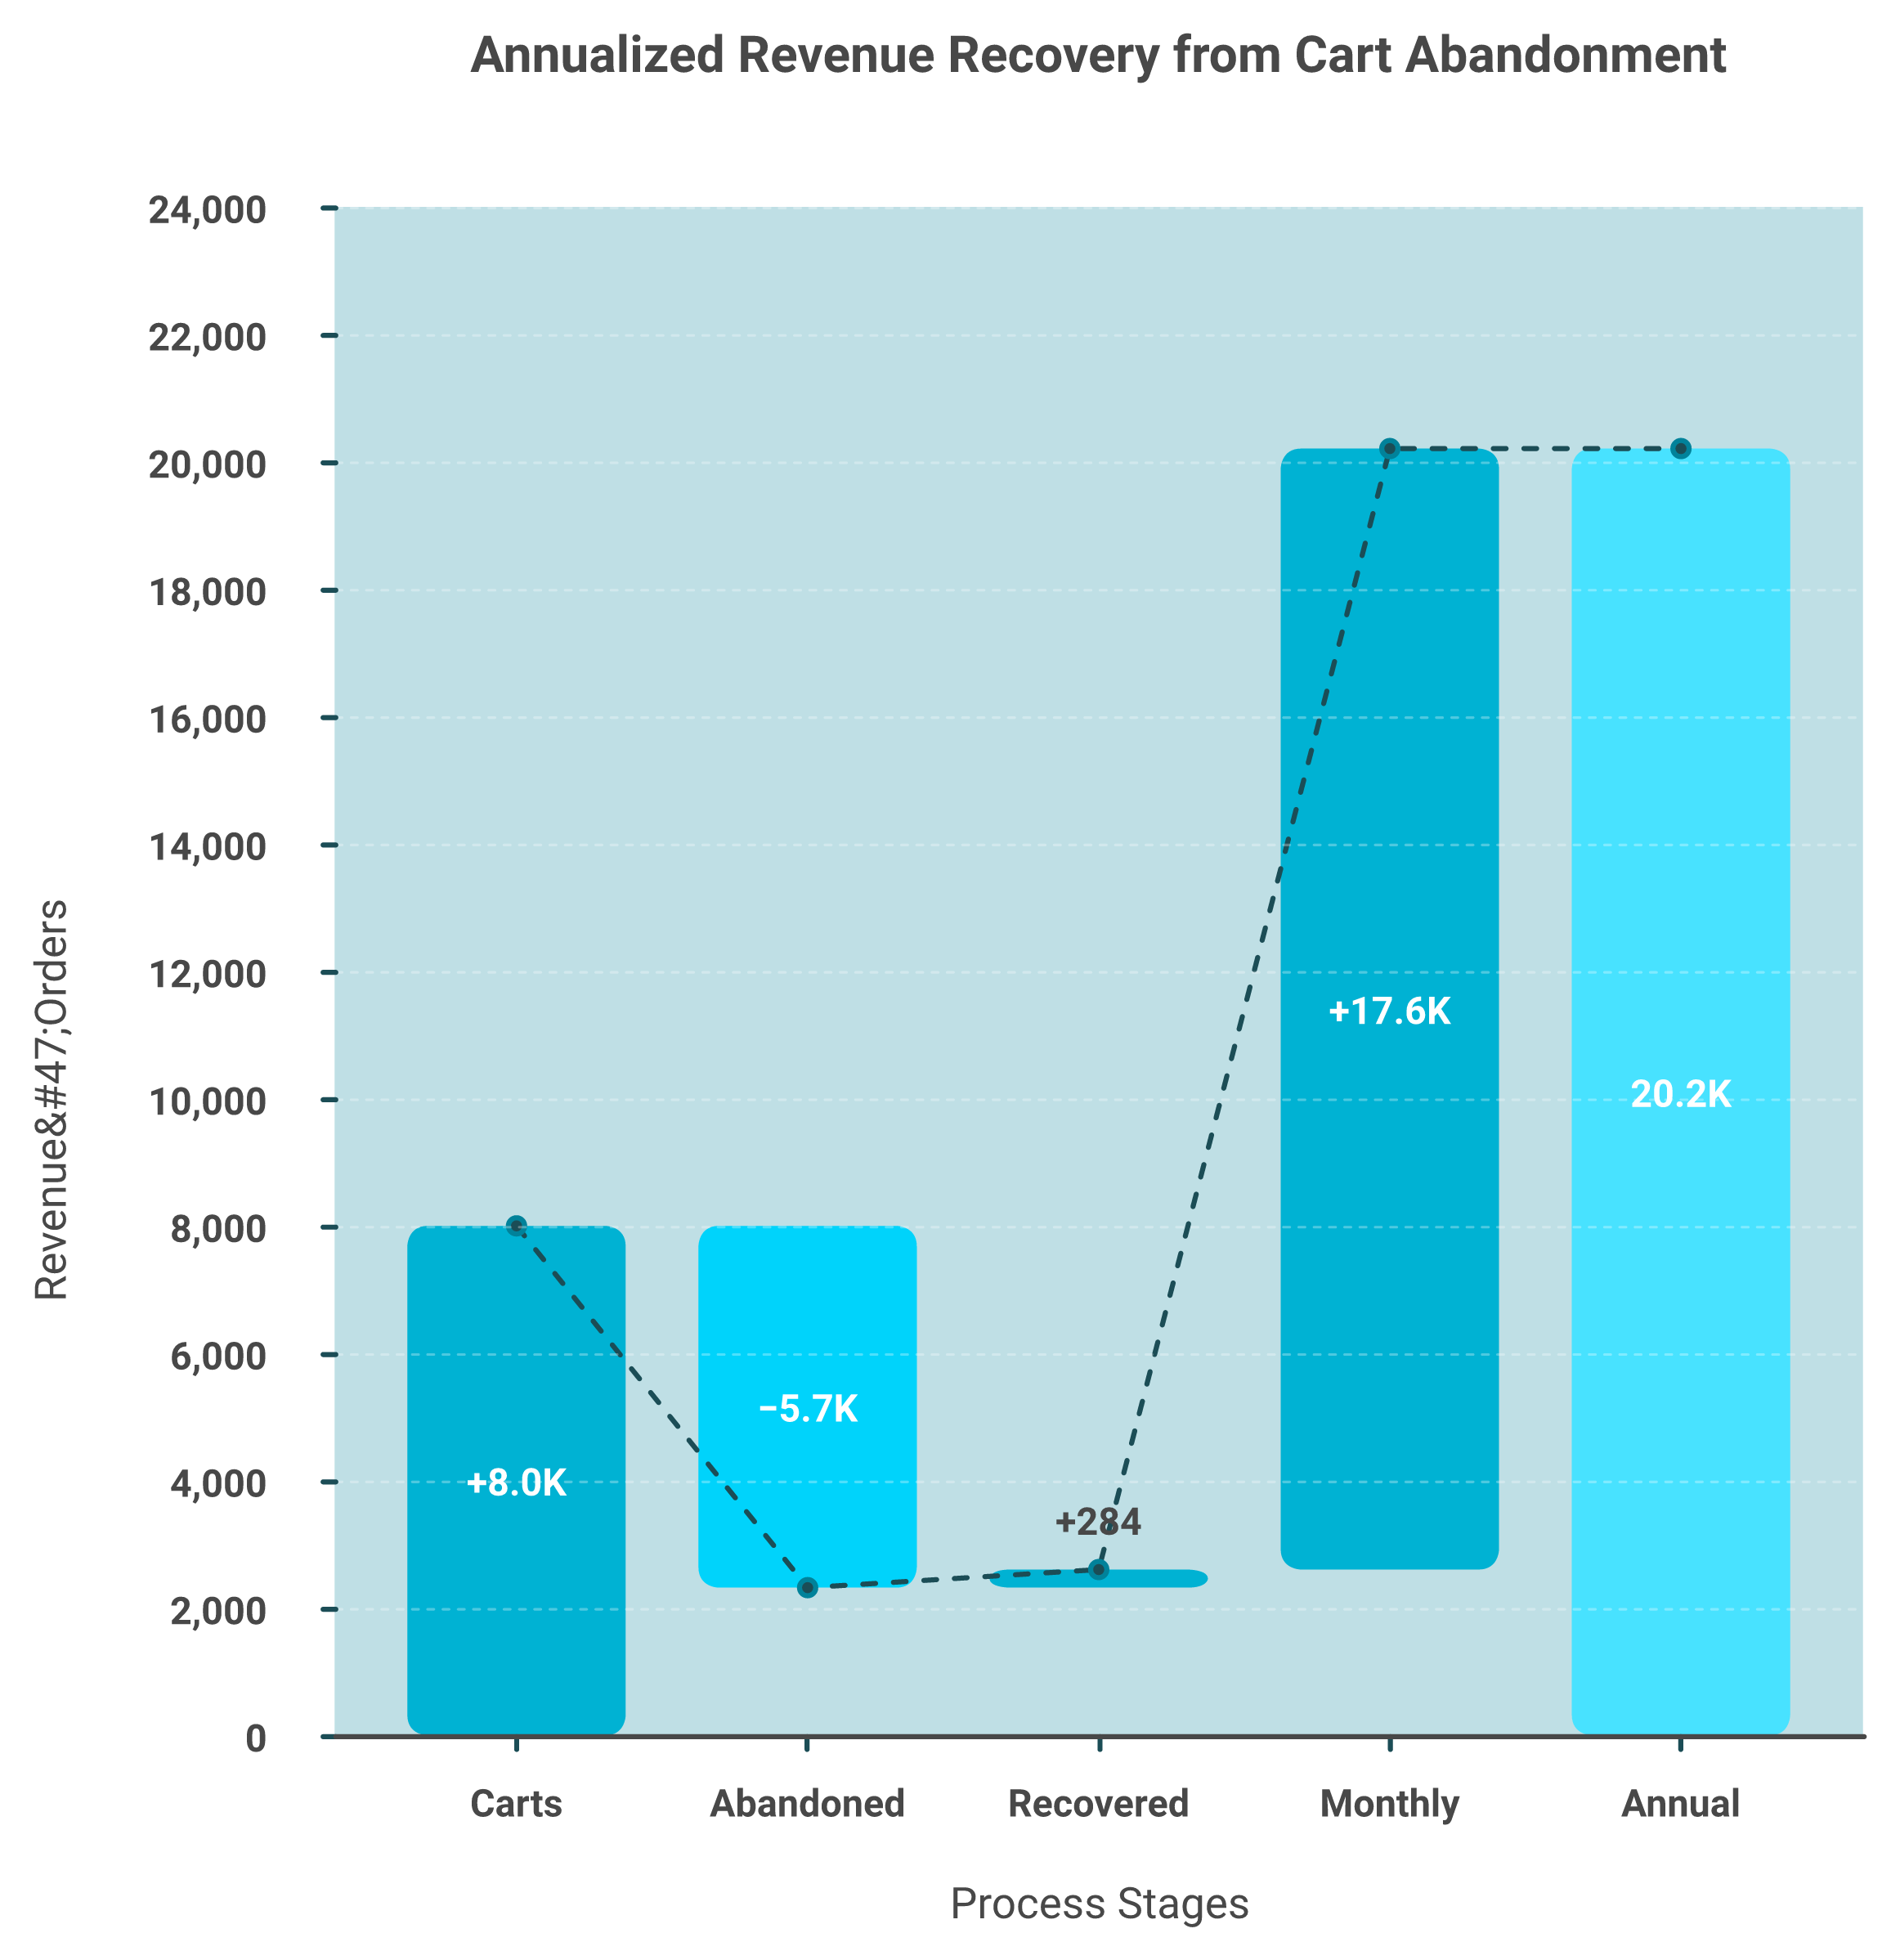
Let me run real numbers, because a recommendation that ignores cash is useless. Take the coffee store from earlier: 8,000 carts a month, a $62 average order value, and a 71% abandonment rate.
Recovering just 5 percent of abandoned carts at a 62 dollar order value compounds to roughly 211,000 dollars a year.
Carts abandoned each month: 8,000 × 0.71 = 5,680
Recover just 5% of them: 5,680 × 0.05 = 284 orders
At $62 each: 284 × $62 = about $17,600 a month 💰
That is roughly $211,000 a year from fixing one shipping-reveal step. That is the difference between a tweak and a real lever. Most "growth hacks" never touch a number this big.
🔒 Build first-party data before the moment passes
Here is the future-leaning part. As third-party cookies fade, the stores that win are the ones that own their customer data directly, from email, from purchases, and from on-site behavior.
First-party data (information your customers give you directly) is becoming the only reliable signal. Build that depth now, while it is still a choice and not an emergency, with help from data analysis and deep industry research.
✅ Close the loop: analyze, then fund
Once the analysis proves a winner, the bottleneck shifts from insight to cash. You found the $211,000 lever. Now you need working capital to scale the inventory or spend behind it, which is where funding to scale e-commerce marketing campaigns comes in.
This is where Luca's capital piece comes in, and I will keep it strictly to capital terms. The advantage is speed and price: capital that disburses fast, at a rate that reflects your real-time business health, sized to what you actually need, the approach behind our financial management use case.
That last part matters. Revenue-based financing providers have a built-in incentive to push a bigger advance than you need, and the receipts are ugly:
"Company loves to lie unfortunately. They gave our firm a $90,000 loan... they kept making excuses and lies. Stay away from this company, very predatory." Adam Zackman Wayflyer Trustpilot Verified Review
"Once they persuade you to take more money than you need in the name of just closing the deal, after that they leave you hanging." Tobi Odunaiya Wayflyer Trustpilot Verified Review
If you have run a journey deviation analysis this quarter and found your one big leak, I would love to hear what it was and what it cost you. That is the conversation worth having.
Q9. Which Customer Journey Analytics Tools Fit Which Stage of Store? [toc=9. Tool Comparison]
No single tool wins for everyone. An AI layer over your data warehouse answers the cross-functional "why" and root-cause questions a dashboard can't. GA4 is free but punishing to configure. Fullstory and Amplitude add behavioral depth for funded teams. Triple Whale unifies marketing and commerce but stops at the finance line. Pick by your stage and the question you keep failing to answer.
🧰 The problem is not too few tools. It's too many.
Most operators I meet are not missing a tool. They have six, and not one of them agrees with the others.
So stop shopping by feature list. Pick by the one question you keep failing to answer at 11pm on a Sunday, then buy the thing that answers it. Everything else is noise you will pay a monthly fee for, a trap we cover in our best Shopify analytics apps roundup.
📊 The honest comparison
Here is how the main options actually stack up, including where each one breaks. I have tried to be fair about the trade-offs, because pretending one tool wins everything is how you waste six months. For a deeper look, see our guide to ecommerce analytics platforms.
Ecommerce Analytics Tools, Compared
#
Tool
Data scope
Best-fit stage
The question it can't answer
1.1
Luca
Marketing, commerce, finance, and ops, unified in one AI layer
Stores past the data-cleanup pain, wanting plain-English answers and root cause
(Honest limit: it is not an attribution pixel, so pair it with one)
1.2
GA4
Web behavior, ecommerce events
Every store, day one (free)
"Why did this happen, explained simply?" 😵
1.3
Amplitude
Product and behavioral analytics
Funded teams with an analyst on staff
"What does this do to my cash position?"
1.4
Fullstory
Session replay, behavioral depth
UX-focused teams chasing on-site friction
Cross-channel financial context
1.5
Triple Whale
Marketing plus commerce attribution
DTC stores scaling paid spend
"Can I afford the working capital to scale?" ❌
🎯 How to actually pick, by stage
If you are early and scrappy, GA4 is enough, and it costs nothing. The pain is configuration, not capability, so block a weekend and tag your events properly, starting with our guide to adding Google Analytics to Shopify.
If you are funded and have an analyst, Amplitude or Fullstool give real behavioral depth. They reward teams that can feed them.
If your bottleneck is asking a plain-English question and getting a reasoned answer without building a dashboard or hiring an analyst, that is the gap Luca fills. Most analytics tools bolted AI onto a dashboard. Luca is AI over your data, which is a different animal. It surfaces the root cause, the influencing components, and pushes the report to you instead of waiting for you to dig, the kind of always-on data analysis and deep industry research a static tool cannot match.
⚠️ The trade-offs nobody on the vendor page will tell you
The honest knock on Triple Whale is structural, not petty. It is strong on the marketing-plus-commerce picture, but, by design, it stops at the finance line. It cannot tell you whether scaling a winning campaign will quietly break your cash position, which is why many operators look at Triple Whale alternatives.
And accuracy is the thing that breaks any analytics purchase, ours included. The repeated one-star pattern to watch for is data you cannot trust:
"It has been unable to deliver on the promise to provide any insights or accurate data to our business, and we end up reverting back to direct data sources like Meta, Shopify, Recharge." Matt Huttner Triple Whale Trustpilot Verified Review
"Daily revenue totals are wrong, entire order blocks are missing... orders from external marketplaces show as real conversions even though they never go through our Shopify store." XTRA FUEL, 1-star Triple Whale Trustpilot Verified Review
I am not posting these to dunk on anyone. I am posting them because you should run the same accuracy test on every tool here, Luca included, before you commit a dollar. Connect one week of data and check it against your raw Shopify and Meta numbers by hand, the discipline behind real unit-economics tracking.
🔮 Where I think this goes next
My read, and do not take it as gospel, is that by 2027 the "dashboard plus an analyst" model quietly dies for sub-$10M stores. The cost of asking a machine a question keeps falling, and operators will stop tolerating tools that show data without explaining it, a shift we map in agentic AI for ecommerce founders.
The honest exception stays the same. If you are below the volume where your funnel has enough sessions to read, none of this matters yet, so save your money.
If you have run a real bake-off between two of these tools, I would genuinely like to know which one survived contact with your actual data, and where it cracked. That is the comparison worth trading notes on, and our 7 best e-commerce analytics tools that fund your campaigns piece goes deeper.
FAQ's
What is ecommerce customer journey analytics and how is it different from journey mapping?
We define ecommerce customer journey analytics as the practice of stitching every real touchpoint a shopper hits, ad click, product page, cart, checkout, email, and repeat purchase, into one connected path so you see where buyers actually drop rather than where you assumed.
Journey mapping is different. It is the hypothesis on a whiteboard, a color-coded guess about what should happen. Journey analytics is the receipt from your data showing whether that guess was ever true.
The gap matters because most stores burn quarters optimizing the map instead of measuring the path. We once saw a founder whose tidy five-stage map was fiction, almost 60 percent of revenue came from an email click straight to an old product page she had written off.
Mapping tells you what you think happens.
Analytics traces what did happen across every system.
The work only pays when your data is connected, which is exactly the problem we built our AI Co-Founder to solve. Pull your last 1,000 orders and ask one thing: what was the real first and last touch before purchase?
Which metrics actually matter at each stage of the ecommerce customer journey?
We believe each journey stage has one metric that tells the truth and several that merely flatter you. The test is simple: does this number ladder to money? If a metric can double while profit stays flat, it is a flatterer.
Here is how we split it by stage:
Awareness: new-visitor rate and assisted reach, not raw impressions.
Consideration: product-page-to-cart rate and micro-conversions, not bounce rate.
Conversion: checkout-completion rate, not blended site conversion rate.
Retention: repeat-purchase rate and 90-day LTV, not total order count.
Advocacy: referral and review rate, not follower count.
The conversion row is where most stores go wrong. Blended conversion rate averages your best traffic with your worst and hides the exact step bleeding you, while checkout-completion isolates the people who already reached for their wallet.
The trouble starts when five tools each define conversion differently. That is the consolidation pain we remove with unified marketing analysis, holding one definition across every source so your truth-tellers stay true.
How do we instrument the customer journey across a fragmented Shopify stack?
We start every instrumentation project with a touchpoint inventory, not a tool. Write down every system that touches a buyer: Meta, Google, and TikTok for acquisition, Shopify and GA4 on-site, Klaviyo for lifecycle, and your 3PL post-purchase.
The hard part is not collecting data, it is making systems agree. Meta reports a 7-day-click window, GA4 reports last-non-direct, and Shopify reports the actual order, and we have watched them disagree by 30 percent on the same week. So you force one shared customer identifier and one shared definition of each event.
Then tag these GA4 ecommerce events in order:
view_item, add_to_cart, begin_checkout
add_shipping_info, add_payment_info, purchase
One custom event for your single highest-friction step
Funnel Exploration shows stage-by-stage drop-off and Path Exploration reveals the messy real routes. If you need the setup walkthrough, see our guide on adding Google Analytics to Shopify. Feeding raw, unnormalized data into any layer costs you a cleanup year, which is exactly the work we skip by normalizing on ingestion.
Why does attribution distort the ecommerce customer journey, and how do we read it honestly?
We treat attribution as where journey analytics quietly lies. If you add up the revenue Meta claims and the revenue Google claims, you get a number bigger than your actual sales, because each platform grades its own homework.
Three failures distort the path:
Last-click bias: all credit goes to the final touch, starving the top-of-funnel content that created demand.
Double-counting: both Meta and Google claim the same sale, so reported ROAS becomes fiction.
Cookieless gaps: as cookies disappear, cross-device journeys fragment and the path looks cleaner than it is.
The honest read is blended CAC: total marketing spend divided by total new customers, straight from Shopify and your bank. It cannot be gamed by a pixel because it only knows what left your account and what came back.
We explore this tension further in declining platform ROAS versus true profitability. Use platform attribution as a directional story, never as gospel for allocating real cash, and reconcile every number against your actual financial data.
Which customer journey analytics tools fit our store, and what is the ROI of fixing the right leak first?
We believe no single tool wins for everyone, so stop shopping by feature list and pick by the one question you keep failing to answer.
GA4: free but punishing to configure, right for day one.
Amplitude and Fullstory: behavioral depth for funded teams with an analyst.
Triple Whale: unifies marketing and commerce but stops at the finance line.
An AI layer over your warehouse: answers cross-functional why and root-cause questions in plain English.
Whatever you choose, rank leaks by dollars lost, not ease of fix. Take a coffee store with 8,000 monthly carts, a 62 dollar average order value, and 71 percent abandonment. Recovering just 5 percent recovers about 17,600 dollars a month, roughly 211,000 dollars a year, from one shipping-reveal fix.
We compare the landscape in our Triple Whale alternatives guide. One honest limit: we are not an attribution pixel, so pair us with one, and always test accuracy against your raw Shopify and Meta numbers before committing a dollar.
Enjoyed the read? Join our team for a quick 15-minute chat — no pitch, just a real conversation on how we’re rethinking Ecommerce with AI - Luca
Loading Schedule...
Your AI Co-Founder is here.
Here’s why:
Shopify, Meta, Xero - one brain.
"Should I scale?" Answered with real data.
Growth capital. No applications. One click.
Thank you! Your submission has been received! Please book a time slot for the Meeting
Oops! Something went wrong while submitting the form.
.svg)
.svg)


.webp)
.svg)
.webp)

.png)
