Amazon Brand Analytics: Access, Eligibility, Search Terms Reports, Search Query Performance, and Repeat Purchase Data Work and Retention Strategy
14
mins read
In this article
TL;DR
Amazon Brand Analytics is free for all Brand Registry sellers and includes six core reports covering search, behavior, and demographics.
Top Search Terms reveals marketplace-wide keyword demand via Search Frequency Rank; SQP diagnoses your brand's full-funnel performance.
Market Basket Analysis and Repeat Purchase Behavior unlock cross-sell targeting and retention optimization strategies.
ABA provides relative rankings, not absolute search volume; pair with third-party tools for volume-based forecasting.
Data is delayed 3+ days and siloed to Amazon only; use an AI intelligence layer for cross-channel context and real-time decision-making.
SQP and Top Search Terms serve different purposes: discovery vs. diagnosis. Use both together for complete keyword strategy.
Q1: What Is Amazon Brand Analytics and Who Can Access It? [toc=What Is Brand Analytics]
Amazon Brand Analytics (ABA) is a free suite of data dashboards available inside Seller Central and Vendor Central, exclusively for sellers enrolled in Amazon's Brand Registry program. It provides aggregated, first-party customer search and purchase data that cannot be replicated by any third-party tool, giving brand owners a direct window into how shoppers discover, evaluate, and buy products on the marketplace.
Reports Inside the Dashboard
ABA organizes its reports into two primary categories:
Search Analytics:
Search Query Performance (SQP)
Search Catalog Performance
Top Search Terms
Consumer Behavior Analytics:
Repeat Purchase Behavior
Demographics
Market Basket Analysis
Two newer dashboards extend ABA's capabilities further. Customer Loyalty Analytics segments your customer base using RFM methodology (Recency, Frequency, Monetary) into tiers such as Top Tier, Promising, At Risk, and Hibernating. Customer Journey Analytics maps the end-to-end path from Awareness to Consideration to Intent to Purchase at the brand level, a feature Amazon rolled out to help sellers pinpoint exactly where shoppers drop off.
✅ Eligibility Requirements
Not every Amazon seller qualifies. Access requires meeting all of the following criteria:
Brand Registry enrollment with an active or pending registered trademark (word mark or design mark with text) filed through an approved government IP office
Must be the brand owner, not a reseller, wholesaler, or authorized agent
Amazon account must be active and in good standing
Products of that brand must be actively sold on Amazon
For sellers without a registered trademark yet, Amazon's IP Accelerator program can fast-track Brand Registry enrollment
❌ Who Is Excluded
Wholesalers, online arbitrage sellers, dropshippers, and Kindle authors cannot access Brand Analytics, regardless of sales volume.
How to Navigate to Brand Analytics
The access path is straightforward: Seller Central, then Brands tab, then Brand Analytics. Data generally goes back three years, becomes available within three days of the reporting period, and quarter-end data may take up to one week to populate.
The practical challenge, however, is not access, it is synthesis. As one Reddit user noted:
"It feels like Amazon is desperate to give us every possible metric, Search Query Performance, Customer Loyalty Analytics, ad reports, you name it, but none of it talks to each other." u/unknown, r/AmazonFBA Reddit Thread
This is where an intelligence layer becomes essential. Luca AI functions as an AI reasoning layer over your data warehouse, ingesting ABA exports alongside Shopify, Meta, Google Ads, and financial data, then extracting, correlating, and presenting relevant insights from the combined data pool. Its agentic capabilities also push customized ABA-derived reports to Slack or email on a schedule you define, eliminating manual export-and-review cycles entirely.
Q2: What Reports Are Available Inside Brand Analytics (and What Does Each Measure)? [toc=Available Reports Overview]
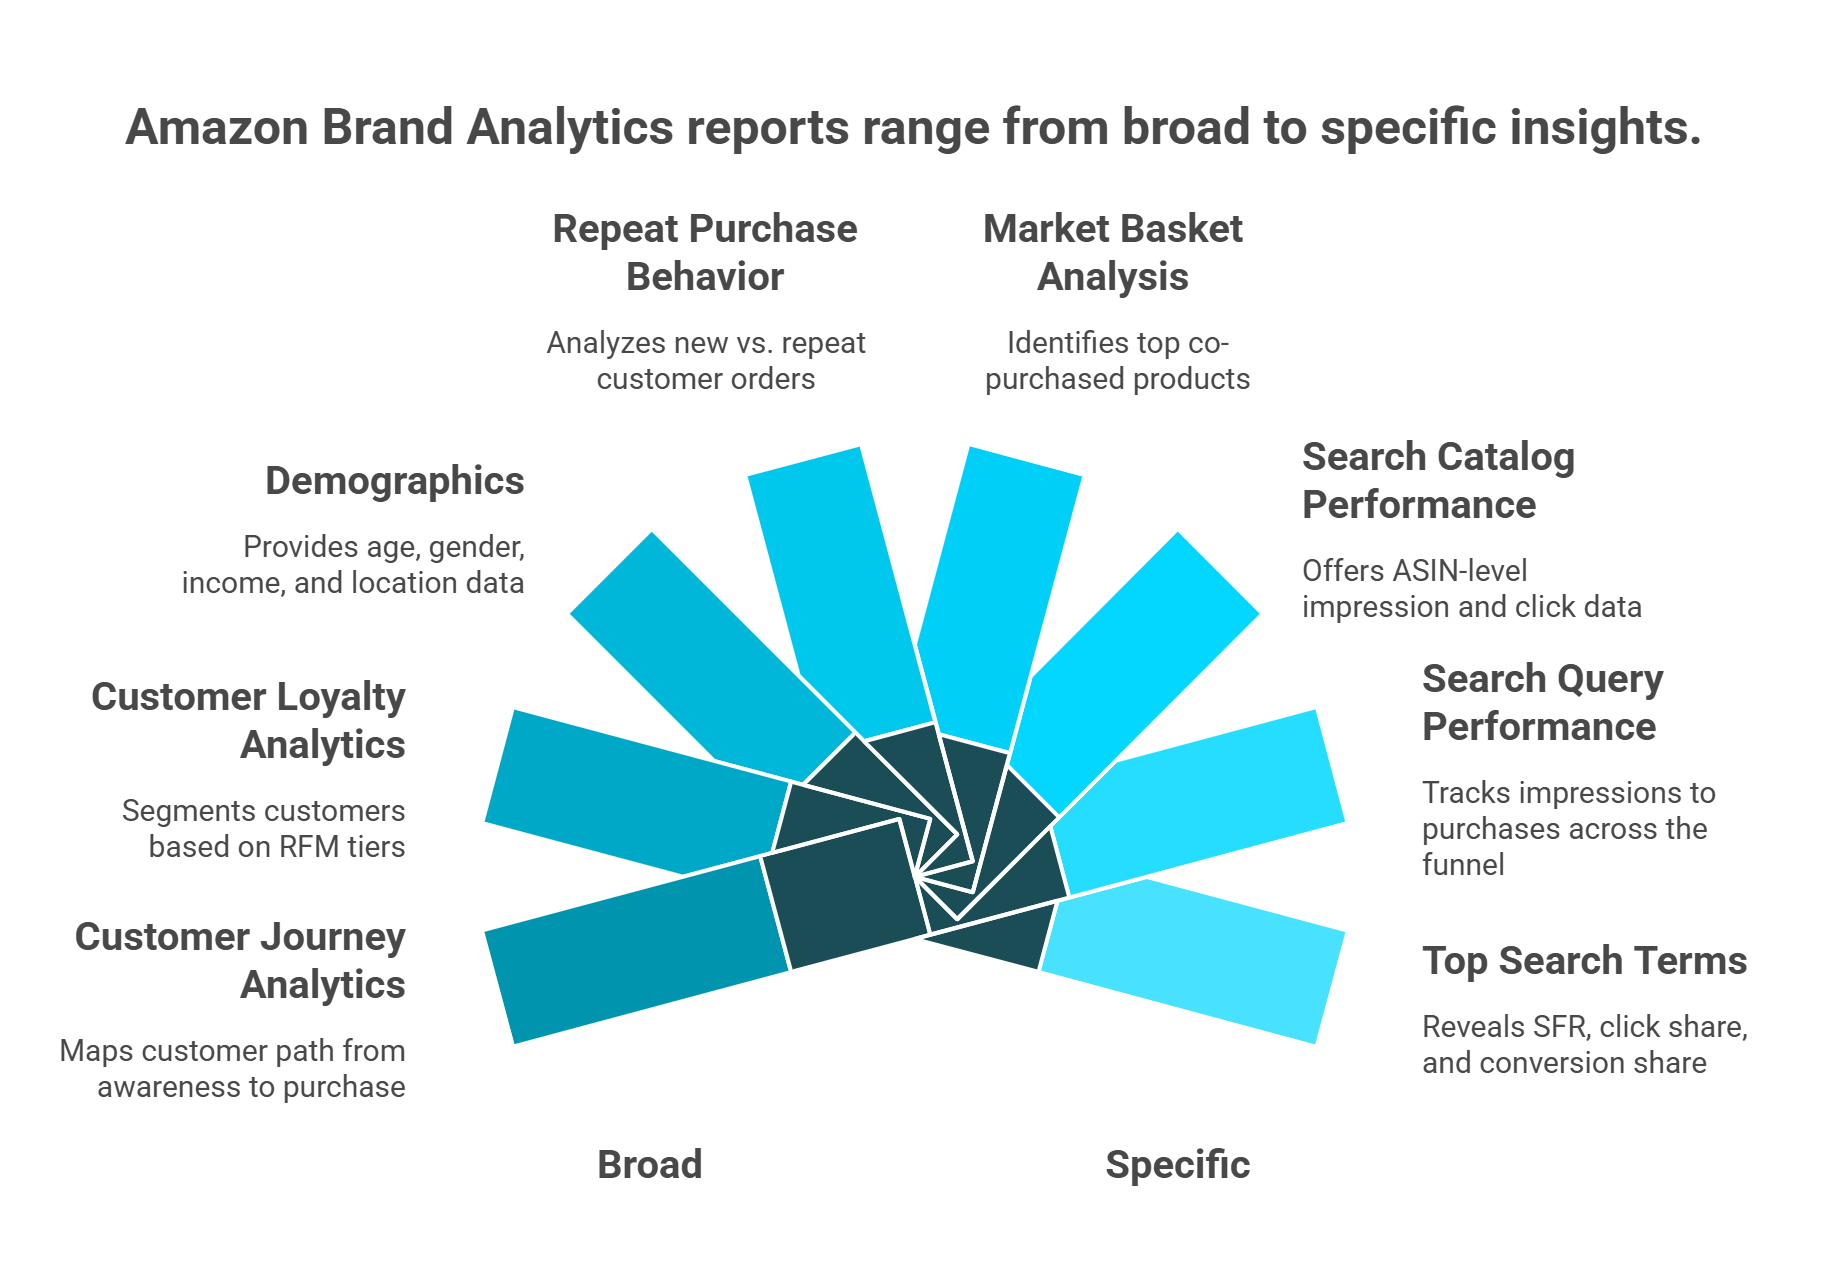
Brand Analytics contains nine distinct reports and dashboards, each measuring a different dimension of customer behavior on Amazon. Understanding what each report measures (and what it does not) is essential before diving into tactical workflows.
Search Analytics Reports
These three reports focus on how customers find products through Amazon's search engine:
Top Search Terms ranks the most popular search terms on Amazon by Search Frequency Rank (SFR) and shows the top three clicked ASINs per term with their Click Share and Conversion Share
Search Query Performance (SQP) provides full-funnel data (impressions to clicks to cart adds to purchases) for search queries where your brand appeared, with Brand Share metrics at each stage
Search Catalog Performance shows how your catalog performs across search, including impression and click data at the ASIN level relative to the total marketplace
Consumer Behavior Analytics Reports
These reports reveal what happens after the click, including purchase patterns, demographics, and cross-purchase behavior:
Repeat Purchase Behavior breaks down orders and revenue from repeat vs. new customers per ASIN
Demographics segments purchasers by age, gender, income, education, marital status, and geography (requires 100+ unique customers)
Market Basket Analysis shows the top three products most frequently purchased alongside your products
Newer Dashboards
Newer Brand Analytics Dashboards
Dashboard
What It Measures
Key Metrics
Strategic Use Case
Customer Loyalty Analytics
RFM-based customer segmentation
Top Tier, Promising, At Risk, Hibernating tier counts and revenue share
Target Brand Tailored Promotions to specific loyalty segments
Customer Journey Analytics
End-to-end funnel from Awareness to Purchase
Branded search volume, detail page views, cart adds, wish list saves, new-to-brand vs. repeat purchases
Identify exactly which funnel stage loses the most shoppers
Amazon Brand Analytics contains nine reports split across two categories. Search Analytics reports reveal how customers find products, while Consumer Behavior reports reveal what customers do after clicking.
⏰ Data Availability and Filtering
Most reports can be filtered by week, month, or quarter. Customer Journey Analytics provides a 12-month rolling window. Data refresh typically lags by three days, with quarter-end periods extending to approximately one week.
While ABA presents each report as a standalone dashboard within Seller Central, Luca AI's intelligence layer cross-references these datasets with external platform data, identifying patterns, predicting trends from historical data, and surfacing root causes that no single Amazon dashboard can reveal on its own. For sellers already using e-commerce analytics platforms, layering ABA data into a unified view is where the real competitive advantage begins.
Q3: How Does the Top Search Terms Report Help You Find High-Converting Keywords? [toc=Top Search Terms Deep Dive]
The Top Search Terms report (formerly the ABA Search Terms report) is the starting point for most Amazon keyword strategies. It shows the most popular search terms on Amazon over a given period, ranked by Search Frequency Rank (SFR), a relative ranking where 1 equals the most searched term on the platform.
Understanding the Core Metrics
For each search term, the report displays the top three clicked ASINs along with two critical percentages:
Click Share the percentage of total clicks that went to each ASIN after customers searched that term
Conversion Share the percentage of total conversions (purchases) that each ASIN captured from that search term
⚠️ Important distinction: SFR is relative, not absolute. You know that a term with SFR 500 is searched more frequently than one with SFR 5,000, but you do not know the actual search volume count. Pairing SFR with a third-party tool like Helium 10 can fill this gap.
Three Tactical Use Cases
1. Keyword Discovery Filter the report for terms relevant to your category with high SFR where your ASIN does not appear in the top three clicked. These are visibility gaps, search terms where customers are actively shopping, but your product is invisible.
2. Competitor Intelligence For your target keywords, examine which ASINs dominate click share and conversion share. Reverse-engineer their listing elements, including main image quality, title structure, bullet point copy, review count, and price, to understand what earns the click and the sale.
3. Listing Optimization This is where the data becomes surgical. If your ASIN appears in the top three clicked but has low conversion share relative to competitors, the problem is not visibility, it is your listing. The traffic is arriving; your listing is not closing the deal.
A Worked Example
Consider this scenario:
Top Search Terms Worked Example
Metric
Your ASIN
Top Competitor
Search Term
"organic protein powder" (SFR 3,200)
-
Click Share
18%
22%
Conversion Share
8%
25%
Your ASIN is getting nearly as many clicks as the leader, but converting at roughly one-third the rate. Increasing ad spend on this keyword would be throwing money at a leaky bucket. Instead, audit your listing:
Compare main image quality and angle
Check price competitiveness (is the competitor running a coupon?)
Evaluate review count and rating differential
Assess A+ Content depth and quality
The data is telling you exactly where the problem lives, spend effort on conversion, not on more traffic.
As one seller described the challenge of making sense of the raw report:
"Just looking at STR is so scary. A lot of columns and data that feel me overwhelmed. I don't know what is the important one, which one I should focus on." -u/unknown, r/AmazonFBA Reddit Thread
How Luca AI Simplifies This
Luca AI automates this comparison across hundreds of keywords simultaneously, flagging conversion-share gaps through predictive pattern recognition and surfacing the specific listing elements most likely causing underperformance based on historical data analysis across your catalog. Rather than manually exporting CSVs and building pivot tables, you ask a question and get a prioritized action list.
Q4: What Does the Search Query Performance Report Reveal About Your Funnel? [toc=SQP Funnel Analysis]
The Search Query Performance (SQP) report is the only native Amazon dashboard that provides full-funnel data, from impressions through clicks, cart adds, and purchases, for search queries where your brand appeared. Where the Top Search Terms report shows you the marketplace at large, SQP shows you your brand's specific performance within it.
Understanding the Two Views
SQP offers two distinct perspectives:
Brand View aggregates your brand's performance across all ASINs for each search query
ASIN View breaks performance down to individual products, revealing which ASIN converts best for which keyword
Key Metrics Defined
SQP Key Metrics
Metric
What It Means
Total Count
The total number at each funnel stage across all brands for that query
Brand Count
Your brand's specific number at each funnel stage
Brand Share
Your percentage of total (Brand Count divided by Total Count)
Search Query Score
Amazon's indicator of individual keyword performance (1 to 1,000 = high volume)
As one community analysis explained:
"Now, Amazon gives us the exact search query volume. More importantly, it shows your Market Share at every stage of the funnel, Impressions, Clicks, Add-to-Carts, Purchases." -u/blahxxblah, r/SellerMate_AI Reddit Thread
The real power of Brand Analytics emerges when you stop analyzing each report in isolation and start connecting them in sequence: discover where to compete, diagnose why you are losing, then prioritize by which keywords build long-term customer value.
✅ Diagnostic Decision Framework
This is where SQP becomes a funnel diagnostic tool. Each drop-off point signals a specific problem:
SQP Funnel Diagnostic Framework
Funnel Drop-Off
Likely Cause
Recommended Fix
⚠️ High impressions, Low click share
Main image or title is weak relative to competitors
A/B test main image; revise title to include benefit-driven keywords
⚠️ High clicks, Low cart adds
Price, review count, or A+ Content not competitive
Confirm keyword is in listing backend; increase PPC bid to gain initial visibility
This "if metric X is weak, do Y" framework turns raw SQP data into a structured action plan rather than a wall of numbers.
How SQP Differs from Top Search Terms
SQP vs Top Search Terms Comparison
Dimension
Top Search Terms
Search Query Performance
Scope
Marketplace-wide (all brands)
Brand-centric (only your brand)
Shows
Top 3 clicked ASINs per search term
Your full funnel metrics per query
Best for
Discovering new keyword opportunities
Diagnosing existing visibility performance
Limitations
If you're not in the top 3 clicked, you're invisible
Only shows queries where you already appeared
Use Top Search Terms to find where you should be. Use SQP to diagnose how well you perform where you already are.
How Luca AI Adds Depth
Luca AI ingests SQP data and performs automated root-cause analysis on funnel drop-offs, identifying which specific stage is underperforming, which influencing components (image, price, reviews, fulfillment method) are most likely responsible, and simulating the projected impact of specific fixes based on historical patterns across your catalog. Instead of manually comparing dozens of queries across two report views, you ask: "Which of my keywords have the biggest gap between click share and purchase share, and what's the most likely cause?" and receive a prioritized diagnosis in seconds. For tracking unit economics alongside these funnel metrics, an integrated AI-powered approach eliminates the manual triangulation that slows most Amazon sellers down.
Q5: How Can Repeat Purchase Behavior Data Strengthen Your Retention Strategy? [toc=Repeat Purchase Retention]
The Repeat Purchase Behavior report is the most under-utilized dashboard in Amazon Brand Analytics and arguably the most valuable for sellers with consumable or replenishable products. It breaks down, for each ASIN, the number of orders and revenue generated by repeat customers vs. new customers over a selected period.
Key Metrics at a Glance
Unique Customers total number of distinct buyers
Repeat Customers buyers who placed more than one order
Repeat Purchase Sales ($) total revenue from repeat buyers
Repeat Purchase Units total units sold to repeat buyers
% Share of Total Sales from Repeats the retention ratio
Data can be filtered by week, month, or quarter and compared across periods to spot trends. A declining repeat percentage period-over-period is a leading indicator that competitors may be stealing customers, product quality may be slipping, or pricing has shifted unfavorably.
Four Tactical Applications
1. Identify "Loyalty-Anchor" SKUs Sort by Revenue from Repeat Purchases in descending order. Products at the top are your retention engines. They warrant aggressive Subscribe and Save enrollment pushes and Brand Tailored Promotions targeting the "Promising" and "At Risk" customer segments.
2. Spot "One-and-Done" Products ASINs with near-zero repeat rates reveal a different story. These products may need post-purchase inserts directing customers to complementary products, variation offerings (different sizes/flavors), or bundling with a high-repeat-rate SKU.
3. Track Cohort-Level Trends As one seller shared when analyzing their own consumables data:
"Looking at a 90 day cohort (only including customers who have had 90 days transpire from first purchase), we have a 30% repeat purchase rate." -u/ctb6xe, r/FulfillmentByAmazon Reddit Thread
Tracking this metric over time is essential. If your 90-day repeat rate drops from 30% to 22%, you need to investigate immediately before it shows up as revenue decline.
💰 Connect Repeat Data to LTV and Bidding Strategy
4. Inform Keyword Bid Allocation via LTV If Product A has a 40% repeat rate and $25 AOV, the effective customer value is substantially higher than a single $25 order. For products with a high probability of repeat purchases, you can invest more money in the first conversion, as this product will continue to generate further revenue after the first purchase. This should change how aggressively you bid on keywords associated with that ASIN. Understanding unit economics at this level is what separates profitable scaling from blind spending.
Pairing with Customer Loyalty Analytics
Cross-reference Repeat Purchase data with the Customer Loyalty Analytics dashboard's RFM tiers. Identify which specific ASINs drive the most Top Tier customers, then use that insight to design Brand Tailored Promotions offering personalized promo codes to "At Risk" segments specifically on your highest-repeat-rate ASINs before those customers churn.
How Luca AI Adds Predictive Depth
Luca AI's predictive layer can forecast which ASINs are trending toward declining repeat rates before it surfaces in monthly reports, using pattern recognition across historical purchase velocity, review sentiment, and competitive pricing shifts. Rather than reacting to a retention drop weeks after it begins, Luca pushes an alert to your Slack or email so you act proactively.
Q6: How Do Search Terms, Search Query Performance, and Repeat Purchase Data Work Together? [toc=Unified Report Strategy]
It is 9 PM on a Wednesday. A brand manager selling organic dog treats has three Brand Analytics reports open in three separate browser tabs. The Top Search Terms report shows her product ranks for "organic dog treats" with a respectable 15% click share. The SQP report shows impressions are strong for that keyword, but cart adds have dropped 20% over the past month. The Repeat Purchase report shows this product actually has the highest repeat rate in her entire catalog, 38% of buyers reorder within 90 days.
She analyzes each report independently and concludes: "My search visibility is fine, cart adds are slipping, and retention is strong." She moves on.
The real power of Brand Analytics emerges when you stop analyzing each report in isolation and start connecting them in sequence: discover where to compete, diagnose why you are losing, then prioritize by which keywords build long-term customer value.
⚠️ The Insight She Missed
By treating each report in isolation, she missed the critical three-way connection: this is a high-LTV keyword she should be bidding on more aggressively (retention data), but her listing is failing to convert the traffic she already has (funnel data), while competitors are slowly gaining click share on this exact term (search data). The correct action is not "do nothing" it is "fix the listing immediately and increase bids once conversion recovers, because every new customer acquired through this keyword is worth 38% more than a one-time buyer."
Why This Problem Exists
Amazon presents each report as a standalone dashboard with no built-in cross-referencing. There is no native way to overlay keyword SFR data with funnel metrics and retention signals simultaneously. The seller becomes the manual integration layer, exporting CSVs, building pivot tables, and still missing the three-way connections. This is precisely why e-commerce founders are drowning in data without gaining clarity.
As one frustrated seller put it:
"How do you all handle Amazon's overwhelming raw data without losing your mind? I feel like I'm drowning in reports." -u/unknown, r/AmazonFBA Reddit Thread
💸 The Hidden Costs of Siloed Analysis
⏰ Time cost 3 to 5 hours/week manually cross-referencing three reports
Budget misallocation bidding equally on all keywords when some drive 3x more repeat buyers
Missed keyword-to-retention signals spending ad dollars on keywords that acquire one-time buyers instead of concentrating on keywords that build a loyal customer base
✅ The Unified Three-Step Workflow
Three-Step Cross-Report Workflow
Step
Report Used
Action
Output
1. Discovery
Top Search Terms
Identify high-SFR keywords where you have low/no click share
New visibility opportunities
2. Diagnosis
Search Query Performance
Cross-reference those keywords to find where your funnel breaks (impressions to clicks to carts to purchases)
Specific fix per keyword (image, price, reviews, fulfillment)
3. Prioritization
Repeat Purchase Behavior
Map converting keywords to repeat purchase rates to identify which keywords acquire high-LTV vs. one-time customers
Keyword has high SFR + low click share new opportunity, bid aggressively
Keyword has high impressions + low conversion share fix listing before increasing spend
Keyword drives high first-purchase + high repeat rate top-priority keyword, maximize budget
How Luca AI Automates This Synthesis
Luca AI ingests ABA exports alongside ad spend data and applies cross-dataset pattern recognition, enabling queries like "Which of my top 20 keywords by spend drive the highest repeat purchase rate?" or "Show me keywords where my funnel drops at cart-add stage but repeat rate exceeds 30%". These questions take four or more hours to answer manually. With an AI reasoning layer over the combined dataset, they take seconds. Luca's agentic capabilities can also push a weekly "cross-report insights" digest to Slack or email, highlighting the highest-priority keyword-funnel-retention connections without you ever opening Seller Central.
From three isolated dashboards to one connected strategy, that is the shift from reporting to reasoning.
Q7: How Can You Turn ABA Insights Into Smarter PPC and Ad Campaigns? [toc=ABA to PPC Workflows]
Brand Analytics data becomes most powerful when it directly informs how you structure, bid on, and optimize Amazon PPC campaigns. The following four workflows translate ABA reports into concrete advertising actions.
Workflow 1: Keyword List Building from Top Search Terms
Export the Top Search Terms report and filter by SFR ranges relevant to your category:
SFR 1 to 5,000 high-volume head terms (competitive, high spend required)
SFR 5,000 to 50,000 mid-tail opportunities (lower competition, strong intent)
SFR 50,000+ long-tail niche terms (low volume but potentially high conversion)
Cross-reference this export against your existing Sponsored Products campaign keyword list. Any high-SFR relevant term where you have no active bid is an immediate campaign addition. Also run the reverse: find keywords you are currently bidding on that have very low SFR. These represent wasted spend on terms customers rarely search.
Workflow 2: Bid Strategy from Funnel Data
Use SQP conversion share data to set tiered bids based on a decision framework:
SQP-Based Bid Strategy Framework
Scenario
SQP Signal
Bid Action
✅ High Conversion Share + High Repeat Rate (from Q5)
Strong funnel + loyal customers
Scale bids aggressively, this keyword acquires high-LTV customers
⚠️ High Impressions + Low Conversion Share
Traffic exists but listing underperforms
Do NOT increase bids, fix listing first, then scale
⚠️ Low Click Share on High-SFR Term
Opportunity exists but you lack visibility
Increase bids to gain initial visibility, monitor conversion closely
❌ Impressions + Near-Zero Purchases
Irrelevant traffic or fundamental mismatch
Add as negative keyword to eliminate wasted spend
As one experienced seller advised:
"Optimize your listing: EVERYTHING from your title, to your description, to your backend keywords, etc play a major role on how Amazon ranks and indexes your product." -u/Silent-Possession593, r/FulfillmentByAmazon Reddit Thread
Workflow 3: Negative Keywords from SQP
SQP reveals search queries where your brand received impressions but generated near-zero purchases. These are candidate negative keywords for Sponsored Products campaigns. Adding them as negative exact match prevents your ads from showing on irrelevant queries, reducing wasted ad spend and improving overall ACoS. For sellers tracking platform ROAS vs. true profitability, this is one of the fastest wins available.
Workflow 4: Product Targeting from Market Basket Analysis
Market Basket data identifies products frequently purchased alongside yours. This unlocks two Product Targeting strategies:
Complementary targeting run Sponsored Display ads on the complementary ASINs shown in your Market Basket report (customer intent is already aligned)
Competitor conquest target competitor ASINs that appear in the top three clicked for your target keywords in the Top Search Terms report (these are the products stealing your click share)
As one seller confirmed:
"Market Basket Analysis is basically a cheat sheet. We've used it to uncover bundle ideas that were already 'working' in the customer's mind, we just hadn't packaged them yet." -u/unknown, r/FulfillmentByAmazon Reddit Thread
How Luca AI Enhances PPC Optimization
Luca AI identifies these cross-report PPC opportunities through automated pattern analysis, surfacing bid-waste patterns proactively and simulating the projected impact of bid changes before you commit budget. It finds both areas of improvement and well-optimized areas where results are already strong, so you know where to intervene and where to let performance run.
Q8: What Do Market Basket, Demographics, Customer Loyalty, and Customer Journey Analytics Add? [toc=Supporting ABA Reports]
Beyond the three core reports deep-dived above, Brand Analytics includes four additional dashboards that round out your customer intelligence. Most competitor guides mention these briefly or skip them entirely, particularly the two newer dashboards.
Market Basket Analysis
This report shows the top three products customers most frequently purchase alongside your products in the same transaction. Two immediate strategic uses:
Bundle creation if Product A is consistently bought with Product B, create an Amazon virtual bundle or multi-pack to increase AOV and capture both sales in one listing
Product Targeting ads run Sponsored Display campaigns on the complementary ASINs appearing in your Market Basket report, knowing customer intent is already aligned
The analysis also reveals competitive intelligence: if customers frequently purchase a competitor's product alongside yours, that competitor is a prime target for conquest advertising.
Demographics Report
Breaks down purchasers by age, gender, household income, education level, marital status, and geography. Requires a minimum of 100 unique customers to populate.
The strategic value is alignment verification. If your listing imagery, A+ Content tone, and off-Amazon ad creative are designed for 25 to 34 year-old women, but your Demographics report shows 45 to 54 year-old men are your primary buyers, your creative is misaligned with your actual customer. Adjust accordingly. For brands running cross-channel campaigns, this data should inform your marketing analysis and automation strategy beyond Amazon.
⭐ Customer Loyalty Analytics
This newer dashboard segments your customer base using RFM methodology (Recency, Frequency, Monetary) into four tiers:
Customer Loyalty Analytics RFM Tiers
Tier
Definition
Strategic Action
Top Tier
Most recent, most frequent, highest spend
Reward with exclusive access or early product launches
Promising
Growing engagement, moderate spend
Accelerate with Brand Tailored Promotions (10 to 20% discount)
At Risk
Previously active, declining engagement
Intervene immediately with re-engagement promotions before churn
Hibernating
No recent activity, low frequency
Win-back campaign or accept natural churn
Brand View shows overall tier distribution; Segment View lets you deep-dive into each tier's metrics and Amazon's predicted future spending patterns. Pair these tiers with Brand Tailored Promotions to send personalized promo codes to specific segments. The "At Risk" tier is where intervention has the highest ROI. Understanding these segments is critical for optimizing sales performance across your catalog.
⭐ Customer Journey Analytics
The newest addition to Brand Analytics maps the end-to-end customer journey from Awareness to Consideration to Intent to Purchase at the brand level:
Awareness tracks branded searches, detail page views from non-purchasers, and branded search ratio (a signal of growing brand recognition)
Consideration shows customers who viewed your brand store or detail pages, including Amazon's "high-potential customer" predictions based on 100+ behavior attributes
Intent measures cart adds and wish list saves
Purchase breaks down new-to-brand vs. repeat customers with revenue attribution
Customer Journey Analytics maps exactly where shoppers drop off between awareness and purchase. The funnel visualization reveals whether your bottleneck is consideration (they never visited), intent (they visited but never carted), or purchase (they carted but abandoned).
Each stage includes drop-off percentages and Amazon's own recommended actions to improve conversion. If 32,000 customers are aware of your brand but only 2,000 purchase, the journey flow reveals exactly where the 30,000 drop off and whether the bottleneck is consideration (they never visited your detail page), intent (they visited but never added to cart), or purchase (they added to cart but abandoned).
How Luca AI Connects These Four Datasets
Luca AI synthesizes all four dashboards simultaneously, identifying which customer segments from Loyalty Analytics are dropping off at which journey stage, and simulating the revenue impact of targeted interventions before you invest budget. Instead of toggling between four separate dashboards and manually connecting the dots, you ask a single question and get a cross-dataset answer.
Q9: What Are the Limitations of Amazon Brand Analytics (and How Do You Work Around Them)? [toc=ABA Limitations and Workarounds]
Amazon Brand Analytics is powerful but not complete. It provides relative rankings instead of absolute numbers, reports with multi-day lag, and siloed dashboards that cannot connect to your broader business context. Understanding these constraints helps you plan around them rather than make flawed decisions from incomplete data.
ABA is powerful but structurally incomplete. Understanding these five constraints before you start means building workarounds into your workflow from day one, rather than discovering blind spots after making flawed decisions.
❌ Limitation 1: Relative Rankings, Not Absolute Volume
Search Frequency Rank tells you keyword A is searched more than keyword B but not how many times either was searched. This makes it difficult to forecast traffic potential or calculate expected impressions from ranking improvements.
As one seller confirmed:
"I am 99% sure it is just taking the search terms report from Brand Analytics and doing some basic napkin math back out from search rank to search volume." -u/Spleezo, r/FulfillmentByAmazon Reddit Thread
✅ Workaround: Pair ABA's SFR data with a third-party tool like Helium 10 or Jungle Scout for estimated absolute search volume. Use SFR for relative prioritization and third-party estimates for volume-based forecasting.
❌ Limitation 2: Data Is Not Real-Time
Brand Analytics reports are delayed by 3+ days, and quarter-end data can take up to a week. Amazon Ads conversion data itself can take up to 14 days to fully settle, with the top 5% of campaigns seeing revenue figures shift by at least 18.75% after initial reporting.
One seller flagged this directly:
"According to Amazon's usual timeline, Brand Analytics data should be available within 72 hours after the close of a given period. It's now well past that window, but I'm still not seeing any Q2 2025 data." -Seller, Amazon Seller Central Forums Amazon Seller Forums
✅ Workaround: Use ABA for strategic (not reactive) decisions. Pair with Amazon Ads console real-time metrics for tactical, same-day bid adjustments. For sellers who need AI-powered forecasting to bridge reporting gaps, predictive models can estimate current-state performance from historical trends.
❌ Limitation 3: Top-3 ASIN Visibility Ceiling
The Top Search Terms report only displays the top three clicked ASINs per search term. If your product ranks 4th or lower in click share, it is completely invisible in this report.
✅ Workaround: Use the Search Query Performance report instead. SQP shows your brand's funnel data regardless of your click-share ranking.
⚠️ Limitation 4: Data Overload at Scale
Sellers managing 50+ ASINs across hundreds of keywords face thousands of data rows without automated prioritization. Manual CSV exports and pivot tables become a weekly time sink. This is a core reason e-commerce founders are drowning in data without gaining actionable clarity.
✅ Workaround: Export to structured spreadsheets with conditional formatting, or use an AI intelligence layer for automated pattern recognition and anomaly detection.
❌ Limitation 5: No Cross-Channel Context
ABA is Amazon-only. It cannot connect to DTC (Shopify), paid media (Meta, Google), email (Klaviyo), or financial data (Xero, QuickBooks). This means Amazon performance is always analyzed in isolation from the rest of your business.
✅ Workaround: Requires a unifying intelligence layer that spans platforms. Sellers running multi-channel operations need their analytics platforms to contextualize Amazon data within the full business picture.
How Luca AI Addresses These Gaps
Luca AI directly solves limitations 4 and 5, functioning as an AI reasoning layer over your complete data warehouse. By ingesting ABA exports alongside Shopify, Meta, Google, and financial data, it eliminates data overload through automated prioritization and pattern recognition, and solves the cross-channel gap by contextualizing Amazon performance within your total business picture. Its predictive capabilities also partially mitigate the reporting-lag limitation by forecasting current-state performance from historical trends and pushing proactive alerts to Slack or email before lagging data arrives.
Below are the most common questions sellers ask about Amazon Brand Analytics, structured for quick reference. Each answer is concise and factual, based on Amazon's official documentation and verified seller experience.
⭐ Is Amazon Brand Analytics Free?
Yes. ABA is completely free for all sellers enrolled in Amazon Brand Registry. There is no separate subscription, add-on fee, or tiered pricing. Amazon provides it at no cost to encourage Brand Registry enrollment and help sellers improve listing quality across the marketplace.
❌ Can Resellers or Wholesalers Access Brand Analytics?
No. Only brand owners enrolled in Brand Registry can access ABA. Resellers, wholesalers, online arbitrage sellers, dropshippers, and Kindle authors are excluded, regardless of their sales volume or account history.
⏰ How Often Is Brand Analytics Data Updated?
Data is generally available within 3 days of the reporting period. Quarter-end data may take up to one week to populate. For most reports, data can be filtered by week, month, or quarter. Customer Journey Analytics uses a 12-month rolling window.
What Is the Difference Between SQP and Top Search Terms?
This is the most common point of confusion among sellers. The key distinction:
Use Top Search Terms to find where you should be. Use SQP to diagnose how well you perform where you already are.
✅ Can I Export Amazon Brand Analytics Data?
Yes. All ABA reports can be downloaded as CSV files directly from Seller Central. This enables further analysis in spreadsheets, Google Sheets, or third-party analytics tools. The export function is available on every report page via the download button.
Does Brand Analytics Show Actual Search Volume Numbers?
No. Brand Analytics provides Search Frequency Rank (a relative ranking) rather than absolute search volume counts. SFR 1 = the most-searched term on Amazon. SFR 100,000 = a less popular term. But you cannot determine whether SFR 1 represents 5 million searches or 500,000 searches from ABA alone. The newer Search Query Volume metric in SQP provides directional volume indicators but still is not an absolute count.
💰 How Can I Use Brand Analytics Data for PPC Campaigns?
Three primary workflows connect ABA to PPC strategy:
Top Search Terms to Keyword Discovery identify high-SFR terms you are not bidding on
SQP to Negative Keywords find queries where you get impressions but zero purchases and add them as negative exact match
Market Basket Analysis to Product Targeting run Sponsored Display ads on complementary ASINs frequently co-purchased with your products
See sections Q3, Q4, and Q7 of this guide for detailed, step-by-step workflows for each.
How Luca AI Enhances the ABA Workflow
For sellers who want to move beyond manual CSV exports and spreadsheet analysis, Luca AI transforms ABA data into an interactive, queryable intelligence layer. Ask natural-language questions like "Which keywords have my highest click share but lowest conversion share?" and receive instant cross-report answers. Luca's agentic capabilities also deliver automated weekly digests via Slack or email, surfacing the highest-priority insights without requiring you to open Seller Central.
FAQ's
How do we use Amazon Brand Analytics to find profitable PPC keywords?
We use Amazon Brand Analytics to surface high-opportunity PPC keywords through a structured three-step workflow that connects ABA reports directly to advertising strategy.
Top Search Terms for keyword discovery: We filter the Top Search Terms report by Search Frequency Rank (SFR) to identify high-traffic keywords we are not currently bidding on. Any keyword with a strong SFR where our ASIN does not appear in the top three clicked products represents a gap we can target with Sponsored Products or Sponsored Brands campaigns.
SQP for negative keyword identification: We review the Search Query Performance report to find queries where our products receive impressions but generate zero purchases. These underperforming queries get added as negative exact match keywords to eliminate wasted ad spend.
Market Basket Analysis for product targeting: We identify complementary ASINs that customers frequently purchase alongside our products and run Sponsored Display ads targeting those ASINs to capture cross-sell opportunities.
For sellers managing dozens of ASINs across hundreds of keywords, this manual process can consume hours weekly. We built Luca AI's marketing analysis capabilities to automate this keyword prioritization workflow, surfacing the highest-impact opportunities without requiring manual CSV exports or pivot table analysis.
What is the difference between Search Query Performance and Top Search Terms in Amazon Brand Analytics?
This is the single most common point of confusion among Amazon sellers using Brand Analytics. We break the distinction down across four dimensions to make it clear.
Scope: Top Search Terms is marketplace-wide, showing data across all brands. Search Query Performance (SQP) is brand-specific, showing only your brand's funnel metrics.
Visibility: Top Search Terms displays only the top three clicked ASINs per keyword. SQP shows your full-funnel performance regardless of where you rank in click share.
Metrics: Top Search Terms provides Search Frequency Rank, Click Share, and Conversion Share. SQP provides Impressions, Clicks, Cart Adds, Purchases, and Brand Share percentages.
Use case: Top Search Terms helps us discover where we should be competing. SQP helps us diagnose how well we perform where we already appear.
We recommend using both reports together. Start with Top Search Terms to identify high-SFR keywords where your brand is absent, then use SQP to diagnose conversion bottlenecks on keywords where you already have visibility. For sellers who want these cross-report insights surfaced automatically, Luca AI's data analysis layer can answer natural-language questions spanning both reports instantly.
Does Amazon Brand Analytics show actual search volume numbers?
No. Amazon Brand Analytics does not provide absolute search volume counts. Instead, it provides Search Frequency Rank (SFR), which is a relative ranking system. SFR 1 represents the most-searched term on Amazon, while SFR 100,000 represents a less popular term. However, we cannot determine from ABA alone whether SFR 1 represents 5 million searches or 500,000 searches.
The newer Search Query Volume metric available inside the Search Query Performance report provides directional volume indicators, but it is still not an absolute count. This is one of the most significant limitations of ABA for sellers who need to forecast traffic potential or calculate expected impressions from ranking improvements.
We recommend pairing ABA's SFR data with a third-party tool like Helium 10 or Jungle Scout for estimated absolute search volume. Use SFR for relative keyword prioritization and third-party estimates for volume-based forecasting. For sellers managing large keyword portfolios across multiple products, the right analytics tools can automate this data synthesis rather than requiring manual cross-referencing between platforms.
Who is eligible to access Amazon Brand Analytics and is it free?
Amazon Brand Analytics is completely free for all sellers enrolled in Amazon Brand Registry. There is no separate subscription, add-on fee, or tiered pricing. Amazon provides it at no cost to encourage Brand Registry enrollment and help sellers improve listing quality across the marketplace.
However, eligibility is restricted exclusively to brand owners. The following seller types cannot access ABA regardless of their sales volume or account history:
Resellers and wholesalers
Online arbitrage sellers
Dropshippers
Kindle authors
To qualify, we must first complete Amazon Brand Registry enrollment, which requires an active registered trademark in the country where we want to enroll. Once Brand Registry is approved, ABA reports become accessible through the Brand Analytics section of Seller Central under the main navigation menu.
While ABA provides powerful marketplace data at no cost, it operates in isolation from our other business systems. Sellers who also run Shopify stores or use Meta and Google for paid acquisition need a unified analytics platform to contextualize Amazon performance within their broader business operations.
How do we use the Repeat Purchase Behavior report to improve customer retention on Amazon?
The Repeat Purchase Behavior report inside Amazon Brand Analytics reveals which of our products generate the highest percentage of repeat customers and how frequently those repeat purchases occur. We use this data to make three strategic retention decisions.
Identify retention anchors: Products with the highest repeat purchase rates become our retention anchors. We prioritize these ASINs for Subscribe and Save enrollment, premium A+ Content investment, and defensive PPC bidding to protect against competitor conquest campaigns.
Optimize Subscribe and Save pricing: When repeat purchase data shows a product has strong natural replenishment behavior, we can offer more aggressive Subscribe and Save discounts knowing the lifetime value justifies the upfront margin reduction.
Diagnose retention failures: Products with high first-purchase volume but low repeat rates signal potential quality issues, pricing misalignment, or listing expectation gaps that we need to investigate and resolve.
For sellers managing large catalogs, manually tracking repeat purchase trends across 50+ ASINs becomes unsustainable. Luca AI's product management capabilities can automate this monitoring, flagging retention anomalies and surfacing the highest-priority ASINs for intervention before repeat purchase rates deteriorate further.
Enjoyed the read? Join our team for a quick 15-minute chat — no pitch, just a real conversation on how we’re rethinking Ecommerce with AI - Luca
Loading Schedule...
Your AI Co-Founder is here.
Here’s why:
Shopify, Meta, Xero - one brain.
"Should I scale?" Answered with real data.
Growth capital. No applications. One click.
Thank you! Your submission has been received! Please book a time slot for the Meeting
Oops! Something went wrong while submitting the form.
.svg)
.svg)

.png)
.png)
.png)
.png)

.svg)
.webp)

.png)
