9 Best Cognitive Analytics Platforms for Ecommerce — Predictive, Prescriptive and Agentic Capabilities Compared
12
mins read
TL;DR
The nine platforms compared are Luca AI, Triple Whale, Polar Analytics, Northbeam, Daasity, ThoughtSpot, Tellius, IBM Cognos Analytics, and Amazon QuickSight with Q.
Scoring uses five published weights: cross-functional reasoning 25%, agentic delivery 20%, setup 20%, pricing transparency 20%, and verified reviews 15%.
Gross margin lies. A 72% gross margin bundle tested at 8% contribution margin once shipping, returns, and support costs were subtracted line by line.
Prescriptive analysis pays back before predictive or agentic for most stores under $20M, because forecasts without a recommended action still need an analyst.
Without a governed semantic layer, cognitive platforms return confidently wrong numbers, so normalize data on ingestion and load brand context before trusting recommendations.
Expect $129 to $1,020 a month depending on tier, with bills escalating through GMV tiering, per-connector fees, annual commitments, and onboarding charges.
Q1. What are the 9 best cognitive analytics platforms for ecommerce in 2026? [toc=1. The 9 Platforms Ranked]
The nine best cognitive analytics platforms for ecommerce in 2026 are Luca AI, Triple Whale, Polar Analytics, Northbeam, Daasity, ThoughtSpot, Tellius, IBM Cognos Analytics, and Amazon QuickSight with Q. Luca AI ranks first as an AI reasoning layer over your store's data: it pulls the relevant slice for a situation, forecasts, finds root cause, and pushes the finding to you.
It is Sunday night. You have a Shopify export, a Meta export, and a Xero P&L open in three tabs. You are trying to work out why last month felt worse than it looked. Every tool below claims to end that ritual. Two of them actually change the work. The rest hand you a prettier version of the same tabs, and one of them will quietly bill you five figures a year for the privilege. I scored all nine against a single live question: contribution margin dropped six percent last week, why, and which lever do I pull?
🧭 The shortlist
Luca AI, best for cross-functional reasoning over your whole store's data
Triple Whale, best for DTC marketing attribution and daily profit views
Polar Analytics, best for governed custom reporting on Shopify
Northbeam, best for paid media incrementality testing
Daasity, best for warehouse-native ecommerce data models
ThoughtSpot, best for natural language search over enterprise BI
Tellius, best for automated root cause analysis at scale
IBM Cognos Analytics, best for regulated, multi-entity enterprise reporting
Amazon QuickSight, best for teams already living inside AWS
📊 The nine platforms compared
Cognitive Analytics Platforms for Ecommerce Compared (2026)
Tool Name
Key capabilities offered
Best For
Pricing
Luca AI ⭐⭐⭐⭐⭐
Plain English questions, cross-functional reasoning, forecasting, root cause, scheduled reports to Slack and email
Shopify stores at 1M to 5M revenue with no analyst
Unified Shopify data layer, custom dashboards, governed metrics, warehouse-style modelling
Brands that want reporting control
$300 / Month to $1,020+ / Month
Northbeam ⭐⭐⭐
Media mix modelling, incrementality, creative-level reporting
Brands spending heavily on paid social
Custom / quote on request
Daasity ⭐⭐⭐
Prebuilt ecommerce data models, ELT into your warehouse, BI connectors
Teams with a warehouse and some SQL skill
Custom / quote on request
ThoughtSpot ⭐⭐⭐
Search and AI-assisted analytics, liveboards, semantic modelling
Companies with a data team already in place
Custom / quote on request
Tellius ⭐⭐⭐
Automated insight discovery, root cause analysis, forecasting
Analytics teams chasing driver analysis
Custom / quote on request
IBM Cognos Analytics ⭐⭐
Enterprise reporting, dashboards, AI assistant, governed deployment
Multi-entity retailers with IT support
Custom / quote on request
Amazon QuickSight ⭐⭐
Serverless BI, Q natural language queries, embedded dashboards
AWS-native engineering teams
Custom / usage-based
1.1 Luca AI [toc=1.1 Luca AI]
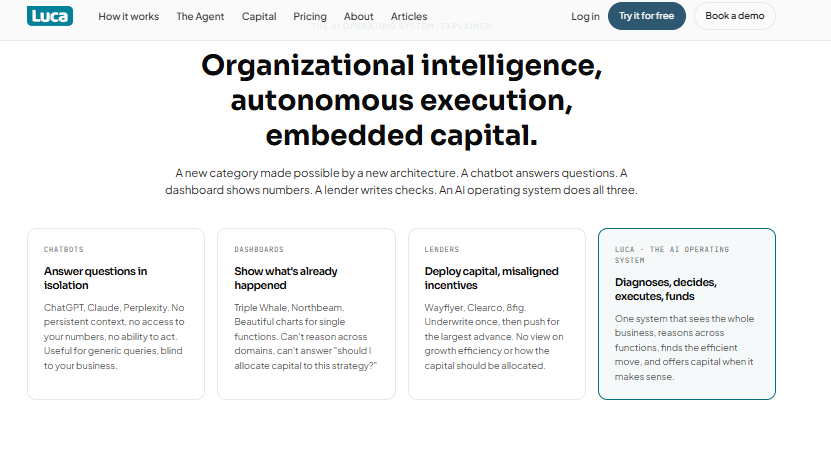
Luca AI contrasts chatbots, dashboards, and lenders with one system that diagnoses, decides, and funds
⭐ Why did we choose this tool?
I put Luca AI first because I built it, and I want that on the record before anything else. The honest reason it leads is architectural, not personal. Luca AI is an AI layer over your store's data, not a dashboard with a chat box added later.
Ari Tulla, founder of ELO Health, described spending roughly ten million dollars building an in-house system to turn data into meaning, then watching general reasoning models outperform it. That is the shift this list is measuring. Most analytics tools added AI. Luca is AI.
🧩 Solutions offered
Ask questions in plain English, with no SQL, no analyst, and no dashboard building
Cross-functional reasoning across commerce, marketing, finance, and operations data
Root cause analysis that names the influencing components behind a metric move
Predictive work including sales forecasts, reorder alerts, and product-level analysis
Scheduled reports and outlier alerts pushed to Slack, email, or the mobile app
📐 Core evaluation metrics
Data sources connected: 200+ native connectors, normalized on ingestion
Reasoning depth: cross-functional, spanning marketing, finance, and operations
Proactive delivery: 24/7 scanning with alerts on ROAS, CAC, and inventory thresholds
Setup time: connect and ask, with no data cleanup project first
Pricing transparency: published plans, listed below
✅ Best for
Ecommerce stores between 1M and 5M in revenue with data piling up unused
Operators with no in-house analyst and no budget for a data team
Founders who want answers pushed to them, not another tab to open
💰 Case study
The problem. A European skincare brand doing just over €3M on Shopify ran reporting from four exports and a spreadsheet. Their bestselling bundle looked healthy on gross margin. Nobody had joined shipping, returns, and discount data to it.
How Luca AI helped. Luca AI connected Shopify, Meta, Klaviyo, and their accounting stack, then rebuilt contribution margin at SKU level. It flagged the bundle as an outlier and traced the drag to return rates on one size variant.
The outcome. The team repriced the bundle, cut the variant, and moved the freed spend to two products that were already converting well. Reporting time dropped from most of a Monday to a scheduled Friday summary. My read is that the repricing mattered more than the time saved, though the team would tell you the opposite.
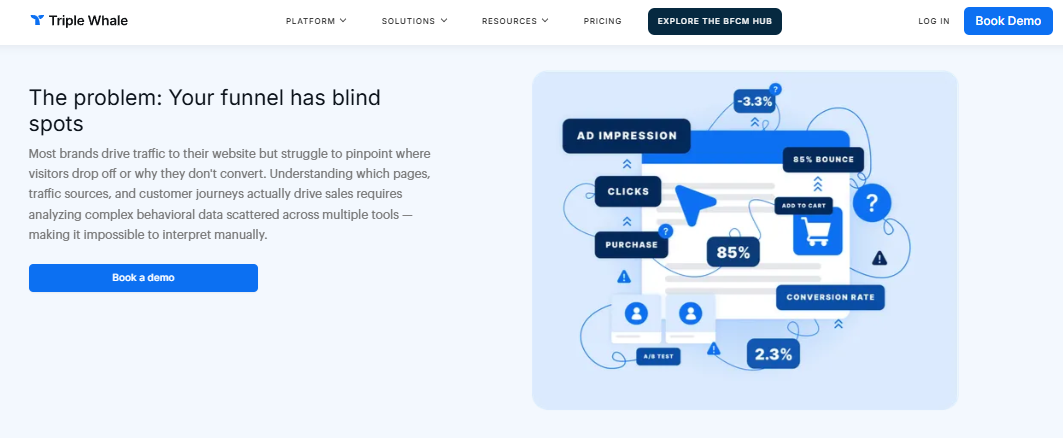
Triple Whale frames the problem as funnel blind spots hidden inside scattered marketing data
⭐ Why did we choose this tool?
Triple Whale earns its place because it solved a real problem well. Its first-party pixel and daily profit view gave DTC operators a usable answer on paid media when platform tracking broke. Moby, its agent layer, automates a chunk of the analysis a media buyer used to do by hand.
Where it stops is the finance layer. Triple Whale sees marketing and commerce. It does not reason about cash position or working capital, so it cannot answer the second half of my test question. On G2 it holds 4.5 out of 5 across 481 reviews, with generative AI capability among its strongest subscores.
🧩 Solutions offered
Triple Pixel first-party tracking, independent of platform pixels
Multi-touch attribution plus marketing mix modelling for budget allocation
Moby agents for automated, scheduled marketing analysis
Daily profit and summary views for morning checks
Creative and campaign-level reporting across Meta, Google, and TikTok
📐 Core evaluation metrics
Data sources connected: commerce, ads, email, and SMS platforms
Reasoning depth: marketing and commerce only, no accounting or banking layer
Proactive delivery: anomaly detection and scheduled agent runs, marketing scope
Setup time: fast pixel install, longer to trust the attribution numbers
Pricing transparency: published entry tiers, GMV scaling above them
✅ Best for
DTC brands whose biggest unanswered question is paid media performance
Teams that want a daily profit number without building it themselves
"Triple Whale is very user-friendly and easy to navigate to find the data you need across multiple channels. Relevant channels like emails, ads, organic, etc are already broken down for you and when looking at the specific channel, you have the option to customize the table displaying the data to choose which metrics are most relevant for your needs." — Verified User, 4/5 Triple Whale G2 Verified Review
"Sometimes it does not update the numbers correctly and has errors with synchronisation." — Verified User, 3/5 Triple Whale G2 Verified Review
Luca AI takes a different route here, connecting accounting and banking data alongside ads and orders, which is what lets it answer why margin moved rather than only where spend went.
1.3 Polar Analytics [toc=1.3 Polar Analytics]
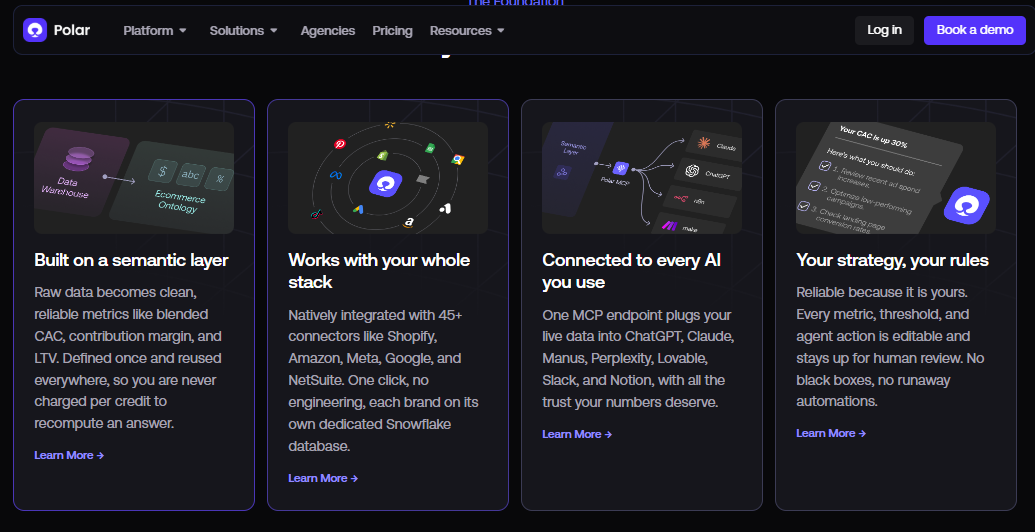
Polar Analytics builds governed CAC, contribution margin, and LTV metrics on a semantic layer
⭐ Why did we choose this tool?
Polar Analytics earns its spot for reporting control. It builds a unified Shopify data layer, then lets you shape dashboards and metric definitions yourself. That governed metric dictionary is what keeps AI answers from drifting.
The trade-off is effort and price. Polar is not plug and play, and reviewers say the advanced features take real time to learn. On G2 it holds 4.7 out of 5, with support scored 9.5 against Triple Whale's 8.9. If reporting control is what you are after, the Polar Analytics alternatives worth testing sit in a similar price band.
🧩 Solutions offered
Unified Shopify, ads, email, and subscription data in one warehouse-style layer
Custom dashboards and governed metric definitions your team controls
Cohort, retention, and product-level reporting
Scheduled report delivery to Slack and email
Ask Polar natural language queries built on the semantic layer
📐 Core evaluation metrics
Data sources connected: commerce, ads, email, subscriptions, and some 3PL
Reasoning depth: strong reporting, limited finance and cash-flow logic
Proactive delivery: scheduled reports and alerts, marketing and revenue scope
Setup time: weeks, since dashboards and definitions need building
Pricing transparency: published tiers, sales quotes often differ
"Sometimes the data takes time to update, and some ratios are more difficult to understand." — Juliette P., CEO, 4.5/5 Polar Analytics G2 Verified Review
"Not impressed compared to price point. I believe this is a great product, and solves many problems for brands with more complex reporting. However, from the get go there were some discrepancy in the pricing. The pricing communicated when installing the app via Shopify was completely different from the one provided by sales after the installation (which was much higher)" — Maja, Polar Analytics TrustPilot Verified Review
1.4 Northbeam [toc=1.4 Northbeam]
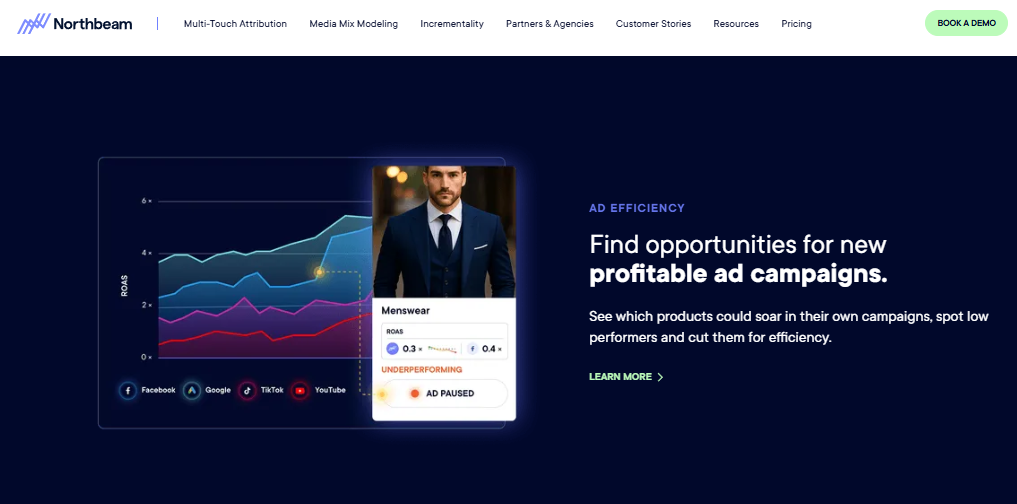
Northbeam surfaces channel ROAS trends and flags underperforming creatives for spend efficiency decisions
⭐ Why did we choose this tool?
Northbeam is the media measurement specialist here. It combines multi-touch attribution with media mix modelling, retrained on a regular cadence. If your biggest open question is incrementality on paid social, it belongs on your shortlist.
It is also the narrowest tool on this list. Northbeam answers where spend worked, not why margin moved. G2 lists 4.5 out of 5 across just 16 reviews, which is a thin signal, and ease of setup scores 7.8.
🧩 Solutions offered
Deterministic and view-through attribution across paid channels
Media mix modelling with regular retraining
Creative and campaign-level performance breakdowns
Customer journey and first-order profitability views
Data exports into your own warehouse
📐 Core evaluation metrics
Data sources connected: ad platforms, Shopify, and some CRM inputs
Reasoning depth: paid media only, no accounting layer
Proactive delivery: reporting and exports, limited push intelligence
Setup time: heavy onboarding, reflected in a 7.8 setup score
Pricing transparency: quote on request, entry floors reported near $1,500 monthly
✅ Best for
Brands spending above roughly $200,000 a month on paid media
Teams with an in-house media buyer to act on findings
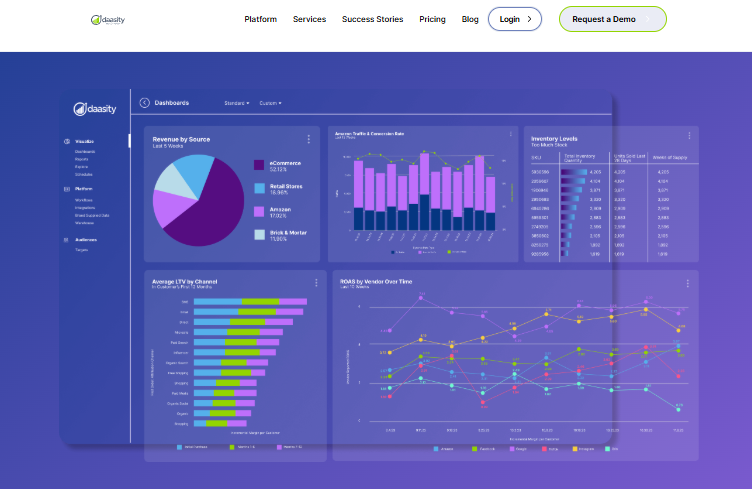
Daasity is the honest pick if you want to own your data infrastructure. It ships prebuilt ecommerce models, moves your data into a warehouse, then connects your BI tool of choice. That approach ages well.
It also assumes skills most sub-5M stores do not have. You still need someone comfortable with SQL and modelling. G2 shows 4.8 out of 5 across only 11 reviews, with reviewers noting some channels need manual entry and reports refresh overnight. Operators weighing that build cost usually end up scanning the Daasity alternatives first.
🧩 Solutions offered
Prebuilt ecommerce data models across commerce, ads, and email
ELT pipelines into Snowflake, BigQuery, or Redshift
Connectors into Looker, Tableau, or Power BI
Multi-store and multi-brand consolidation
Analyst services for modelling support
📐 Core evaluation metrics
Data sources connected: broad commerce and marketing coverage into your warehouse
Reasoning depth: whatever your BI layer and analyst can build
Proactive delivery: overnight refresh, no native push intelligence
Setup time: a project, not an install
Pricing transparency: quote on request, plus warehouse and BI costs
ThoughtSpot pioneered search-first analytics. You type a question, it returns a chart, built on a modelled semantic layer. For a company where executives want answers instead of dashboards, that model works.
The catch is that it is enterprise BI, not ecommerce software. Nothing in it understands contribution margin or return rates until you model that yourself. Across roughly 330 G2 reviews it averages 4.4 out of 5, with recurring complaints about visualization polish and query caps.
🧩 Solutions offered
Natural language search over a governed semantic model
Liveboards for shared, interactive reporting
AI-assisted change and anomaly analysis
Embedded analytics for customer-facing apps
Warehouse-native deployment on Snowflake and BigQuery
📐 Core evaluation metrics
Data sources connected: your warehouse, not your apps directly
Reasoning depth: strong within whatever you model, no ecommerce logic prebuilt
Proactive delivery: scheduled monitoring and change analysis
Setup time: months, and it needs a data owner
Pricing transparency: quote on request
✅ Best for
Companies with a warehouse and a data team in place
Enterprises serving many internal report consumers
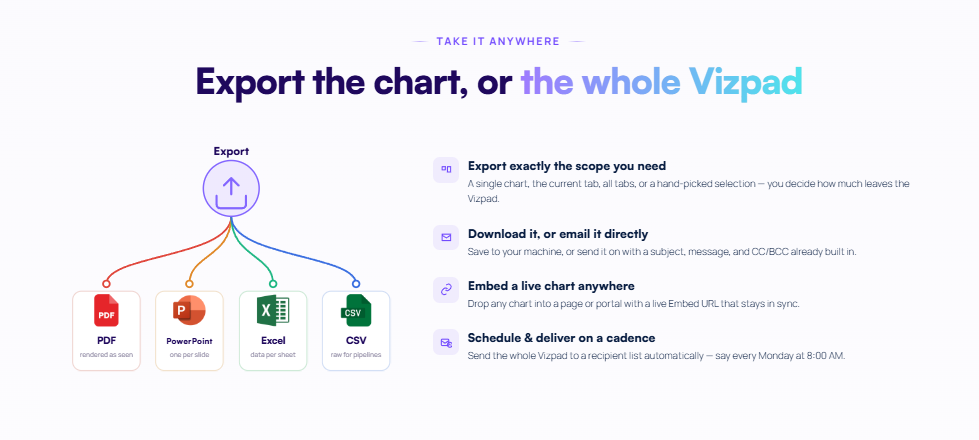
Tellius exports charts or full Vizpads as PDF, slides, spreadsheets, embeds, or scheduled sends
⭐ Why did we choose this tool?
Tellius is on this list for one capability: automated root cause analysis. It scans hundreds of dimensions and surfaces the statistically significant drivers behind a metric move, without an analyst slicing manually. That is the closest thing here to true cognitive analysis.
Its centre of gravity sits in pharma and finance, not retail. G2 shows 4.4 out of 5 across 22 reviews, with Gartner Peer Insights at 4.6 across 63. You bring the ecommerce context yourself.
🧩 Solutions offered
Automated root cause and driver analysis across many dimensions
Natural language querying for non-technical users
Predictive models and forecasting
Anomaly and trend detection
Warehouse and cloud data source connectivity
📐 Core evaluation metrics
Data sources connected: warehouses and databases, few native ecommerce apps
Reasoning depth: strong statistical driver analysis, generic business context
1.8 IBM Cognos Analytics [toc=1.8 IBM Cognos Analytics]
⭐ Why did we choose this tool?
IBM Cognos Analytics represents the incumbent answer to this keyword. It ranks for "cognitive analytics platform" because IBM has owned that language since Watson. It delivers governed reporting, dashboards, and an AI assistant at enterprise scale.
For a Shopify store doing 3M, it is the wrong shape. Deployment assumes IT support and a reporting team. IBM notes recognition as a TrustRadius Buyer's Choice, which reflects enterprise satisfaction, not DTC fit.
🧩 Solutions offered
Governed enterprise reporting and dashboards
AI assistant for natural language exploration
Data modelling and multi-entity consolidation
Scheduled distribution and subscriptions
On-premise, cloud, or hybrid deployment
📐 Core evaluation metrics
Data sources connected: enterprise databases, files, and warehouses
Reasoning depth: strong reporting, no ecommerce or margin logic prebuilt
Proactive delivery: scheduled reports and alerts
Setup time: months, with IT involvement
Pricing transparency: quote on request
✅ Best for
Multi-entity retailers with finance and IT teams
Organizations with audit and governance requirements
Companies already invested in the IBM stack
1.9 Amazon QuickSight with Q [toc=1.9 Amazon QuickSight]
⭐ Why did we choose this tool?
QuickSight is the cheapest way to get dashboards if your data already lives in AWS. Q adds natural language questions on top. For engineering-led teams, it is a sensible default.
It is also a blank canvas. As one operator put it, cloud data lakes hand you logs and logs of data with no business logic attached. You build every metric, every definition, and every alert yourself before it answers anything about margin.
🧩 Solutions offered
Serverless BI dashboards with per-session pricing
Q natural language questions over prepared datasets
Embedded analytics inside internal or customer apps
Anomaly detection on defined metrics
Native connectivity across AWS data services
📐 Core evaluation metrics
Data sources connected: AWS services first, apps via pipelines you build
Reasoning depth: only what you model, no ecommerce context included
Proactive delivery: threshold alerts you configure
Setup time: depends entirely on your engineering bandwidth
Pricing transparency: usage-based, published per user and per session
✅ Best for
Teams with engineers and data already in AWS
Companies embedding dashboards into their own product
Operators optimizing for infrastructure cost over speed
Luca AI sits at the opposite end of that build-versus-buy line from QuickSight and Daasity. It normalizes data on ingestion across 200+ connectors, so the ecommerce business intelligence logic arrives with the tool rather than being modelled by you. My read is that this only matters below roughly 10M in revenue, where nobody has an analyst to spare.
Q2. How were these cognitive analytics platforms scored, and how should you score them yourself? [toc=2. Scoring Methodology]
Each platform is scored out of 100 across five weighted criteria: Cross-Functional Reasoning 25%, Agentic and Proactive Delivery 20%, Setup and Usability 20%, Pricing Transparency 20%, and Verified User Reviews 15%. Scores of 0 to 20 earn one star, 21 to 40 two, 41 to 60 three, 61 to 80 four, and 81 to 100 five stars. Enterprise BI suites lose points on setup and ecommerce fit.
📊 The five criteria and their weights
Scoring Criteria and Weights for Cognitive Analytics Platforms
Criteria
Weight
What it measures
Cross-Functional Reasoning
25%
Can it reason across ads, orders, returns, and accounting together
Agentic and Proactive Delivery
20%
Does it push findings to you, or wait to be opened
Setup and Usability
20%
Time from connection to first useful answer
Pricing Transparency
20%
Published pricing, and whether quotes match it
Verified User Reviews
15%
Rating, review volume, and what the complaints say
Reasoning carries the most weight for a simple reason. Every tool here can show you a number. Very few can tell you which of four causes moved it.
⭐ Why reasoning outweighs dashboards
One operator I trust put the shift bluntly: the move is from monitoring to recommending, and descriptive analytics is the old game. I agree, with one caveat. A recommendation you cannot audit is worse than a chart you can.
Luca AI measures this criterion by testing whether a platform can trace a metric move back to its influencing components across separate data sources. That test is harsher than a feature checklist, and I might be weighting it too heavily for very small stores.
🧮 How the star bands work
The bands are mechanical, so you can rebuild them. A tool with strong reporting, no accounting layer, published entry pricing, and a solid review base lands in the four-star band. Drop pricing transparency and add a quote-only sales process, and it slides into three stars.
That is exactly what separates the mid-table tools here. Verified review subscores matter too. On G2, Polar Analytics scores 9.5 on support against Triple Whale's 8.9, and 9.4 on reports against 8.8.
✅ The eight-point checklist to run yourself
Semantic layer: where do metric definitions live, and who can edit them
Unstructured data: can it read returns notes, tickets, and reviews
Forecast transparency: can it show the inputs behind a prediction
Recommendation quality: does it name an action, not just a variance
Agentic delivery and permissions: what can it send, and what can it change
Review sentiment: read the three-star reviews, not the five-star ones
Pricing and commitment: ask the price at twice your current GMV
Ask Luca AI to run point five in a live demo by setting a weekly CAC report with reasoning attached, then check what lands in Slack. That is the fastest way to see whether automated reporting actually reaches you.
😊 What reviewers say about setup weight
"Shortly after onboarding we were assigned an account manager. About a month later, she was laid off and we were never assigned a new account manager. I have the direct email of a support specialist, but the response time has been less than ideal, especially when real-time data is important for our team." — Ben S., Director of Commercial Operations, 4/5 Polar Analytics G2 Verified Review
If you already employ an analyst, raise Setup and Usability and cut Agentic Delivery. You have a human who can chase the answer. If you do not, invert that.
Luca AI earns its agentic score by scanning connected data around the clock and pinging the operator when ROAS dips, CAC spikes, or inventory falls below a set threshold. Nobody has to open the tool for that to happen.
Q3. What is a cognitive analytics platform, and where does it sit above descriptive BI? [toc=3. Definition and Maturity Ladder]
A cognitive analytics platform uses machine learning and natural-language reasoning over structured and unstructured data the way an analyst would. For an ecommerce operator, it reads orders, ad spend, returns, tickets, and P&L together, explains why a number moved, and recommends the next action. A dashboard shows the number and stops. The category is forecast to grow from USD 25 billion in 2024 to USD 57 billion by 2033.
🪜 The five-rung ladder
The Analytics Maturity Ladder for Ecommerce Operators
Layer
Question it answers
Ecommerce example
Descriptive
What happened
Revenue was down 8% last week
Diagnostic
Why did it happen
Meta spend fell and email revenue dropped
Predictive
What happens next
This SKU stocks out in 19 days
Prescriptive
What should I do
Cut the bundle, move spend to two winners
Cognitive and agentic
Do it, or tell me unprompted
A Monday alert with the reasoning attached
Most tools sold as "AI analytics" live on rungs one and two. They added a chat box to a dashboard. The question they answer did not change.
📦 Why unstructured data is the real divider
Your order table cannot tell you why a size variant gets returned. Your support tickets can. Cognitive platforms read that text, cluster the reasons, and tie them back to margin.
Luca AI does this by normalizing every connected source on ingestion, including support and returns data, so text and numbers land in one model. That is the part most operators skip, and it is the part that makes root cause possible.
🔍 Same CAC spike, two tools
Say your customer acquisition cost, the cost to win one new buyer, jumps 22% in a week. A dashboard shows the spike, and you start opening tabs. You check Meta, then Google, then your discount codes.
The cognitive version answers in one pass. It reports that CAC rose because a returning-customer campaign was misclassified as prospecting, and new-customer volume actually held. One of those workflows costs you a Tuesday.
🤔 Is this just rebranded AI?
Partly, and it is worth being honest about that. The term dates back to IBM Watson-era systems, which is why IBM still ranks for it. Anyone selling you the word alone is selling you 2016.
What is genuinely new is two things. A governed semantic layer, meaning a dictionary of what each metric means, plus agent delivery on top of it. Without the first, the second returns confident nonsense.
🪟 The windshield test
A founder I spoke with framed it well. Your dashboard is the speedometer and the fuel gauge, useful for going faster safely. Cognitive reasoning is the clean windshield that lets you see the road ahead.
Both matter. My read is that operators overinvest in the gauges because gauges are easy to demo. Pretty charts are a courtesy to the human reader, not the substance of the work.
✅ The one question that tells you which layer you own
Open your current tool and ask it why contribution margin moved last month. If it returns a chart, you own a dashboard. If it returns three candidate causes ranked by contribution, you own something closer to cognitive.
Luca AI answers that question in plain English rather than returning a chart to interpret, which is the whole distinction the category was named for. Most analytics tools added AI. Luca is AI.
Q4. Predictive, prescriptive or agentic: which capability actually moves your P&L? [toc=4. Capability Layers Compared]
Predictive forecasts what will happen. Prescriptive names the action, usually by finding root cause and the influencing components behind the move. Agentic executes or delivers without being asked. For most stores under USD 20 million, prescriptive pays back first, because a forecast with no recommended action still needs a human analyst to translate it.
🧭 The three layers side by side
Predictive, Prescriptive, and Agentic Capabilities Compared
Capability
What it produces
Failure mode
Buy it when
Predictive
Forecasts, stockout dates, simulations
Confident numbers, no owner for the action
You have someone to act on it
Prescriptive
Ranked causes and a recommended move
Recommendations you cannot audit
Almost always, first
Agentic
Scheduled pushes, alerts, autonomous actions
Acting on bad data at speed
After you trust the numbers
⏰ Predictive: useful, and easy to waste
Predictive work shines on inventory. A reorder date built from velocity, lead time, and seasonality beats a gut call every time. It also lets you simulate, so you can test a 3% return-rate change before committing cash.
Luca AI covers this layer with sales prediction, reorder alerts, and product-level forecasting drawn from months and years of your own history. The forecast is not the hard part. Deciding who acts on it is.
🔎 Prescriptive: where the money actually is
Prescriptive analysis does three jobs. It finds the root cause, names the influencing components behind a move, and flags the areas already performing well so you leave them alone. That third job saves more money than operators expect.
Ask Luca AI to set a goal, then have it report the blockers standing between you and that goal on a weekly cadence. Most stores discover their blocker is one SKU or one shipping lane, not their ad account.
🤖 Agentic: delivery first, autonomy later
Agentic means two different things, and vendors blur them. The safe version is delivery, meaning scheduled reports and outlier alerts that arrive without you opening anything. The riskier version is autonomous action inside your systems.
Shopify's own agentic commerce documentation shows how fast the delivery side is maturing, with Catalog data syndicated out to ChatGPT, AI Mode, and Copilot. Luca AI sits on the delivery side, pushing customized reports and alerts into Slack, email, or the app on a schedule you set, which is what most ecommerce AI agents stop short of.
⚠️ Keep the QA gate
Richie Jones of VAST described a premium bike retailer publishing a road bike with the rear derailleur mounted on the front wheel. His warning was simple: do not remove the QA, and do not let the AI be the QA.
That is my position too. At premium average order value, unsupervised publishing or spend changes are a liability. Approval-gated action costs you an hour a week and protects the brand.
💰 The buying order
Buy prescriptive first, because it changes a decision this month. Add agentic delivery second, because it removes the Sunday-night tab ritual. Turn on autonomous action last, and only for reversible things like pausing a campaign.
If you skip prescriptive and buy forecasting alone, you will pay for numbers nobody acts on. I have watched that happen more than once, usually at the stage where the founder is still the analyst.
Luca AI works across all three layers, forecasting and simulating, tracing root cause and influencing components, then pushing the finding out on a cadence the operator sets. The autonomy stays gated, which is deliberate rather than a limitation.
Q5. Why does gross margin lie, and can a cognitive platform catch it? [toc=5. The Margin Truth Test]
Gross margin covers what it costs to make the product, not what it costs to sell it. Shipping, returns, discounts, payment fees, support time, and ad spend sit outside it. A cognitive analytics platform catches the gap only if it ingests shipping, returns, and support data alongside Shopify and Meta, then reports contribution margin at SKU level.
💰 The invoice that made a founder cry
A founder slid an invoice across the table and said this bundle was her best seller at 72% gross margin. I pulled up her P&L, her shipping data, her return rates, and her support tickets. Twenty minutes later she was crying.
Contribution margin on that product, calculated line by line, was 8%. Not 72%. She had spent two years scaling something that barely broke even, and the data was already sitting in her systems.
🧾 The subtraction order that gets you the truth
Run this stack on one SKU tonight, in this order:
Revenue after discounts and promo codes
Minus landed cost of goods, including duty and freight in
Minus payment processing and platform fees
Minus outbound shipping and packaging, actual not average
Minus returns cost, meaning refunded revenue plus return freight plus write-off
Minus support cost, tickets per order times cost per ticket
Minus ad spend attributed to that product
What is left is contribution margin. Most founders never get past step two, which is why gross margin keeps lying to them.
📊 Which tools can actually join these tables
Steps four, five, and six are where tools break. Marketing-first platforms see ads and orders, so they stop at step three. Warehouse-first tools can do all seven, but only after somebody models it.
Luca AI is trained on the relationships between ecommerce variables, so it attributes shipping, returns, and support cost back to the SKU rather than leaving you joining tables by hand. That is the part I would test first in any demo, alongside the rest of your unit economics tracking.
🔬 The simulation that changes a decision
Take the same SKU and model a 3% swing in return rate. On a 20% contribution margin product with $9 return freight, that swing often eats a fifth of the margin. Ask Luca AI to run that scenario before you commit to the next purchase order.
Then check your channel data for tracking failure. Operators in r/shopify report that a Direct channel above 40% of revenue usually means broken checkout tracking, not real word of mouth. If your conversion tracking is wrong, step seven is wrong too.
✅ Your Monday move
Pick your top three SKUs by revenue. Run the seven-step stack on each. You are looking for the one where contribution margin is under 15%, because that is the product quietly funding itself with your cash.
I could be wrong about the threshold. Fifteen percent is where the stores I have watched start feeling cash-poor while revenue climbs. Your category may sit higher or lower, especially in apparel with heavy returns.
⚠️ What this does not fix
A margin calculation cannot tell you whether a product carries your brand. One fashion operator told me they got too data driven and lost touch with the emotional side of the business. Fashion buyers do not decide on a one or a zero.
So use the number to size the risk, not to make the call for you. Kill a product on margin alone and you may kill the reason people follow you.
Luca AI surfaces these outliers by reasoning across indirectly related metrics from separate sources, which is how an 8% product hides behind a 72% headline. The calculation is not clever. Joining the data is the hard part.
Q6. What has to be true of your data before any of this works? [toc=6. Data Foundation and Rollout]
Without a semantic layer, a governed dictionary of your metrics, a cognitive platform returns confidently wrong numbers. It cannot know whether revenue means gross, net of returns, or invoice sales. Fix definitions and normalize on ingestion, not in reporting. Then load brand context before you trust a single recommendation.
⚠️ The failure mechanism
Here is how rollouts die. You connect five sources, ask a question, and get an answer that looks plausible. Nobody checks it against Shopify, and the wrong number enters a board deck.
The cause is almost never the model. It is that two sources defined revenue differently, and nothing reconciled them. Fivetran makes the same point about agents: they cannot reason reliably over raw Shopify records without governed data management first.
📅 The calendar problem nobody warns you about
Multi-brand operators hit this hardest. One retail leader described brands reporting invoice sales versus demand sales, and retail calendars split as 5-5-4 or 4-4-5, none of it standard. Legacy tools cannot reconcile that automatically.
Luca AI normalizes and standardizes data on ingestion, which is why the cleanup year disappears. Plug in, ask, act. I would still verify the reconciliation yourself in week one.
🔍 Three questions for your demo
Ask these before signing anything:
Where do metric definitions live, and can I see the file
Who on my team can edit a definition, and is there an audit trail
When two sources disagree, which one wins, and who decided that
If the answer to any of these is vague, you are buying a black box. Charge that back into the price, and treat it as a red flag when evaluating AI data agents.
⏰ Week 1 and Week 2
Week 1, connect commerce, ads, email, and accounting. The verification check is simple: order count and net revenue must match Shopify for the last full month, to the unit. The failure mode is accepting a 2% variance because it looks close enough.
Week 2, write the metric dictionary. Define revenue, CAC, contribution margin, and returns in one document. Ask Luca AI to answer the same question three ways and confirm all three land on your definitions.
🧠 Week 3 and Week 4
Week 3, load context. Brand rules, buying calendar, target margins, seasonality, and the two years of history you already have. The PhD onboarding analogy holds here: a brilliant hire still fails on day one with no context.
One founder I know named his system Atlas and gave it a folder of assessments before treating it as a strategic partner. That sounds excessive. It is closer to right than plugging in five connectors and expecting judgment.
✅ The Week 4 setup that pays for itself
Week 4, set exactly three alerts and one scheduled report. Three is not arbitrary. More than three and you start ignoring them, which is worse than having none.
My default trio: CAC above your target for three straight days, inventory below reorder point on top-ten SKUs, and contribution margin moving more than five points week over week. Add one weekly report with reasoning attached, not just charts, which is where automated data reporting earns its keep.
❌ What to skip
Do not build dashboards in month one. Do not connect every source you own. Do not turn on autonomous actions before your numbers reconcile.
Luca AI shortens week one because normalization happens on ingestion, but the week three context load still decides whether the recommendations are worth reading. That sequencing is the part most rollouts get backwards.
Q7. What will this cost, what do operators actually say, and when is it the wrong buy? [toc=7. Cost, Reviews and Fit]
Expect USD 129 to 219 a month at entry, roughly USD 500 to 1,020 at mid-market, and quote-on-request for enterprise BI. Bills escalate through GMV tiering, per-connector fees, 12-month commitments, and paid onboarding. Skip the category entirely if you lack order history to reason against, already run an in-house data team, or make mostly creative rather than quantitative calls.
💸 Where the bill actually escalates
How Cognitive Analytics Bills Escalate
Escalation mechanic
What it looks like
GMV tiering
Price rises as your revenue rises, not as usage rises
Per-connector fees
Adding Walmart or a 3PL costs extra
Annual commitment
12-month lock at the entry tier
Onboarding fees
One-time implementation charge, often quoted separately
Ask one question in every sales call: what is the price at twice my current GMV? Triple Whale runs from roughly USD 129 to USD 539 and above with commitment terms, and Polar Analytics from roughly USD 300 to USD 1,020 and above. Compare that against published plan pricing before you sign.
📊 What the ratings say
Polar Analytics holds 4.7 out of 5 on G2 with support at 9.5. Triple Whale holds 4.5 out of 5 across 481 reviews, leading on generative AI capability. Northbeam sits at 4.5 across just 16 reviews, which is a thin sample.
Luca AI is not scored on G2 at the same volume, and I will not pretend otherwise. Judge it on a trial against your own numbers instead.
😊 The three complaints that repeat
"Very useful for top down view for a very fast reporting. Supports and tracks many different platforms as well. almost a no brainer for pulling out stats quickly. However, some stats are not so accurate in pulling in data; they do not tally with shopify" — Verified User, 4/5 Triple Whale G2 Verified Review
"Mobile limitations and the platform isn't a plug-and-play solution, it requires time and effort to learn its advanced features and capabilities. There are instances that certain intergrations are not yet fully functioning so you have to always check with Customer Support." — Charlene R., Head of Operations, HR & Culture, 5/5 Polar Analytics G2 Verified Review
Under roughly USD 1 million in revenue, with too little history to reason against
An in-house data team and warehouse already running well
Decisions driven by taste, curation, or creative judgment more than numbers
One operator told me their inventory system's built-in AI forecasting was rubbish, so they dropped it after six months. Native tools inside vertical software are usually the weakest option in your ecommerce tech stack.
⚠️ The human exception
High-AOV catalogs should keep humans on the phone. One retailer described older customers audibly relieved that a person answered, and that upselling drives real profit. Bots protect margin at high volume and low ticket. They cost you money at the other end.
The honest frame is the one an operator gave me: AI should take your work to 80 or 90% completion, not replace the person doing it.
🤔 What I am still unsure about
My open question for the next 18 months is whether agentic delivery becomes table stakes or stays a premium tier. If it becomes standard, today's pricing looks expensive fast. Tell me what your renewal quote looked like this year, because that is the signal I trust most.
Luca AI targets SMB and mid-market operators between roughly USD 1 million and 5 million in revenue, where data is piling up and nobody has an analyst. Above that, with a data team in place, the honest answer is that a warehouse-first stack may serve you better.
FAQ's
What is a cognitive analytics platform in ecommerce terms?
A cognitive analytics platform uses machine learning and natural-language reasoning over structured and unstructured data the way a human analyst would. For an ecommerce operator, that means it reads orders, ad spend, returns, support tickets, and the P&L together, explains why a number moved, and recommends the next action.
A dashboard shows you the number and stops there. The difference matters on a Sunday night when revenue looks flat but cash feels tight.
Descriptive: what happened last week
Diagnostic: why it happened, at channel level
Predictive: what happens next, including stockout dates
Prescriptive: which lever to pull, ranked by impact
Cognitive and agentic: the answer arrives without you asking
Luca AI sits on the reasoning rungs of that ladder rather than the charting rungs, which is why we describe it as an AI-native data platform instead of another dashboard. Most analytics tools added AI. Luca is AI.
The practical test is simple. Ask your current tool why contribution margin moved last month. A chart means you own a dashboard. Three ranked causes means you own something closer to cognitive.
How is cognitive analytics different from predictive, prescriptive, and agentic analytics?
These four words get used interchangeably by vendors, and the difference decides what you should pay for.
Predictive forecasts what will happen, such as a reorder date built from velocity, lead time, and seasonality.
Prescriptive names the action by finding root cause and the influencing components behind a metric move.
Cognitive interprets messy, unstructured context like returns notes and support tickets alongside numbers.
Agentic delivers or executes without being asked, from scheduled reports to autonomous changes in connected systems.
For most stores under $20 million in revenue, prescriptive pays back first. A forecast with no recommended action still needs a human analyst to translate it, and that human is usually the founder.
Luca AI works across all four, forecasting and simulating, tracing root cause, then pushing the finding into Slack or email on a cadence the operator sets. We keep autonomous action gated behind approval on purpose.
Our read on agentic analytics tools is that unsupervised publishing or spend changes are a liability at premium average order value. Approval-gated action costs an hour a week and protects the brand.
Can a cognitive analytics platform catch contribution margin errors at SKU level?
Only if it ingests the right sources. Gross margin covers what it costs to make a product, not what it costs to sell it. Shipping, returns, discounts, payment fees, support time, and ad spend all sit outside it.
We watched a founder present a bundle at 72% gross margin. Rebuilt line by line, contribution margin came out at 8%. She had scaled a product for two years that barely broke even, and the data was already in her systems.
The subtraction order that gets you the truth:
Revenue after discounts and promo codes
Minus landed cost of goods, including duty and freight in
Minus payment processing and platform fees
Minus outbound shipping and packaging, actual not average
Minus returns cost, including return freight and write-off
Minus support cost and product-level ad spend
Marketing-first platforms usually stop at step three. Luca AI is trained on the relationships between ecommerce variables, so it attributes shipping, returns, and support cost back to the SKU instead of leaving you joining tables by hand. Start with our breakdown of contribution margin versus gross margin, then run the stack on your top three SKUs.
What should we check before buying a cognitive analytics platform?
Run the same eight checks we use to score platforms, in your own demo, with your own data connected.
Semantic layer: where do metric definitions live, and who can edit them
Unstructured data: can it read returns notes, tickets, and reviews
Forecast transparency: can it show the inputs behind a prediction
Recommendation quality: does it name an action, not just a variance
Agentic delivery and permissions: what can it send, and what can it change
Integration breadth: does it reach accounting and 3PL data
Review sentiment: read the three-star reviews, not the five-star ones
Pricing and commitment: ask the price at twice your current GMV
The semantic layer question matters most. Without a governed dictionary of your metrics, a platform cannot know whether revenue means gross, net of returns, or invoice sales, and it will answer confidently anyway.
Luca AI normalizes and standardizes data on ingestion, which is why onboarding skips the cleanup year: plug in, ask, act. Our guide to evaluating AI data agents covers what a vague answer to any of these eight questions usually hides.
When is a cognitive analytics platform the wrong purchase?
Three cases, stated plainly, because pretending otherwise wastes your money.
Too early: under roughly $1 million in revenue, you lack the order history to reason against
Already covered: an in-house data team and a working warehouse will beat a packaged tool
Wrong decision type: if your calls are driven by taste, curation, or creative judgment, numbers will not settle them
One fashion operator told us they got too data driven and lost touch with the emotional side of the business. Fashion buyers do not decide on a one or a zero. Use the margin number to size the risk, not to make the call for you.
There is also a service exception. High average order value catalogs should keep humans on the phone, because empathetic conversations drive upsells that bots cannot.
Luca AI targets SMB and mid-market operators between roughly $1 million and $5 million in revenue, where data is piling up and nobody has an analyst to read it. If that is not you, our comparison of ecommerce analytics platforms lays out the alternatives honestly.
Enjoyed the read? Join our team for a quick 15-minute chat — no pitch, just a real conversation on how we’re rethinking Ecommerce with AI - Luca
Loading Schedule...
Your AI Co-Founder is here.
Here’s why:
Shopify, Meta, Xero - one brain.
"Should I scale?" Answered with real data.
Growth capital. No applications. One click.
Thank you! Your submission has been received! Please book a time slot for the Meeting
Oops! Something went wrong while submitting the form.