9 Best Polar Analytics Alternatives for Shopify Brands in 2026
11
mins read
TL;DR
Nine ranked alternatives: Luca AI, Triple Whale, Northbeam, Lifetimely, Daasity, Peel Insights, TrueProfit, Glew.io, and Littledata, each with verified pricing and honest limitations.
Polar is well reviewed at 4.8 to 4.9 stars across 109 to 113 Shopify reviews. Brands leave over GMV-linked pricing, not product quality.
Verified 2026 pricing spans a 249 to 300 dollar entry, a 300 to 450 dollar working band, and 750 dollars or more at higher revenue.
Restate every subscription as orders to break even. At 86 dollar AOV and 7.5 percent net margin, each order returns about 6.45 dollars.
Four variables decide fit: revenue, monthly ad spend, channel count, and whether anyone on your team writes SQL. Under 2M dollars, buy nothing.
Run any replacement in parallel for 60 days, reconcile net revenue, order count, and blended CAC weekly, then cancel the incumbent.
Q1. What are the 9 Best AI-Powered E-commerce Intelligence Tools in 2026? [toc=1. 9 Best Tools]
The nine best Polar Analytics alternatives in 2026 are Luca AI, Triple Whale, Northbeam, Lifetimely, Daasity, Peel Insights, TrueProfit, Glew.io, and Littledata. Luca AI leads because it is an AI reasoning layer over your unified store data that answers plain-English questions, finds root causes, simulates scenarios, and pushes scheduled reports to Slack. The other eight are each strong at one job.
Polar is a good product. It holds 4.8 to 4.9 stars across 109 to 113 Shopify App Store reviews and ranks #41 of 1,292 analytics apps. Brands rarely leave over quality. They leave because pricing scales with GMV, because the warehouse sits inside someone else's environment, and because the answer stops at a chart. So I built this list around one question: which tool actually tells you what to do next? Here are the nine, then the table, then each one in detail.
The nine alternatives at a glance
Luca AI - Best for cross-functional reasoning and root-cause answers in plain English
Triple Whale - Best for a fast out-of-the-box DTC operator dashboard
Northbeam - Best for attribution depth above $50K monthly ad spend
Lifetimely - Best for LTV, cohorts, and P&L on a small budget
Daasity - Best for warehouse ownership with an in-house data team
Peel Insights - Best for automated cohort and retention reporting
TrueProfit - Best for real-time net profit at the lowest entry price
Glew.io - Best for multi-store and omnichannel merchandising reports
Littledata - Best for clean server-side data collection into GA4
Comparison table
Best Polar Analytics Alternatives Compared in 2026
Tool
Key capabilities offered
Best For
Pricing
Luca AI ⭐⭐⭐⭐⭐
Plain-English querying, root-cause analysis, predictive reorder and sales alerts, simulation, and agentic reports to Slack and email
$1M to $5M brands with piled-up data and no analyst
Blended dashboard, first-party pixel attribution, Moby AI assistant, and creative reporting
Marketing-led teams wanting a dashboard live today
Free to $129+ / Month
Northbeam ⭐⭐⭐⭐
Multi-touch and incrementality-leaning attribution, media mix views, and creative-level ROAS
High-spend paid media teams above $50K monthly
$1,500 to Custom / Month
Lifetimely ⭐⭐⭐⭐
LTV curves, cohort retention, automated P&L, and daily email digest
Founders who need profit clarity cheaply
Free to $299 / Month
Daasity ⭐⭐⭐
Managed ETL, pre-built ecommerce data models, semantic layer, and BI-tool agnostic output
Brands with a data analyst and warehouse plans
$1,899 to Custom / Month
Peel Insights ⭐⭐⭐
Automated cohort analysis, retention and repeat-purchase metrics, and product affinity
Retention-focused teams reporting weekly
Free to $899 / Month
TrueProfit ⭐⭐⭐
Real-time net profit, COGS and fee tracking, LTV, and ad cost sync
Small stores needing true margin fast
$35 to Custom / Month
Glew.io ⭐⭐⭐
Multi-store reporting, merchandising and inventory analytics, and customer segments
Multi-brand or wholesale-plus-DTC operators
Quote-based
Littledata ⭐⭐⭐
Server-side tracking, GA4 and warehouse pipelines, and subscription data accuracy
Teams fixing broken data collection first
Plan-based, published on the Shopify App Store
Pricing verified August 2026 against vendor pricing pages and app store listings. Always confirm a live quote. If you want the wider category view before you shortlist, our breakdown of ecommerce analytics platforms covers the same ground without the Polar-specific lens.
1.1 Luca AI [toc=1.1 Luca AI]
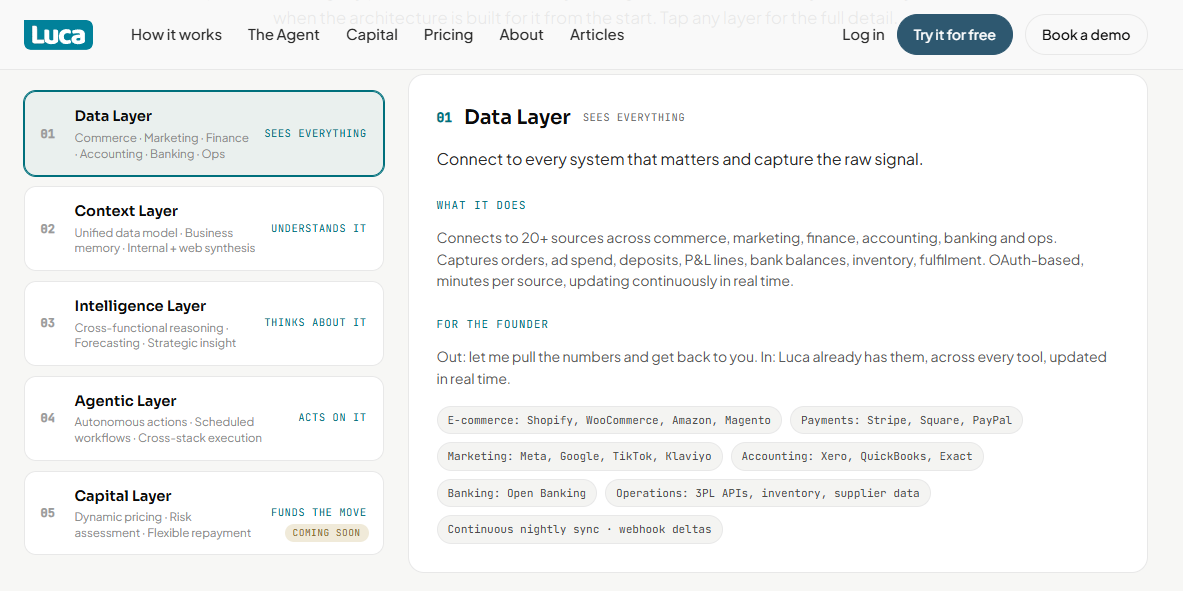
Luca AI stacks data, context, intelligence, and agentic layers so answers arrive without a query
🧠 Why did we choose this tool?
I am the founder of Luca AI, so read this section with that in mind. It sits first for one reason. Every other tool on this list shows you data, and Luca AI reasons across it.
Luca AI connects your sources, then answers questions like "why did contribution margin drop in July" without SQL. It behaves like a junior analyst who never sleeps, not a dashboard you have to interrogate. Most analytics tools added AI. Luca AI is AI.
⚠️ What was the problem? A US skincare brand doing roughly $3M a year ran four channels and two 3PLs. Their best-selling serum showed 71% gross margin. Cash still felt tight every month.
✅ How Luca AI helped: Luca AI pulled COGS, shipping, returns, payment fees, and support ticket volume into one contribution margin view. It flagged that one SKU drove a disproportionate share of support tickets.
💰 What was the outcome? True contribution margin on that hero SKU came in far below the gross figure. They repriced it, changed the packaging that caused the tickets, and stopped scaling spend behind it. Their reported monthly net profit improved without a single new customer.
💰 Pricing
[ Founder: $250 / Month | Growth: $500 / Month | Scale: $750 / Month ]. Current tiers are listed on the Luca AI pricing page.
Luca AI is not an attribution pixel, and it does not replace one. It reasons over the data you already trust to explain movement and recommend the next action.
1.2 Triple Whale [toc=1.2 Triple Whale]
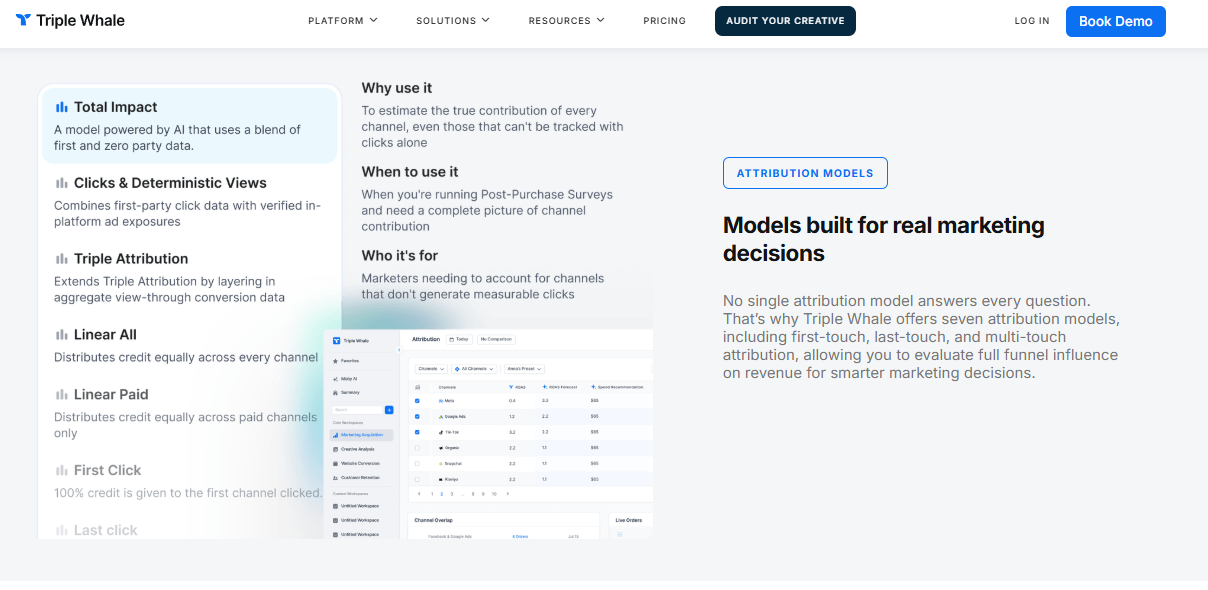
Triple Whale offers seven attribution models, which is exactly why numbers disagree across platforms
⚡ Why did we choose this tool?
Triple Whale is the fastest way off Polar if you mainly want the dashboard back at a lower entry price. It ships with a first-party pixel, a blended view, and Moby, its AI assistant. You can be looking at real numbers the same afternoon.
It is also the most-discussed tool in this category by a wide margin. Public sentiment analysis found 215 substantive mentions of Triple Whale versus just 4 for Polar over twelve months. That volume matters when you need peers to troubleshoot with, and we go deeper on the trade-offs in our guide to Triple Whale alternatives.
⚙️ Solutions offered
Blended dashboard across Meta, Google, TikTok, Klaviyo, and Shopify
Triple Pixel first-party tracking with server-side Sonar
Moby AI assistant for summaries and quick queries
Creative-level and campaign-level performance reporting
Free industry benchmarks drawn from 60,000+ stores
Connectors: broad ad and email coverage, lighter on ERP and 3PL
Time to first reliable answer: hours, with a pixel learning period
Pricing basis: tiered, order-volume sensitive
Verified review signal: high volume, mixed on attribution accuracy
🎯 Best for
$1M to $20M DTC brands running heavy paid social
Marketing-led teams who want one screen every morning
Operators spending roughly $20K or more monthly on ads
💬 Reviews
"Triple Whale is very user-friendly and easy to navigate to find the data you need across multiple channels. Relevant channels like emails, ads, organic, etc are already broken down for you and when looking at the specific channel, you have the option to customize the table displaying the data to choose which metrics are most relevant for your needs. Some data we still notice discrepancies between platforms, for example, tracking ads, and differences in the reported metrics like revenue." - Verified User, Triple Whale G2 Verified Review
That first review names the real trade-off. Attribution numbers can disagree with Shopify and with your email platform. Independent comparisons advise verifying Triple Whale against native Shopify reporting for your first 60 days, which is the same gap we unpack in declining platform ROAS versus true profitability.
Finance visibility is the other gap. You get marketing clarity, not a full P&L with landed COGS and support load. If your question is "which SKU is actually profitable," this is not the tool that answers it, and a purpose-built option from our list of best Shopify analytics apps will serve you better.
💰 Pricing
[ Free plan | Paid tiers from roughly $129 / Month | Enterprise custom ]
1.3 Northbeam [toc=1.3 Northbeam]
Northbeam splits credit across touchpoints, which only pays off above heavy monthly ad spend
🎯 Why did we choose this tool?
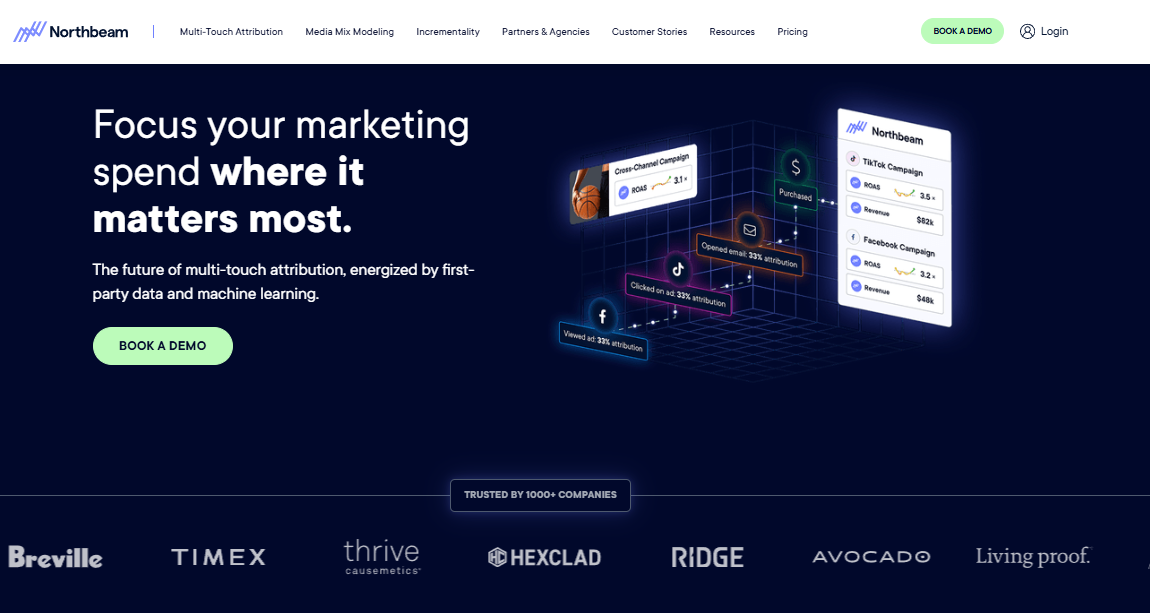
Northbeam is the pick if you left Polar because you wanted deeper attribution, not lighter pricing. It leans on multi-touch modeling and incrementality thinking rather than a single pixel view. Paid media teams use it to judge creative and campaign performance at spend levels where small errors cost real money.
It is also the most honest example of a tool with a floor. Below roughly $20,000 in monthly ad spend, the models do not have enough signal to be useful.
⚙️ Solutions offered
Multi-touch attribution with modeled and platform-agnostic views
Creative-level and campaign-level performance reporting
Reasoning depth: deep on paid media, thin outside it
Connectors: strong ad platform coverage, limited operations data
Time to first reliable answer: 2 to 4 weeks of calibration
Pricing basis: tiered by spend, starts near $1,500 monthly
Verified review signal: 4.5 average across 16 G2 reviews
🎯 Best for
Brands spending $50,000 or more monthly on paid media
In-house media buyers who test creative weekly
Teams with someone who can own a reporting tool full-time
💬 Reviews
"Expensive - this is really targeted towards upper mid-size to enterprise operations. Smaller eCommerce brands should probably look elsewhere. Integration could be easier or more automated." - Verified User, Northbeam G2 Verified Review
"Their onboarding process is very hard. I've been going back and forth for 29 days. They also had a DNS issue that caused some problems on the website. We couldn't even finish the setup; it was extremely hard." - Verified User, Northbeam G2 Verified Review
⚠️ Where it falls short
Those two reviews describe the same trade-off from different angles. Power costs setup time, and setup time costs cash. One reviewer also flagged data delays of roughly 48 hours while spending $5,000 a day.
Northbeam also will not answer a finance question. Landed COGS, support load, and inventory are outside its lens, which is why brands pair it with something that tracks e-commerce unit economics properly.
💰 Pricing
[ $1,500 / Month | Enterprise custom ]
1.4 Lifetimely [toc=1.4 Lifetimely]
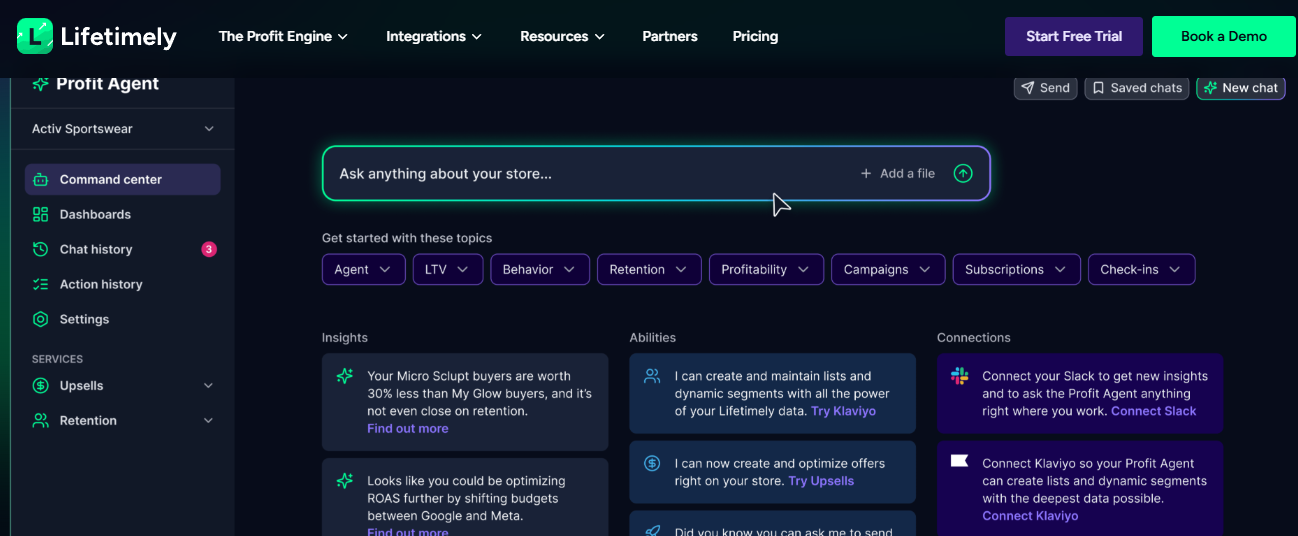
Lifetimely's Profit Agent answers LTV and retention questions inside a chat-style command center
💡 Why did we choose this tool?
Lifetimely by AMP does the job most Polar refugees actually want. It builds a daily profit and loss view, then layers customer lifetime value and cohorts on top. It is the cheapest credible way to see whether repeat purchases justify your acquisition cost.
It is also the best-reviewed dedicated app in this niche. Public listings show 4.8 stars across roughly 486 to 491 Shopify App Store reviews, with about 97% at five stars.
⚙️ Solutions offered
Daily P&L with COGS, ad spend, shipping, fees, and refunds as line items
Reasoning depth: strong on profit and LTV, none on operations
Connectors: Shopify, Meta, Google, and Amazon (paid add-on)
Time to first reliable answer: same day
Pricing basis: order volume tiers, free plan available
Verified review signal: 4.8 on Shopify, 4.6 on G2
🎯 Best for
Founders under $10M who need margin clarity this week
Subscription and repeat-purchase brands watching retention
Teams that want one honest number, not a dashboard suite
💬 Reviews
"Merchants appreciate this app for its deep insights into customer lifetime value and profitability, highlighting its detailed cohort analysis and intuitive dashboard. The responsive customer support and features like real-time profit tracking and automated reports are also praised for their time-saving benefits." - Shopify App Store merchant review summary, Lifetimely Shopify App Store Verified Reviews
⚠️ Where it falls short
Amazon integration is the recurring complaint, and it costs extra. If a real share of your revenue sits on marketplaces, test that connection before you commit, and read our take on Amazon brand analytics first.
You also cannot ask it why something happened. It reports numbers well and explains them not at all.
💰 Pricing
[ Free to $299 / Month ]
1.5 Daasity [toc=1.5 Daasity]
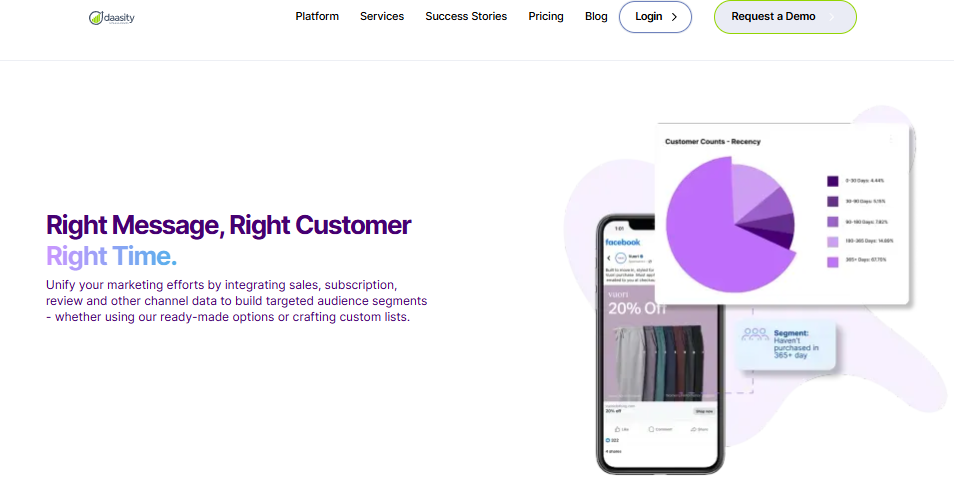
Daasity models sales, subscription, and review data into governed segments your analyst can query
🏗️ Why did we choose this tool?
Daasity is the closest structural replacement for what Polar actually is. It manages the pipelines and gives you pre-built ecommerce data models inside a warehouse you control. You then plug in whatever BI tool your team already knows.
That is a genuine upgrade if you own your data strategy. It is a burden if nobody on payroll writes SQL, which is a query language for pulling data from a database.
⚙️ Solutions offered
Managed ETL pipelines into Snowflake, BigQuery, or Redshift
Pre-built ecommerce data models and semantic layer
BI-agnostic output to Looker, Tableau, or Power BI
Time to first reliable answer: weeks, with implementation
Pricing basis: platform fee, from roughly $1,899 monthly
Verified review signal: limited public volume
🎯 Best for
Brands above $20M with a data analyst in-house
Multi-brand groups needing one governed data model
Teams already committed to a BI tool they like
⚠️ Where it falls short
Daasity gives you infrastructure, not answers. The bill arrives on day one, and the insight arrives after someone models it.
I would skip it entirely below $20M in revenue. You would be paying for a data team you have not hired yet, when a lighter ecommerce business intelligence setup would answer the same questions.
💰 Pricing
[ $1,899 / Month | Enterprise custom ]
1.6 Peel Insights [toc=1.6 Peel Insights]
🔁 Why did we choose this tool?
Peel automates the cohort work most founders never get around to. It shows retention curves, repeat purchase rates, and product affinity without you building anything. For a retention-led brand, that is the one report that changes decisions.
It earns its spot on capability. It also carries the weakest public sentiment signal on this list.
⚙️ Solutions offered
Automated cohort and retention analysis
Repeat purchase rate and time-between-orders metrics
Product affinity and basket analysis
Customer segmentation with LTV views
Scheduled email reporting
📊 Core evaluation metrics
Reasoning depth: strong on retention, narrow elsewhere
Connectors: Shopify-first, lighter on ads and finance
Time to first reliable answer: days
Pricing basis: order volume tiers, free under 16K orders
Verified review signal: -67 public sentiment score, small sample
🎯 Best for
Consumables and subscription brands tracking repeat rates
Retention or CRM leads reporting weekly to a founder
Stores with enough order history for cohorts to mean something
⚠️ Where it falls short
Public sentiment analysis put Peel at -67 across a very small mention count, which is the lowest on this list. Small samples deserve caution, but I would still run a trial before signing an annual deal.
Coverage is the other limit. Cohorts alone will not tell you why acquisition cost moved, so pair it with the wider customer retention strategies your team already runs.
💰 Pricing
[ Free to $899 / Month ]
1.7 TrueProfit [toc=1.7 TrueProfit]
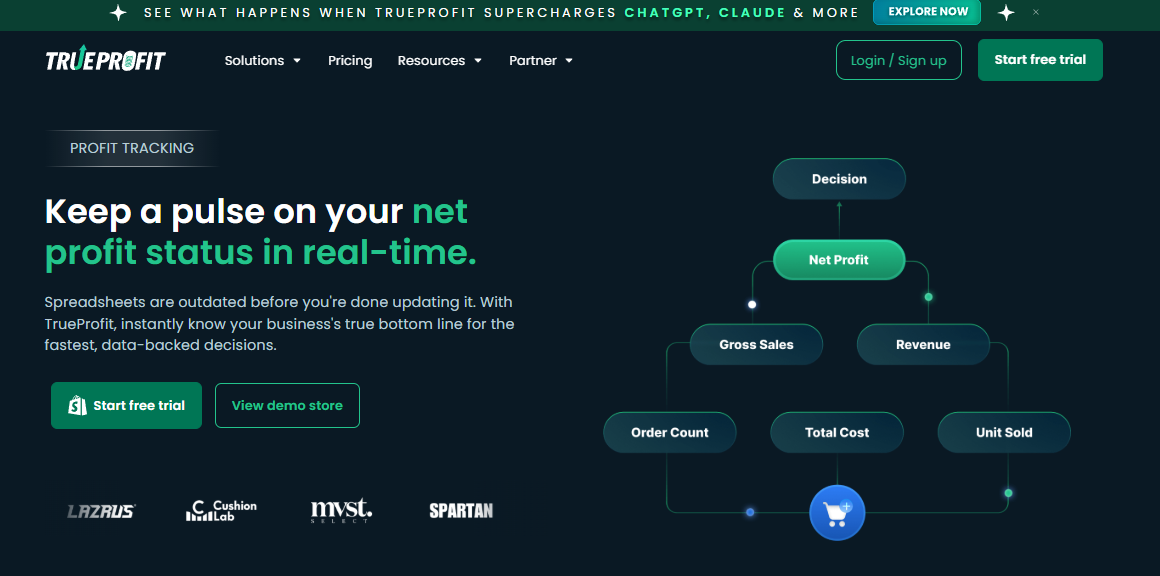
TrueProfit rolls order count, unit costs, and revenue into one live net profit number
💰 Why did we choose this tool?
TrueProfit is the lowest-cost honest answer to "am I actually making money today?" It pulls COGS, ad spend, shipping, transaction fees, and refunds into a live net profit figure. At $35 monthly, it costs less than one return.
It is not a Polar replacement in scope. It is a Polar replacement in the one number founders check first.
⚙️ Solutions offered
Real-time net profit dashboard
COGS, fees, shipping, and handling cost tracking
Order-level and product-level profit views
LTV and customer analytics basics
Ad spend sync from major channels
📊 Core evaluation metrics
Reasoning depth: single-metric focus, no root-cause work
Connectors: Shopify plus main ad platforms
Time to first reliable answer: same day, once COGS are loaded
Pricing basis: flat tiers from $35 monthly
Verified review signal: high Shopify App Store volume
Your numbers are only as good as the COGS you enter. Landed cost, duties, and returns handling need manual upkeep.
It also stops at reporting. There is no cohort depth, no forecasting, and no explanation layer.
💰 Pricing
[ $35 / Month | Higher tiers custom ]
1.8 Glew.io [toc=1.8 Glew.io]
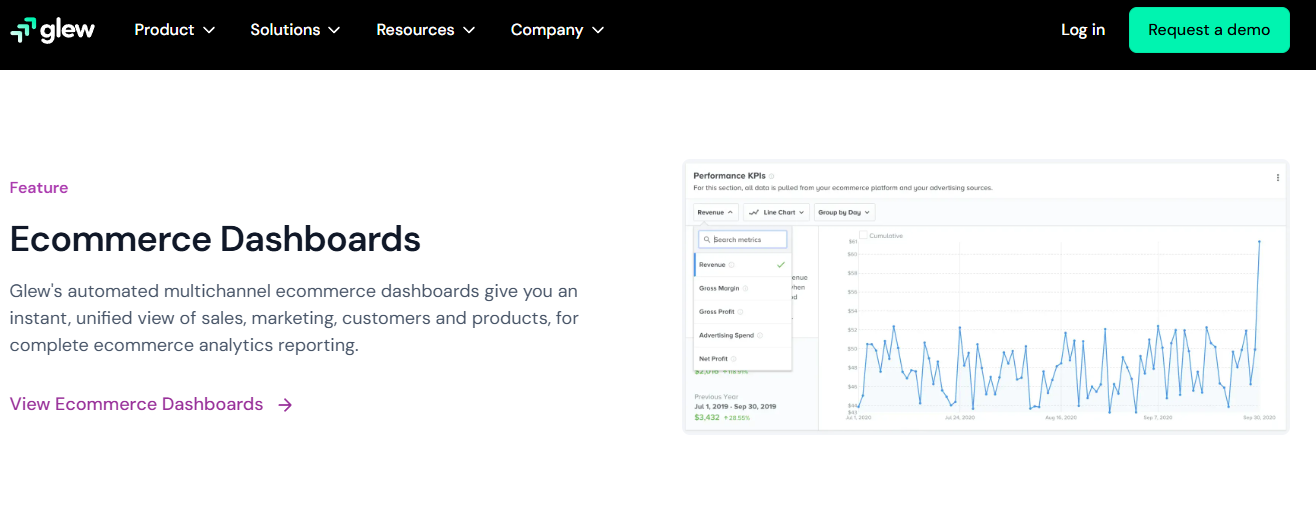
Glew consolidates multichannel sales, margin, and product KPIs into one automated reporting view
🏬 Why did we choose this tool?
Glew handles the multi-store problem better than most tools here. If you run two brands, a wholesale line, and a DTC site, it consolidates them into one reporting view. Merchandising and inventory reports are its real strength.
It has been in market long enough to have honest history. That history is mixed.
⚙️ Solutions offered
Multi-store and multi-channel consolidated reporting
Verified review signal: mixed, from 1.5 to 5 stars on G2
🎯 Best for
Multi-brand or wholesale-plus-DTC operators
Merchandising leads planning assortment by product
Teams needing exports into their own spreadsheets
💬 Reviews
"The ease of all of your data being fed into one place. Data was often not accurate and adding new data sources was hard. The visualization was also subpar." - Verified User, Glew G2 Verified Review
"Glew reports are easy to segment and export. Data is displayed in easily digestible results with points of reference to previous period and year. For a Shopify-based business, Glew offers more powerful analytical solutions than available to us in Shopify. Sometimes the software is slow to load or glitchy with realtime results. I think the software could also offer better automatic & actionable insights." - Verified User, Glew G2 Verified Review
⚠️ Where it falls short
Read those two reviews together and the pattern is clear. Coverage is wide, and accuracy plus speed depend on your setup. One five-star reviewer still noted needing to crunch data in a Google Doc first.
Automated insight is the gap the reviewers name themselves. You get reports, then you do the thinking, which is exactly the wall we describe in our guide to ecommerce reporting.
💰 Pricing
[ Quote-based ]
1.9 Littledata [toc=1.9 Littledata]
🔌 Why did we choose this tool?
Littledata solves a different problem than the rest of this list. It fixes the data collection layer before anything reads from it. Server-side tracking means events are sent from the server, not the browser, so ad blockers miss less.
If your Shopify numbers, GA4, and ad platforms disagree wildly, start here. No analytics tool can fix garbage inputs.
⚙️ Solutions offered
Server-side tracking for Shopify and subscription apps
Accurate GA4 and warehouse data pipelines
Marketing platform destinations including Meta and Google
Littledata will not replace Polar on its own. It gives you clean data, then leaves the analysis to whatever sits downstream.
Budget for two tools if you go this route. That is fine, as long as you plan for it.
💰 Pricing
[ Plan-based, published on the Shopify App Store ]
Luca AI sits at the other end of this list from Littledata on purpose. One cleans the pipe, and the nine tools above mostly render what comes out of it. Luca AI reasons across the whole pool, explains movement, and pushes the answer to Slack before you think to ask. If you want to see that reasoning against your own numbers, our use cases page shows the questions operators ask most.
Q2. How did we score and rank these Polar Analytics alternatives? [toc=2. Scoring Methodology]
Each tool was scored on Reasoning and Root-Cause Depth (25%), Data Coverage and Normalization (20%), Time to First Reliable Answer (20%), Pricing Transparency and GMV Neutrality (20%), and Verified User Reviews (15%). Bands run from one star at 0 to 20 points, up to five stars at 81 to 100. Luca AI scores five stars. Triple Whale, Northbeam, and Lifetimely land at four.
⭐ Why a feature checklist fails operators
Most comparison pages count features. That tells you nothing about whether a tool answers a real question on a Sunday night.
I used one test instead of a checklist. Ask Luca AI why contribution margin fell last week, meaning profit left after all variable costs, and it returns the drivers without anyone building a query first.
📐 The five weighted criteria
Reasoning and Root-Cause Depth (25%): does it explain movement, or only display it?
Data Coverage and Normalization (20%): does it clean and standardize your sources for you?
Time to First Reliable Answer (20%): hours, days, or a multi-week calibration period?
Pricing Transparency and GMV Neutrality (20%): is the price published, and does it climb with revenue?
Verified User Reviews (15%): what do merchants actually report, complaints included?
🧪 What each criterion really tests
Dashboard count is deliberately absent from the rubric. Building a dashboard is not the finish line, and treating it as one is how founders end up monitoring a decline instead of reversing it.
Luca AI measures Data Coverage by normalizing and standardizing every connected source on ingestion, which is the step that usually costs teams a cleanup year. Pricing Transparency penalizes GMV-linked models because that bill peaks in the quarter your cash is thinnest.
Star Ratings Across the Nine Polar Analytics Alternatives
Tool
Star rating
Luca AI
⭐⭐⭐⭐⭐
Triple Whale
⭐⭐⭐⭐
Northbeam
⭐⭐⭐⭐
Lifetimely
⭐⭐⭐⭐
Daasity
⭐⭐⭐
Peel Insights
⭐⭐⭐
TrueProfit
⭐⭐⭐
Glew.io
⭐⭐⭐
Littledata
⭐⭐⭐
Ratings and pricing inputs were verified in August 2026 against vendor pricing pages, G2 profiles, and Shopify App Store listings. The same rubric drives our wider view of AI-powered BI tools for ecommerce.
💬 What reviews changed in the scoring
Two review lines moved scores more than any feature comparison did. Both are about trusting the numbers, which is the entire reason to buy one of these.
"Triple Whale is very user-friendly and easy to navigate to find the data you need across multiple channels. Some data we still notice discrepancies between platforms, for example, tracking ads, and differences in the reported metrics like revenue." - Verified User, Triple Whale G2 Verified Review
"The ease of all of your data being fed into one place. Data was often not accurate and adding new data sources was hard. The visualization was also subpar." - Verified User, Glew G2 Verified Review
⚠️ The one tool we downgraded
Peel Insights lost a star on the review criterion, not on capability. Public sentiment analysis across X, Reddit, and LinkedIn scored it -67, the lowest here, though from a very small mention count.
Small samples deserve caution, and I might be reading that harder than it deserves. My read is that a two-week trial beats any star rating on this one.
Luca AI earns full marks on Reasoning Depth because it was trained on how ecommerce metrics relate to one another, not on rendering them faster. That distinction is the whole rubric in one line, and it is the thinking behind how Luca thinks.
Q3. Why are Shopify brands leaving Polar Analytics if the reviews are this good? [toc=3. Why Brands Switch]
Product quality is not the trigger. Polar holds 4.8 to 4.9 stars across 109 to 113 Shopify App Store reviews, ranks #41 of 1,292 analytics apps, and scores 4.8 on G2 with support rated 9.5 out of 10. Brands leave over GMV-scaling price, a vendor-managed environment, reporting-first architecture, missing COGS depth, and limited cross-functional customization.
✅ What Polar genuinely does well
Polar provisions every customer a dedicated Snowflake database with order-level data access. Roughly 1,680 stores run it, and 97% of its reviews sit at five stars.
Support is a real strength too. Polar's G2 support score of 9.5 beats Triple Whale's 8.9. The churn conversation here is about fit and cost, not competence.
💸 The five triggers that actually move brands
GMV-linked pricing. The bill climbs with revenue, from a $249 to $300 entry toward $750 and beyond.
Vendor-managed environment. The warehouse is yours to query, not yours to own.
Reporting-first architecture. You get the chart, then you supply the reasoning.
Finance-grade gaps. True contribution margin needs COGS, fees, and ERP data the tool does not hold, which is why ecommerce data integration decides so much here.
Customization limits. Questions spanning marketing, finance, and operations get hard fast.
⚠️ What the cost objections sound like
Public review sites carry the price complaint in plainer language than any vendor page will.
"The company is so lazy in their use of AI that Faizan J (employee at polar analytics) will use Mike S's (another employee) email to send a pitch email to you addressing it to Mike which isn't my name. If that is their modus operandi, how can you can trust their results?" - Matthew Wong, Polar Analytics Trustpilot Verified Review
📊 Read the sample size, not just the score
Here is the number this category never explains. Polar posts a +100 public sentiment score, and it comes from four people over twelve months.
Triple Whale scores 0 across 215 mentions in that same dataset, and Northbeam +26 across 204. Luca AI's read is that mention volume matters more than sentiment when you are stuck at midnight, because peers are who you search for first.
🧾 The question underneath the search
Nobody switches analytics tools because they dislike charts. They switch because revenue is up and the bank balance disagrees.
Millions in revenue can hide negative cash flow. Ask Luca AI which SKUs still earn money after COGS, fees, returns, and support load settle, and the answer usually reorders your ad budget, the same way a proper customer profitability analysis does.
⏰ The fallback state you are trying to escape
I have watched founders revert the moment a tool stops answering. Exports from Shopify, exports from the returns system, one enormous spreadsheet every Sunday.
That is the real cost of a reporting-only stack. It is not the subscription, it is the weekend, which is exactly the trap we describe in our guide to Shopify reporting.
Luca AI was built for that gap. It watches metric relationships continuously and pings you on Slack when ROAS dips, CAC spikes, or inventory crosses a threshold, without you opening anything.
Q4. What does Polar Analytics really cost once GMV pricing kicks in? [toc=4. True Cost Math]
Polar prices on GMV. Public sources put entry at $249 to $300 per month, the common band at $300 to $450, and higher tiers at $750 and above, with estimates exceeding $1,000 per month past roughly $6M in revenue. At Shopify's $86 average order value and 5% to 10% net margins, a $750 tool consumes the net profit of roughly 90 to 170 orders.
💰 The verified spread, disagreement included
Sources conflict here, and I would rather publish the disagreement than fake a clean number. One listing shows "from $300 per month," another puts the working band at $300 to $450 scaling with GMV, and a third cites $750 climbing past $1,000 at $6M or more.
Polar's separate LTV and Profit app lists from $249 per month. All figures verified August 2026. Pull a live quote before you budget against any of them.
📈 Why GMV pricing runs backwards
GMV-linked pricing means the invoice grows as revenue grows. That sounds fair until you map it against when cash actually leaves the business.
Your best quarter is usually your tightest quarter. Inventory is already paid for, ad spend is front-loaded, and receipts land weeks later, which is why we push operators toward cash flow forecasting before they shop for software.
🧮 Restate every price in orders
Dollars per month is the wrong unit for this decision. Orders-to-break-even is the right one, because that is what your P&L feels.
Shopify net margins typically run 5% to 10% after operating expenses and fees, on an $86 average order value. At a 7.5% midpoint, each order contributes about $6.45 in net profit.
Monthly Tool Cost Restated as Orders to Break Even
Tool
Monthly cost
Orders to break even
TrueProfit
$35
~5
Triple Whale
$129
~20
Lifetimely
$299
~46
Luca AI Starter
€299
~46
Polar (entry)
$300
~47
Luca AI Growth
€499
~77
Polar (higher tier)
$750
~116
Peel Insights
$899
~139
Northbeam
$1,500
~233
Daasity
$1,899
~294
At a 5% net margin, every figure in that right column roughly doubles. At 10%, it falls by about a quarter. Run it on your own margin, not mine.
⚠️ The reinvestment excuse to retire
"We are just reinvesting our profits" is the line I hear most from founders who cannot state their net contribution margin. It sounds disciplined. It usually means the arithmetic never got done.
Here is a two-minute stress test. If this tool cost ten times more, what would it have to deliver? If it cost a tenth, what would you give up?
⏰ What to do before your next renewal
Pull last month's order count and your true net profit per order. Divide your analytics bill by that figure, and sanity-check it against your core ecommerce KPIs.
If the answer exceeds what a slow week produces, the tool must earn its place in decisions, not just in reporting. That is a fair bar for every vendor on this list.
Luca AI is priced against the answers you need rather than the GMV you grew. Starter runs €299 monthly and Growth €499, so the invoice stays flat through the quarter your cash is thinnest. Current tiers sit on the pricing page.
Q5. Which alternative fits your revenue, ad spend, and team skills? [toc=5. Fit by Stage]
Four variables decide it: revenue, monthly ad spend, channel count, and whether anyone on your team writes SQL. Under roughly $2M with one channel, native Shopify plus GA4 is enough. From $2M to $20M with no analyst, a plain-English reasoning layer like Luca AI fits. Above $20M with a data team, warehouse-native tools earn their price.
🧠 Two architectures, explained plainly
There are only two shapes in this category. One gives you a warehouse, which is a database holding all your raw data, and expects someone to query it. The other reasons over the data and hands you an answer.
Polar sits in the first camp with a dedicated Snowflake instance per customer. Luca AI sits in the second, normalizing and standardizing sources on ingestion so nobody spends a year cleaning data first, which is the split we unpack in our guide to ecommerce analytics platforms.
💸 What happens to unused warehouse access
Picture a $4M skincare brand running Meta, Google, and Klaviyo, with no analyst on payroll. They buy warehouse access, then never open it.
That is not a hypothetical failure mode. Ask Luca AI the same question they wanted answered, and it returns the drivers without a query, which is why the warehouse sat idle in the first place.
📊 The floors nobody publishes
Revenue and Ad Spend Floors by Tool Type
Stage or spend
Sensible pick
Floor to respect
Under $2M, one channel
Native Shopify plus GA4
No paid tool needed
$2M to $20M, no analyst
Luca AI, Lifetimely
Enough order history to reason on
$20M plus, data team
Daasity, warehouse-native
Analyst on payroll
$50,000 plus monthly ads
Add Northbeam
2 to 4 weeks calibration
Multi-store or wholesale
Glew.io
Quote-based pricing
Northbeam's own reviewers name the floor better than any vendor page does.
"Expensive - this is really targeted towards upper mid-size to enterprise operations. Smaller eCommerce brands should probably look elsewhere. Integration could be easier or more automated." - Verified User, Northbeam G2 Verified Review
🔁 Why retention depth beats attribution depth right now
Agency data from Q1 2026 shows total revenue up 13.6% year over year, with more of it coming from returning customers. Meta spend rose 25.28% with only 3% ROAS degradation in the same window.
Luca AI reads cohort behavior across months and years, then flags when a repeat-purchase pattern breaks. If your growth is increasingly repeat-driven, that matters more than another blended dashboard, and it puts Shopify LTV at the center of your tool choice.
❌ Option zero, stated without hedging
Some readers should buy nothing this quarter. Operators say it plainly in forums, and no vendor page repeats it.
"If you are a small business, this will provide you enough information that you will be able to directionally understand traffic on your site. As you grow, you will need to stop using the free version." - Gitai B., Marketing, Web Analytics, and Testing Lead, Google Analytics G2 Verified Review
Triple Whale also publishes free benchmarks built from more than 60,000 stores. Between that and Looker Studio, a sub-$2M store can cover the basics for near zero, especially once Google Analytics is properly added to Shopify.
⏰ The two-minute decision
Answer three questions honestly. Does anyone write SQL, is monthly ad spend above $50,000, and do you sell on more than one platform?
Two noes and you want a reasoning layer, not infrastructure. Two yeses and you want infrastructure plus attribution, and you should budget for both.
Luca AI fits the $2M to $20M operator with no analyst and too many open tabs. It is the wrong answer for an enterprise that already employs a data team, and honestly wrong for a store too early to have data worth reasoning against. The use cases page shows where that line sits.
Q6. Why do your numbers never match, and what should you demand from a data layer? [toc=6. Data You Can Trust]
Ad platforms report modeled conversions on their own windows while Shopify records real orders after discounts and refunds. Meta narrowed its click-attributed conversion definition in March 2026. Demand three things from any replacement: reconciliation to cash, contribution margin that includes CAC, fees, returns, and support load, and reasoning you can audit. Luca AI reasons across accounting, 3PL, and support data alongside ads and orders.
💰 The invoice that ended a hero SKU
A founder once slid an invoice across the table and called it her best seller at 72% gross margin. Twenty minutes later, after we rebuilt it line by line, actual contribution margin came in at 8%.
She cried. Not because the number was bad, but because she had scaled ad spend behind it for two quarters.
📉 Gross margin is a lie
Gross margin tells you what it costs to make the thing. It says nothing about what it costs to sell the thing, which is the whole argument in contribution margin versus gross margin.
The costs between supplier invoice and real profit are where brands bleed. One product accounted for 42% of all support tickets, which worked out to $1.45 per unit in hidden cost. Ask Luca AI to allocate support load to the SKU and that expense stops hiding in overhead.
⚠️ CAC is a variable cost, not marketing spend
If you must spend money to acquire a customer to sell that unit, that is a variable cost. Treating CAC as a fixed marketing line is how founders end up profitable on paper and broke in reality.
Put it in unit economics. Every ranking page in this category leaves it out, and that omission is why their profit numbers look better than your bank balance, a gap we walk through in how to track e-commerce unit economics.
🧾 Reconcile to cash, not to the model
Meta narrowed click-attributed conversions in March 2026, reclassifying prior any-click conversions into an engaged-through bucket. Andrew Faris put it best: the bank account is the only truly reliable attribution tool.
"We are a startup company and mainly use Supermetrics for Shopify API. Data is inaccurate when it comes to Daily Total Sales and Returning Orders figures." - Verified User, Supermetrics G2 Verified Review
"It is becoming very opaque, it doesn't have real-time, the sampling is increasingly wild, and now it applies a threshold. If you don't pay for BigQuery, you're really tied hand and foot." - Verified User in Retail, Google Analytics G2 Verified Review
🔍 The cheap audit on any pixel
Post-purchase surveys ask customers where they heard about you. KnoCommerce scores +63 in public operator sentiment across 163 mentions, and Fairing +22.
That is a few hundred dollars a year against a $1,500 attribution bill. Run both and let them disagree.
❌ An AI badge is not an edge
A 2026 survey of 300 store owners representing $3.5B in revenue found 72% AI adoption producing no measurable financial edge, with non-adopters growing profit faster. Gross margins hit record highs the same year net margins hit record lows.
Bolted-on vertical AI has genuinely failed operators. One brand shut down their inventory system's built-in forecasting because it hallucinated. I sell AI, and I still think that verdict is fair, which is why we wrote how AI can actually help you run your e-commerce business.
✅ Three questions for your next demo
Ask why contribution margin moved last month, and watch whether the tool explains or just charts. Ask it to isolate AI referral traffic, which grew nearly 13x year over year on Shopify in Q1 2026.
Then ask what it cannot see. Luca AI is not an attribution pixel and does not replace one, and any vendor who claims otherwise is selling you a story.
Q7. What does switching actually cost, and how do you run the migration safely? [toc=7. Migration Playbook]
Budget for three costs: exporting history out of a vendor-managed warehouse, a reporting discontinuity when attribution windows change mid-year, and calibration time. Northbeam needs two to four weeks before output is reliable. Run the new tool in parallel for 60 days, reconcile both against native Shopify reporting, then cancel the old one.
1️⃣ Export your history before you give notice
Pull every historical export you can while your account is live. Polar provisions a dedicated Snowflake instance, so your data lives inside an environment you do not own.
Expected outcome: a clean local copy of monthly revenue, orders, and cohort tables. Failure mode: cancelling first, then discovering the export window closed.
2️⃣ Connect the new tool without touching your tracking
Add the replacement alongside your current stack. Do not remove pixels or rewrite tags in week one.
Luca AI connects Shopify, Meta, Google, Klaviyo, accounting tools, 3PL, and support sources without replacing existing tracking. Expected outcome: two systems reading the same store. Failure mode: ripping out a pixel and losing the baseline you need for comparison.
3️⃣ Reconcile three metrics weekly
Pick net revenue, order count, and blended CAC. Compare all three across the old tool, the new tool, and native Shopify reporting every Friday, using the same discipline as any automated data reporting routine.
Ask Luca AI to send that comparison to Slack each week so the check happens without a calendar reminder. Expected outcome: you learn where the tools disagree before it matters. Failure mode: discovering a 9% revenue gap during board prep.
4️⃣ Respect the calibration window
Attribution tools need learning time. Northbeam takes two to four weeks before its modeled output is trustworthy.
Do not make budget decisions on week-one numbers. Expected outcome: a reliable baseline by day 30. Failure mode: killing a profitable campaign because a model had not settled.
5️⃣ Onboard it like a new hire
A brilliant new analyst still fails on day one without context. The same is true of a data layer.
Give it your COGS, your fee structure, your return rates, and your fiscal calendar. Expected outcome: answers that match your accountant. Failure mode: garbage inputs producing confident nonsense.
⚠️ What breaks in year-over-year comparability
Definitions shift when you switch. Attribution windows, channel groupings, and refund handling rarely match between vendors.
Retail week conventions are the sneakiest one. Week 554 and week 332 are not standard across brands or platforms, and that single mismatch quietly breaks multi-channel reporting, which is why ecommerce data management deserves attention before migration day.
⏰ The cost of getting this wrong
I have watched founders revert to the old workflow mid-migration. Exports from Shopify, exports from the returns system, one giant spreadsheet consuming the weekend.
That is the real switching cost, and it never appears on a pricing page. Luca AI's read is that most failed migrations are onboarding failures, not product failures, though I hold that loosely.
🔮 What I think changes by 2027
My hunch is that the parallel run becomes permanent for most brands. You will keep one system for measurement and one for reasoning, and stop expecting either to do both.
If you are mid-switch right now, tell me which three metrics refuse to reconcile. That specific gap usually explains more about your data stack than any feature comparison will, and you can send it through our contact page.
Luca AI connects your existing sources instead of replacing your pixel. A parallel run therefore costs you a connection step rather than a reporting quarter, which is the difference between a two-week migration and a lost one.
FAQ's
What are the best Polar Analytics alternatives for Shopify brands in 2026?
The nine strongest alternatives are Luca AI, Triple Whale, Northbeam, Lifetimely, Daasity, Peel Insights, TrueProfit, Glew.io, and Littledata. Each one wins a different job, so the right pick depends on why you are leaving Polar.
Cross-functional reasoning: Luca AI answers plain-English questions across marketing, finance, and operations data, then pushes scheduled reports and anomaly alerts to Slack.
Fast operator dashboard: Triple Whale, live the same afternoon at a lower entry price.
Attribution depth: Northbeam, but only above roughly 50,000 dollars in monthly ad spend.
Profit and LTV on a budget: Lifetimely, with a free plan and a daily P and L.
Warehouse ownership: Daasity, if an analyst is already on payroll.
Data plumbing first: Littledata, when your tracking is the real problem.
We scored all nine on reasoning depth, data coverage, time to first reliable answer, pricing transparency, and verified reviews. Luca AI took the top band because it reasons over your data rather than only rendering it. If you want the wider category view before shortlisting, our breakdown of ecommerce analytics platforms covers the same ground without the Polar-specific lens.
How much does Polar Analytics cost, and is there a cheaper alternative?
Polar prices on GMV, which means the invoice grows as your revenue grows. Public sources disagree, so here is the full spread rather than one confident number, all verified in August 2026.
Entry pricing sits between 249 and 300 dollars per month.
The common working band is 300 to 450 dollars per month, scaling with GMV.
Higher tiers reach 750 dollars and above, with estimates past 1,000 dollars monthly for brands beyond roughly 6M dollars in revenue.
Cheaper options genuinely exist. TrueProfit starts near 35 dollars monthly, Lifetimely runs from free to about 299 dollars by order volume, and Triple Whale offers a free plan with paid tiers from roughly 129 dollars.
The unit that matters is orders, not dollars. At Shopify's 86 dollar average order value and a 7.5 percent net margin, each order contributes about 6.45 dollars in profit, so a 750 dollar tool consumes the profit of roughly 116 orders. Luca AI is priced flat per tier rather than against GMV, so the bill does not spike in the quarter your cash is thinnest. Current tiers are on our pricing page.
Is Triple Whale a better Polar Analytics alternative for a DTC brand?
It depends on whether you want a dashboard or an explanation. Triple Whale is the faster switch if you mainly want the blended view back at a lower entry price, with a first-party pixel and an AI assistant included.
Two honest caveats matter before you commit.
Attribution disagreement: G2 reviewers report discrepancies between Triple Whale, Shopify, and their email or SMS platforms, so verify against native Shopify reporting for your first 60 days.
Finance visibility: you get marketing clarity, not a full profit and loss statement with landed COGS, fees, and support load. The question "which SKU is actually profitable" stays unanswered.
Triple Whale is also the most discussed tool in this category, with 215 substantive public mentions against just 4 for Polar over twelve months. That peer volume genuinely helps when you are troubleshooting at midnight.
Luca AI is not an attribution pixel and does not replace one, so treat these as complements rather than direct swaps. We compared the trade-offs in detail in our guide to Triple Whale alternatives.
Do I need a data warehouse and SQL, or just an analytics tool?
If nobody on your team writes SQL, a dedicated warehouse is infrastructure you will pay for and never query. That single question filters this entire category faster than any feature comparison.
Polar provisions a dedicated Snowflake database per customer with order-level data access, which is genuinely valuable above roughly 10M dollars in GMV with an analyst on staff. Below that, the access usually sits unused while the invoice keeps arriving.
Use these thresholds as a starting rubric:
Under 2M dollars, one channel: native Shopify reporting plus GA4 is enough.
2M to 20M dollars, no analyst: choose a plain-English reasoning layer.
Above 20M dollars with a data team: warehouse-native tools such as Daasity earn their price.
Above 50,000 dollars monthly ad spend: add dedicated attribution on top.
Luca AI normalizes and standardizes every connected source on ingestion, so the cleanup year that warehouse projects usually require never starts. That is the practical difference between buying infrastructure and buying an answer, and it is the logic behind how Luca thinks.
How do I switch off Polar Analytics without losing my reporting history?
Run a parallel migration and never cancel first. Budget for three real costs: exporting history out of a vendor-managed warehouse, a reporting discontinuity when definitions change mid-year, and calibration time on any new attribution model.
Export while live. Pull monthly revenue, orders, and cohort tables before you give notice, because the export window closes with the account.
Connect the replacement alongside your stack. Do not remove pixels or rewrite tags in week one.
Reconcile three metrics weekly. Compare net revenue, order count, and blended CAC across the old tool, the new tool, and native Shopify reporting every Friday.
Respect calibration. Northbeam needs two to four weeks before its output is trustworthy, so avoid budget decisions on week-one numbers.
Onboard it like a new hire. Load your COGS, fee structure, return rates, and fiscal calendar.
Watch retail week conventions closely, since non-standard week numbering quietly breaks year-over-year comparability. Luca AI connects your existing sources instead of replacing your pixel, so a parallel run costs a connection step rather than a reporting quarter. Send us the metrics that refuse to reconcile through our contact page.
Enjoyed the read? Join our team for a quick 15-minute chat — no pitch, just a real conversation on how we’re rethinking Ecommerce with AI - Luca
Loading Schedule...
Your AI Co-Founder is here.
Here’s why:
Shopify, Meta, Xero - one brain.
"Should I scale?" Answered with real data.
Growth capital. No applications. One click.
Thank you! Your submission has been received! Please book a time slot for the Meeting
Oops! Something went wrong while submitting the form.