The 10 best AI BI tools for e-commerce in 2026 are Luca AI, Triple Whale, Polar Analytics, Glew.io, Peel Insights, Daasity, Improvado, Domo, Sellerboard, and Fairview.
We scored every tool out of 100 across reasoning depth, multi-channel coverage, accuracy, usability, and reviews, then mapped scores to five-star bands.
Most tools only display data, while an AI reasoning layer extracts, predicts, simulates, root-causes, and pushes agentic reports to Slack or email.
Gross margin misleads because it ignores the eight costs of selling, so true per-SKU contribution margin, frozen at time of sale, is what matters.
In a 2026 audit of 24 tools, 13 hallucinated a SKU or margin number, so clean standardized data plus human sign-off is non-negotiable.
Choose by revenue stage and biggest constraint: attribution, marketplace margin, or an AI layer that reasons across your whole data warehouse.
Q1. What Are the 10 Best AI-Powered BI Tools for E-commerce in 2026? [toc=1. Best AI BI Tools]
The 10 best AI-powered BI tools for e-commerce in 2026 are Luca AI, Triple Whale, Polar Analytics, Glew.io, Peel Insights, Daasity, Improvado, Domo, Sellerboard, and Fairview. Luca AI leads the list. It does not just chart what happened. It extracts the data that matters for a specific question, predicts from your history, finds the root cause, and pushes reasoned reports to Slack or email.
Here is the shortlist, with one line on what each tool is actually for:
1.2 Triple Whale: Best for Shopify-first ad attribution
1.3 Polar Analytics: Best for fast no-code Shopify dashboards
1.4 Glew.io: Best for omnichannel multi-store reporting
1.5 Peel Insights: Best for retention and cohort analytics
1.6 Daasity: Best for data-warehouse modeling at scale
1.7 Improvado: Best for marketing data aggregation
1.8 Domo: Best for enterprise BI with AI assist
1.9 Sellerboard: Best for Amazon and marketplace profit
1.10 Fairview: Best for multi-channel margin auditing
📊 How we built this list
I did not want another ranking pulled from vendor decks. So we tested each tool with 10 of our own real e-commerce questions first. We leaned on live 2026 research, operator threads, and first-party G2 and Shopify signal over marketing copy. One number stuck with me. In a 2026 audit of 24 tools, 13 hallucinated at least one SKU or margin figure. That is the bar. A tool that invents numbers is worse than no tool.
⏰ Why this list matters on a Monday morning
Most founders I talk to are stuck being the human middleware. You spend two days and three pivot tables just to see if your hero SKU actually makes money. Meanwhile, you are barely touching 5% of the data your store generates every day. The gap here is simple. Old dashboards tell you what happened. The tools worth paying for tell you what to do next. This table is the shortcut to finding the right ecommerce analytics platform for your stage.
At-a-Glance Comparison
10 Best AI-Powered BI Tools for E-commerce in 2026
Brands selling across Shopify, Amazon, Walmart, eBay
$200/mo to $1,000+/mo
Pricing reflects publicly listed 2026 ranges and shifts with GMV and seats, so confirm current numbers with each vendor before you commit.
1.1 Luca AI: Best for AI Reasoning Over Your Data Warehouse [toc=1.1 Luca AI] ⭐⭐⭐⭐⭐
Luca homepage positioning a single AI intelligence layer for €1M–€100M ecommerce brands, exemplifying how AI-powered BI tools surface insights and recommend actions through conversational analytics.
❤️ Why did we choose this tool?
I am Eric, founder of Luca, so read this with that lens. But I put Luca first for one honest reason. Most analytics tools bolted AI on top of a dashboard. We built Luca as AI first. It sits over your unified data warehouse and answers plain-English questions with reasoning, not just a chart. It works like a junior data analyst who never sleeps. No SQL, no dashboard-building, no analyst in the loop. That combination of cross-functional reasoning and a "second brain" that finds problems for you is why it earns the top slot here.
📊 Why did we choose this tool? (Core capabilities)
Plain-English queries: Ask a question, get a reasoned answer. No SQL required.
Root-cause reasoning: Luca finds the metrics that drove an outlier, not just the outlier.
Prediction and simulation: It forecasts from your history and models "what if" scenarios.
24/7 outlier alerts: Luca pings you when ROAS dips, CAC spikes, or inventory drops below your threshold.
Agentic reports: Schedule weekly or monthly reports with graphs and reasoning, pushed to Slack or email.
✅ Best for
Industry and size: DTC and multi-channel brands from roughly $1M to $50M in revenue.
Data reality: Operators drowning in scattered sources who want one source of truth.
Requirement: Teams that want recommendations and root cause, not another passive dashboard.
Here is a moment that shows the difference. A founder told me he calculated net profit for a brand-new delivery market in 5 minutes with AI reasoning. Before, he had to email an expert and wait 2 days, and by then the customer had lost interest. That is the shift from descriptive to prescriptive. As one operator put it, "the data is for the LLM," and the decision is for you. When Luca reasons across marketing, finance, and inventory together, that is where the real magic starts.
⚠️ Where Luca is not the fit
I would rather tell you upfront. If you are sub-$10K MRR, pure B2B, or a marketplace-only seller with one channel, Luca is likely more than you need right now. We built it for operators juggling real cross-functional complexity.
💰 Case Study
What was the problem? A US skincare brand doing mid-seven figures could not tell why margin was slipping. Their team burned two days a week stitching Shopify, Meta, and Xero exports into one view.
How Luca helped? They connected their sources to Luca and asked, in plain English, why contribution margin fell in Q2. Luca traced it across discounting, rising freight, and a returns spike on one SKU line. It then set an alert for future margin dips.
What was the outcome? 😊 The team cut reporting time from roughly 10 hours a week to under 1. They caught the bleeding SKU line before it dented Q3, and reallocated spend toward their true-margin winners.
1.2 Triple Whale: Best for Shopify-First Attribution [toc=1.2 Triple Whale] ⭐⭐⭐⭐
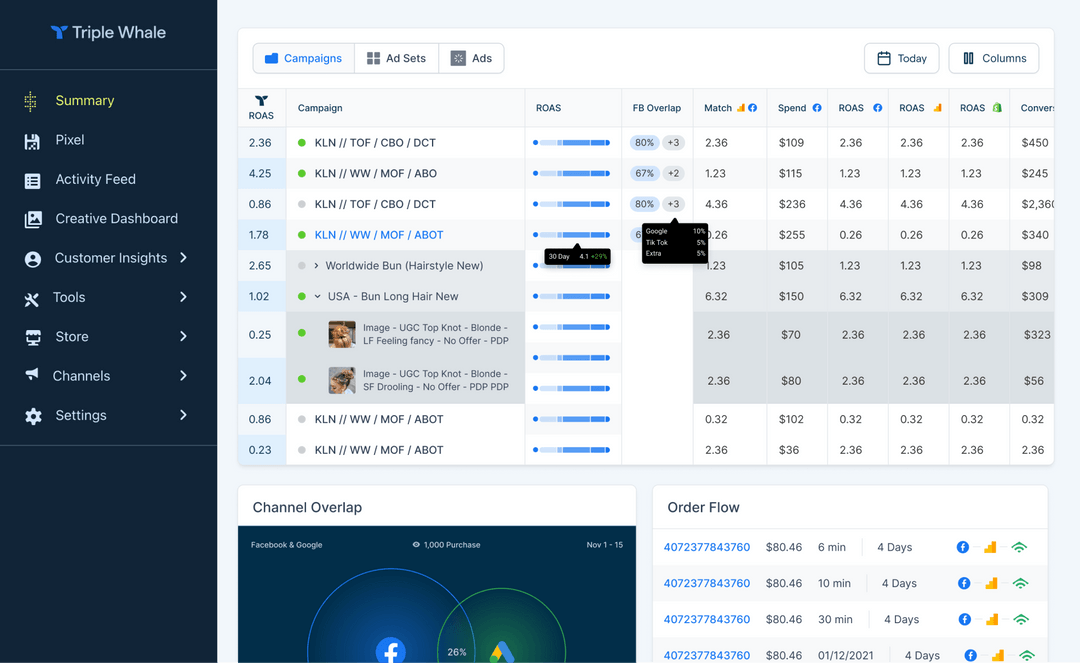
Triple Whale dashboard aggregating ROAS, ad spend and channel overlap with order flow data, demonstrating an AI-powered BI tool that unifies ecommerce metrics for smarter decision-making.
📊 Why did we choose this tool?
Triple Whale earned its place as the default attribution layer for Shopify DTC brands. It stitches your ad platforms, Shopify, and CRM into one view, and its Triple Pixel gives cleaner post-iOS attribution than most native reports. Its Moby AI assistant answers ad-performance questions in plain language. For a paid-media-led brand, it is a genuinely useful daily cockpit for tracking spend and blended metrics across channels.
📊 Core capabilities
Multi-touch attribution: Triple Pixel tracks the customer journey across ad channels.
Ad-spend dashboards: One view of Meta, Google, TikTok, and more.
Daily profit summary: A quick read on daily sales and blended ROAS.
Moby AI assistant: Ask ad-performance questions in natural language.
Creative analytics: See which ads actually earned spend from the algorithm.
✅ Best for
Industry and size: Shopify DTC brands, roughly $1M to $30M, that are paid-media heavy.
Data reality: Teams whose biggest question is "which ad drove this sale?"
Requirement: Marketing-first attribution rather than finance or inventory depth.
⚠️ Where it breaks
The honest knock, from operators themselves, is accuracy and support at higher tiers. Reviewers flag that dashboard numbers can overstate sales and ROAS when returns are not fully accounted for, and that Amazon data is thinly supported. It is a marketing tool at heart, so it sees your ad spend clearly but misses the full cash-flow and cross-functional picture. If attribution is your core need, our roundup of Triple Whale alternatives compares the trade-offs.
😊 Reviews
"I love how seamlessly it connects our ad platforms and CRM data, showing exactly where our conversions come from and which campaigns drive the most revenue. Its made attribution so much clearer." G2 verified reviewer Triple Whale G2 Verified Review
"The concept behind the system is quite good. However, despite paying over 600 each month, we still do not receive any customer support. We have been waiting for a resolution to one issue for three months now. The attribution system is consistently buggy and unreliable." G2 verified reviewer Triple Whale G2 Verified Review
💡 Where Luca fits differently
Triple Whale answers "which ad worked?" Luca answers "why did the business move, and what should I do?" Because Luca reasons over your full unified data, it connects that same ad data to margin, returns, and inventory in one thread, then flags the outlier before you go looking. Different job, wider lens. You can see how Luca thinks or explore its use cases to compare the approach directly.
1.3 Polar Analytics: Best for Fast No-Code Shopify Dashboards [toc=1.3 Polar Analytics] ⭐⭐⭐⭐
📊 Why did we choose this tool?
Polar Analytics is the tool I point solo operators toward when they want dashboards fast and have no data team. It plugs into Shopify and your ad platforms, then blends the metrics into clean, no-code dashboards. You get one view of revenue, acquisition, and email without touching a spreadsheet. For a lean brand that just needs its numbers in one place, it is quick to stand up and easy on the eyes. If you are weighing options here, our roundup of the best Shopify analytics apps is worth a look.
📊 Core capabilities
No-code dashboards: Build views without SQL or a data analyst.
Blended metrics: See revenue, CAC, and ROAS across channels in one screen.
Shopify-native connectors: Fast setup for Shopify-first brands.
AI insights: Surfaces basic trends and anomalies automatically.
Custom reports: Assemble the metrics that matter to your store.
✅ Best for
Industry and size: Small-business DTC brands, typically under 50 staff.
Data reality: Teams with a few core sources, mostly Shopify plus ads.
Requirement: Fast, good-looking dashboards over deep cross-functional reasoning.
⚠️ Where it breaks
The recurring complaint is support and pricing clarity, not the dashboards themselves. Reviewers report slow responses after onboarding, and one flagged a gap between the price shown in Shopify and the sales quote. It is a dashboard layer, so it presents your data well but does not reason across it or act on your behalf.
😊 Reviews
"Polar Analytics centralizes revenue, acquisition, and emailing with ease... Sometimes the data takes time to update, and some ratios are more difficult to understand." Juliette P., CEO Polar Analytics G2 Verified Review
"I believe this is a great product, and solves many problems for brands with more complex reporting. However, from the get go there were some discrepancy in the pricing... when you pay that amount of money, you expect a flawless product which isnt the case." Matthew Wong Polar Analytics Trustpilot Verified Review
1.4 Glew.io: Best for Omnichannel Multi-Store Reporting [toc=1.4 Glew.io] ⭐⭐⭐
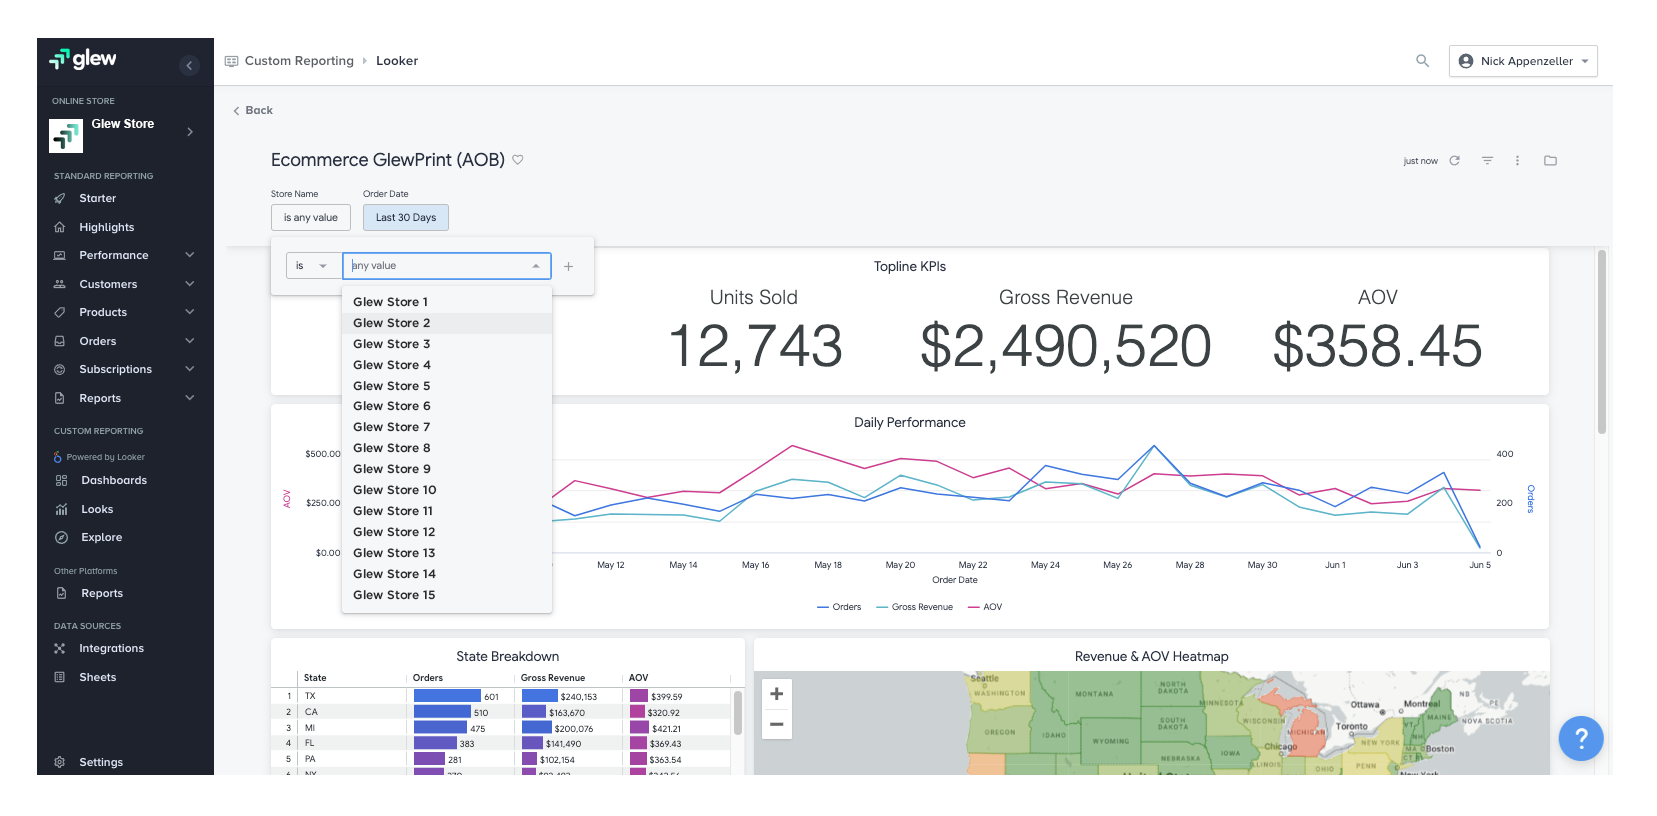
Glew business intelligence dashboard showing ecommerce KPIs like units sold, gross revenue and AOV with daily performance trends, illustrating an AI-powered BI tool for multi-store ecommerce analytics.
📊 Why did we choose this tool?
Glew.io earns its slot for operators running several stores or channels at once. It pulls sales, customer, and product data into one place and does channel-level revenue attribution. If you sell across Shopify, marketplaces, and wholesale, Glew gives you segmentation and export options that native Shopify reports simply do not. It is a reporting workhorse for the multi-store crowd, and pairs well with a broader ecommerce omnichannel analytics approach.
📊 Core capabilities
Multi-store reporting: Consolidate several stores into one view.
Channel attribution: See revenue by channel and even by campaign.
Customer segmentation: Group by frequency, product, and lifetime value.
CSV export: Pull data out for deeper manual analysis.
Looker-based dashboards: Flexible, if you invest time to configure them.
✅ Best for
Industry and size: Multi-store and omnichannel operators, small to mid-market.
Data reality: Several channels needing consolidated revenue attribution.
Requirement: Segmentation and export over conversational, automated insight.
⚠️ Where it breaks
Operators praise the attribution but flag data accuracy and setup effort. Some still crunch numbers in a Google Doc to make Glew pull correctly, and the visualizations get called subpar. It is reporting, not reasoning, so you still connect the dots yourself.
😊 Reviews
"Glew helps us acheive accurate channel revenue attribution. Not only can we view by channel, but even by campaign. This helps us see what channel/campaign is working and put our dollars in the right place." G2 verified reviewer Glew G2 Verified Review
"The ease of all of your data being fed into one place... Data was often not accurate and adding new data sources was hard. The visualization was also subpar." G2 verified reviewer Glew G2 Verified Review
1.5 Peel Insights: Best for Retention and Cohort Analytics [toc=1.5 Peel Insights] ⭐⭐⭐⭐
📊 Why did we choose this tool?
Peel Insights is the pick when repeat purchase is your whole business. It specializes in cohort analysis, which means grouping customers by when they first bought, then tracking how they behave over time. For subscription and consumable brands, Peel automates the retention math that usually lives in a fragile spreadsheet. It answers "are my newer cohorts worth more or less than last year's?" without a manual rebuild, which is core to tracking ecommerce customer lifetime value.
📊 Core capabilities
Cohort analysis: Track customer groups by first-purchase date.
Retention curves: See repeat-purchase behavior over time.
LTV tracking: Monitor lifetime value by cohort and product.
Automated insights: Surfaces retention shifts without manual pulls.
Shopify integration: Connects to your store data directly.
✅ Best for
Industry and size: Subscription and repeat-purchase DTC brands.
Data reality: Stores where retention, not just acquisition, drives profit.
Requirement: Deep cohort depth over broad cross-functional coverage.
⚠️ Where it breaks
Peel is deliberately narrow. It goes deep on retention but does not cover ad attribution, inventory, or finance in one view. If retention is one of five problems on your desk, you will still need other tools around it. That focus is a strength for the right brand and a limit for everyone else.
One founder captured the mindset this whole category is moving toward:
"Cohort-level vigilance, without the cohort-level dashboard."
That is exactly the shift. You want the vigilance, not another dashboard to babysit.
1.6 Daasity: Best for Data-Warehouse Modeling at Scale [toc=1.6 Daasity] ⭐⭐⭐⭐
📊 Why did we choose this tool?
Daasity is for scaling brands ready to build a real data stack. It handles ELT, which means extracting your data, loading it into a warehouse, and transforming it into models your team can trust. It ships with e-commerce-specific data models, so you are not building contribution margin logic from scratch. For a brand with an analyst or agency, Daasity is a serious foundation for your e-commerce tech stack.
📊 Core capabilities
ELT pipelines: Move and transform data into a central warehouse.
Pre-built ecom models: Standardized logic for orders, LTV, and margin.
Custom reporting: Build governed reports on a clean data layer.
Multi-source connectors: Pull Shopify, ads, and back-office data together.
BI tool compatibility: Feeds Looker, Tableau, and similar front ends.
✅ Best for
Industry and size: Mid-market brands, roughly $10M and up.
Data reality: High data volume across many sources needing governance.
Requirement: A warehouse foundation, with an analyst to run it.
⚠️ Where it breaks
Daasity assumes technical resources. Without an analyst or agency, the power sits idle, and time-to-value stretches out. It is infrastructure, not a plug-and-ask tool, so a busy founder rarely gets answers directly from it.
1.7 Improvado: Best for Marketing Data Aggregation [toc=1.7 Improvado] ⭐⭐⭐⭐
📊 Why did we choose this tool?
Improvado belongs here for agencies and mid-market marketing teams drowning in channels. It aggregates data from hundreds of sources, then pushes clean data into your warehouse or BI tool. The transformation layer lets you blend across platforms in ways direct connectors cannot. For teams reporting on many advertisers, it saves real hours through solid ecommerce data integration.
📊 Core capabilities
500+ connectors: Pull from most ad and marketing platforms.
Data transformation: Blend and reshape data across sources.
Warehouse delivery: Push scrubbed data to BigQuery or similar.
Automated pipelines: Reduce manual export and aggregation work.
Custom mapping: Standardize metrics across accounts.
✅ Best for
Industry and size: Agencies and mid-market marketing teams.
Data reality: Many marketing sources needing one clean destination.
Requirement: Aggregation and pipelines over plain-English answers.
⚠️ Where it breaks
Improvado has a steep learning curve, by users' own accounts. If you do not know databases and data transformations, it is hard to implement and even harder to onboard teammates onto. It is a pipe, not an analyst, so it moves data but does not interpret it.
😊 Reviews
"Setting up Improvado has been a breeze. Once the destination is configured, adding new data sources is a pretty seamless process... Custom data loads and support projects beyond the off the shelf products have been lacking in quality and speed." G2 verified reviewer Improvado G2 Verified Review
"There is a steep learning curve, and if you arent familiar with databases, Excel, and data transformations, this could be a really tough software to implement... getting my teammates onboarded is a lot of work." G2 verified reviewer Improvado G2 Verified Review
1.8 Domo: Best for Enterprise BI with AI Assist [toc=1.8 Domo] ⭐⭐⭐⭐
📊 Why did we choose this tool?
Domo makes the list for larger retailers that need enterprise BI with governance. It combines data integration, visualization, and an app ecosystem, plus AI assist for querying data. For an organization with many stakeholders and strict access controls, Domo scales in ways a lightweight dashboard cannot. It is built for scale and oversight, a true ecommerce business intelligence platform.
📊 Core capabilities
Enterprise BI: Governed dashboards for many stakeholders.
Data integration: Broad connector library across systems.
AI assist: Natural-language querying over your data.
App ecosystem: Extend with pre-built and custom apps.
Access controls: Role-based governance for larger teams.
✅ Best for
Industry and size: Larger retailers and mid-market-plus organizations.
Data reality: Many users, many systems, strict governance needs.
Requirement: Enterprise scale over founder-friendly simplicity.
⚠️ Where it breaks
Domo can be heavy and pricey for a lean DTC brand. The power comes with cost and setup that a sub-$10M store rarely needs. It is enterprise software, so the fit narrows as your team gets smaller.
1.9 Sellerboard: Best for Amazon and Marketplace Profit [toc=1.9 Sellerboard] ⭐⭐⭐
📊 Why did we choose this tool?
Sellerboard is the value pick for Amazon-first sellers. It focuses on accurate profit tracking, accounting for FBA fees, PPC spend, refunds, and returns that Amazon reports bury. For marketplace sellers, it answers the one question that matters: what did I actually keep after Amazon took its cut? At its price point, it is hard to beat for that job, and it complements broader Amazon brand analytics.
📊 Core capabilities
Amazon profit tracking: Real net profit after fees and returns.
PPC analytics: Track advertising cost against product profit.
Refund and fee accounting: Catches the costs Amazon reports hide.
Inventory alerts: Flags low stock before you run out.
Affordable tiers: Low monthly cost for small sellers.
✅ Best for
Industry and size: Amazon and marketplace-first sellers, small to mid.
Data reality: Marketplace data where fee accuracy drives profit.
Requirement: Amazon profit clarity over multi-channel reasoning.
⚠️ Where it breaks
Sellerboard is Amazon-centric by design. If your growth is on Shopify or across many channels, it does not give you the unified DTC picture. It is a marketplace profit tool, so its lens stays inside Amazon's walls.
1.10 Fairview: Best for Multi-Channel Margin Auditing [toc=1.10 Fairview] ⭐⭐⭐⭐
📊 Why did we choose this tool?
Fairview closes the list as the margin auditor for true multi-channel brands. It connects Shopify, Amazon, Walmart, and eBay, then tracks contribution margin across all of them. Its own 2026 testing found that only a minority of tools connect all four channels natively, and that 13 of 24 AI tools hallucinated a SKU or margin number. Fairview leans into that gap by making margin accuracy the whole point, a priority we cover in our guide to ecommerce profit margins.
📊 Core capabilities
Multi-channel coverage: Native Shopify, Amazon, Walmart, and eBay.
Contribution-margin tracking: Per-SKU margin after real selling costs.
Cross-channel view: One margin picture across marketplaces.
Accuracy focus: Built around trustworthy margin numbers.
Buyer-grade reporting: Audit-style clarity on where you make money.
✅ Best for
Industry and size: Multi-channel brands selling across marketplaces.
Data reality: Sellers needing one true margin view across four channels.
Requirement: Margin auditing over conversational or agentic analysis.
⚠️ Where it breaks
Fairview is strong on margin but narrower on the full analytics and proactive-alerting picture. It audits where you make money, then leaves the broader "why did the business move, and what next?" reasoning to you or another tool.
💡 How Luca fits across this whole list
Here is the pattern I keep seeing. Every tool above is excellent at one slice. Polar and Glew present data. Peel goes deep on retention. Daasity and Improvado move and model it. Sellerboard and Fairview nail one profit angle. ❌ The catch is that you, the founder, still do the manual triangulation across them. ✅ Luca reasons across marketing, finance, and inventory in one place, ✅ then scans your data 24/7 and pings you when ROAS dips or inventory falls below threshold. That is the difference between owning a wall of dashboards and having a second brain that connects them for you.
Q2. How Did We Score These Tools? Our Selection Criteria [toc=2. Selection Criteria]
Each tool was scored out of 100 across five weighted criteria: Cross-Functional Reasoning Depth (30%), Multi-Channel Data Coverage (20%), Accuracy and Trust (20%), Setup and Usability (15%), and User Reviews (15%). Tools scoring 81 to 100 earn 5 stars, 61 to 80 earn 4, 41 to 60 earn 3, 21 to 40 earn 2, and 0 to 20 earn 1. Luca AI scores 5 stars.
📊 Why these five criteria, and why reasoning ranks highest
I weighted reasoning depth at 30% on purpose. Most tools in this space still just display data. As one operator put it, we should "stop building dashboards to show technical capabilities," because dashboards were meant to "take out the decisions" normal people cannot pull from raw data. That is the bar I care about. A tool that answers "why did margin drop and what do I do?" beats one that shows a prettier chart, which is the shift toward real ecommerce business intelligence.
Multi-channel coverage matters just as much for anyone past one sales channel. In a 2026 audit of 24 tools, only a minority connected Shopify, Amazon, Walmart, and eBay natively, and 13 of the 24 hallucinated at least one SKU or margin number. That is why Accuracy and Trust carries a full 20%. A confident wrong number is worse than no number, especially for teams relying on ecommerce data analytics to make calls.
Scoring Criteria and Weighting
Criterion
Weight
What it measures
Cross-Functional Reasoning Depth
30%
Can it reason across marketing, finance, and inventory, not just chart one silo?
Multi-Channel Data Coverage
20%
Native connectors across Shopify, marketplaces, ads, and finance tools
Accuracy and Trust
20%
Data fidelity, hallucination rate, and dependable numbers
Setup and Usability
15%
Time to value and whether a non-analyst can use it
User Reviews
15%
Verified G2, Trustpilot, and Reddit sentiment
⭐ How the stars translate for a busy founder
The star bands exist so you can scan and move on. More stars means the tool scored higher on reasoning and coverage, not just on looks. I kept the exact scores out of the article on purpose, because a single number pretends to a precision this category does not have. The stars are directional, and you should still test any tool against your own real questions, ideally the ones that surface in your ecommerce reporting.
Star Band Scoring Guide
Star Band
Score Range
Read it as
⭐⭐⭐⭐⭐
81 to 100
Reasons across functions, reliable, founder-ready
⭐⭐⭐⭐
61 to 80
Strong in its lane, some gaps
⭐⭐⭐
41 to 60
Useful for one job, narrow
⭐⭐
21 to 40
Limited fit for scaling brands
⭐
0 to 20
Skip for this use case
Luca AI is the reference 5-star tool here for one reason. It scores at the top on reasoning depth and coverage because it reasons across your data instead of parking it in a dashboard. When I judge tools against these five criteria, that cross-functional depth is the axis most of the category still misses. You can see how Luca thinks for a closer look at that reasoning layer.
Q3. Luca AI Review: An AI Reasoning Layer Over Your Data Warehouse [toc=3. Luca AI Review]
Luca AI is an AI layer that sits over your unified data warehouse and answers business questions in plain language. Instead of static dashboards, it extracts the data relevant to a situation, predicts from history, simulates scenarios, finds root causes and influencing components, and flags both weak spots and well-optimized areas. Its agentic engine then pushes customized reports to Slack, email, and other channels on a schedule.
⚠️ The problem: you are drowning in dashboards
Here is the daily reality I see. You have Shopify open, Meta open, and a spreadsheet stitching them together by hand. You spend two days and three pivot tables to answer one question about your hero SKU. Most founders are barely touching 5% of the data their store generates. The tools are not the bottleneck. The manual synthesis between them is, which is why ecommerce data integration matters so much.
⏰ The proof: a 5-minute answer instead of a 2-day wait
A founder told me he calculated net profit for a brand-new delivery market in 5 minutes with AI reasoning. Before that, he had to email an expert and wait 2 days, and by then the customer had lost interest. That is the shift Luca is built for. Another operator described tasks "you would think would take two weeks" getting done in about 90 seconds. When you reason across silos instead of exporting between them, that is where the real magic starts, and it is core to how AI can actually help you run your business.
📊 What Luca actually does
Luca is not attribution software. It is reasoning over your full data pool, which is a different job. We built it to work like a junior data analyst who never clocks out.
Extract: Pull the exact data a question needs, in plain English, no SQL.
Predict: Forecast from your historical patterns.
Simulate: Model "what if we shift spend or raise price?" scenarios.
Root-cause: Trace an outlier to the metrics that actually drove it.
Find influencers and optimized areas: Flag what is bleeding and what is already working.
On top of that, Luca scans your data 24/7 and pings you when ROAS dips, CAC spikes, or inventory falls below your threshold. You can also tell it, in plain words, to send a weekly CAC report with graphs, reasoning, and charts. It arrives in Slack or email without you lifting a finger, a workflow we detail in our guide to agentic AI for ecommerce founders.
✅ Who it fits, and who it does not
Luca AI Rating: ⭐⭐⭐⭐⭐
I would rather be honest about fit than win a bad-fit customer. Luca is built for DTC and multi-channel brands roughly between $1M and $50M in revenue that are tired of manual triangulation. If you are sub-$10K MRR (monthly recurring revenue), pure B2B, or a single-channel marketplace-only seller, it is likely more than you need today. For everyone in that scaling middle, it replaces the wall of dashboards with one second brain that connects them.
Q4. Why Is Gross Margin Lying to You, and How Does AI BI Expose True Contribution Margin? [toc=4. True Contribution Margin]
Gross margin misleads because it only tells you what it costs to make a product, not to sell it. The eight costs between the supplier invoice and actual profit are where brands quietly bleed. AI BI exposes true contribution margin by computing per-SKU shipping, fees, returns, and discounts automatically, replacing blended averages. It also freezes margins at the time of sale, so a later cost change does not rewrite your history.
💰 The situation: a founder who trusted the wrong number
Picture Maya, a founder I will describe from a real scene. She slid an invoice across the table and said, "This is our best seller, 72% gross margin, we can't make them fast enough." Gross margin here just means revenue minus the cost to produce the item. She was proud of that number, and on paper it looked great.
⚠️ The complication: 72% became 8%
Then we opened her actual profit and loss statement. Twenty minutes later, she was in tears. Her real contribution margin, which is what is left after every cost to sell and ship the product, was 8%. The killer was blended shipping. She was looking at an average shipping cost across all products, not the true cost for that specific heavy SKU. As one operator says flatly, "gross margin is a lie," and "ROAS doesn't exist" as a standalone truth either. The full breakdown lives in our piece on contribution margin vs gross margin.
It gets worse for many brands. On r/ecommerce, operators describe losing trust in their own margins because their tools retroactively rewrite history when a product cost changes.
"Does anyone else not trust their own margin data after updating a product cost?" r/ecommerce Reddit Thread
📊 The resolution: line-by-line truth, locked in time
Good AI BI fixes both problems. It computes contribution margin per SKU in minutes, pulling in real freight, fees, returns, and discounts instead of a blended average. It also freezes that margin at the time of sale, so a supplier price bump next quarter does not corrupt last quarter's numbers. This matters more now that ad platforms are shifting, a theme we explore in declining platform ROAS vs true profitability. The Common Thread Collective DTC Index found Meta spend up 25% year over year in Q1 2026 with only 3% ROAS decay, which pushes the real decision back onto margin, not ROAS. Multi-channel brands tracking true contribution margin rose from 22% in 2024 to 51% in 2026.
This is exactly the work Luca does. It reasons across your P&L to surface per-SKU contribution margin and flags the hidden eight costs before they eat a quarter. When I say Luca answers "why did margin move?", the Maya scene is the reason that question matters. It is the same clarity our ecommerce profit margins guide is built around.
Q5. Can You Trust AI With Your Numbers? Hallucinations, Dirty Data, and Guardrails [toc=5. Accuracy & Trust]
You can trust AI with your numbers only when it reads clean, standardized data and you keep a human in the loop on high-stakes calls. In a 2026 audit of 24 tools, 13 hallucinated at least one SKU or margin number. The fix is unglamorous but decisive: standardize your lookups first, feed AI clean inputs, and never let it be the final QA (quality assurance) on mission-critical outputs.
⚠️ The pain: AI that confidently makes things up
Let me be honest about what breaks trust here. "Hallucination" just means the AI states a wrong number with total confidence. When 13 of 24 tools invent a SKU or margin figure, that is not a rounding error, that is a pattern. I have watched founders get burned by rubbish native AI that hallucinates and tells fibs. A confident wrong answer is worse than a blank screen, because you act on it. This is why trustworthy ecommerce data analytics starts with the data itself.
🔍 The root cause: garbage in, garbage out
Most of the time, the model is not the problem. The data feeding it is. Prompting an AI on horrendous, messy datasets is pure laziness, and it always shows. Solid ecommerce data management is the unglamorous fix.
Picture an AI describing a $20,000 Specialized bike with the rear derailleur mounted on the front wheel. Any cyclist spots it instantly, but the AI does not, because it never learned your context. That is the lesson. Do not let AI be your quality assurance. It is fast, not careful.
✅ The payoff: three guardrails that actually work
Here is the workflow I trust, in order.
Standardize your lookups first. Make sure "Meta," "Facebook," and "FB" all map to one thing before you ask a question.
Feed clean, connected data. Pull from one unified source, not five conflicting exports, through proper ecommerce data integration.
Keep human sign-off on mission-critical calls. Let AI draft the margin number. You approve it before it drives a reorder.
This is exactly where a unified warehouse layer earns its keep. Luca normalizes and standardizes your data on ingestion, so the reasoning runs on clean inputs instead of five conflicting spreadsheets. ✅ It connects your sources into one source of truth, ✅ then reasons on top of that clean layer. ❌ A bolted-on chatbot skips this step and hallucinates at the source. Cutting the dirty-data problem before reasoning starts is the single biggest lever on accuracy, and it shapes how Luca thinks.
My honest read right now: AI will keep getting better at the math, but the data hygiene step is not going away. The brands that win are the ones treating clean data as the real product. Where do you think the accuracy line lands 18 months from now?
Q6. When Analytics Isn't Enough: How Does Luca AI Compare on Growth Capital? [toc=6. Growth Capital Comparison]
For scaling brands that also need funding, Luca AI competes directly on the capital metrics that matter: cost of capital, time to disbursal, repayment flexibility, and how much equity you give up (none). Against revenue-based financing providers like Wayflyer and 8fig, the questions to ask are identical, effective rate, speed to cash, and fee transparency, so compare Luca on those terms.
💰 The problem: capital is slow, pricey, or costs you equity
Inventory and cash have to move on the same set of tracks. If one gets ahead of the other, you go off the rails. That is why the terms on your working capital matter as much as the amount.
Revenue-based financing (RBF) means you take cash now and repay it as a slice of daily sales. It is faster than a bank, but the effective cost can climb hard if you repay quickly. Our guide to revenue-based financing breaks down the mechanics.
📊 The metrics: compare on rate, speed, and terms
Here is the honest cost picture from 2026 provider data. Read the effective APR (annual percentage rate), not the flat fee, because a low flat fee on fast repayment annualizes high.
Growth Capital Provider Comparison (2026)
Provider
Effective cost
Disbursal time
Repayment model
Equity taken
Wayflyer
2 to 8% flat fee, 25 to 70% effective APR
Same-day to 24 hours
% of daily revenue
None
8fig
6 to 10% per $100K, up to 40%+ APR
Days, plan-based
Flexible, plan-adjusted
None
Clearco
12% flat fee, 14 to 40%+ APR
24 to 48 hours
% of daily revenue
None
⚠️ The fit: when embedded capital beats a term loan
RBF shines when you need inventory cash fast and your sales are steady. It hurts when margins are thin, because the daily sweep does not care about your contribution margin that week. A bank line is cheaper at 8 to 10%, but slow and paperwork-heavy. Matching capital to your ecommerce inventory management cycle is the real test.
Luca's angle on capital is embedded and non-dilutive, meaning funding sits inside the same workflow with no equity given up. Judge it the way you would judge any of the three above: effective rate, speed to cash, and how transparent the fees are. If a provider will not show you the effective APR plainly, that itself is your answer. What is the highest effective rate you would accept to keep an in-demand SKU in stock?
Q7. Which AI BI Tool Is Right for Your E-commerce Business? [toc=7. Which Tool Is Right]
Choose by your biggest constraint and your revenue stage. Sub-$1M stores can start on free or roughly $150/mo tiers. $5 to 25M multi-channel brands spend a median near $13,800/year, scaling to $1,500 to 5,000/mo past $10M. If you need attribution, pick Triple Whale or Polar. If you need marketplace margin, Fairview or Sellerboard. If you want an AI layer that reasons across your whole warehouse, Luca AI.
🧭 Match the tool to your stage and your main job
The mistake I see most is buying for the store you wish you had, not the one you run. Start from your single biggest constraint this quarter, then match spend to stage. Our roundup of ecommerce analytics platforms can help you shortlist.
Which AI BI Tool Fits Your Stage
If you are...
Top job
Budget
Recommended tool
Under $1M, solo
See your numbers in one place
Free to ~$150/mo
Polar Analytics
$1 to 10M, paid-media led
Ad attribution
~$129 to 500/mo
Triple Whale
$1 to 10M, marketplace
True margin after fees
~$19 to 79/mo
Sellerboard
$5 to 25M, multi-channel
Reason across marketing, finance, inventory
Median ~$13.8K/yr
Luca AI
$10M+, many channels
Margin auditing across channels
~$200 to 1,000/mo
Fairview
One fair warning on pricing. Operators resent bills that scale with GMV (gross merchandise value, your total sales), because your cost climbs even when the tool does not do more. One buyer paid over $600 a month and still could not get support. Ask how a tool prices before you scale into it. If you want a sense of the range, our overview of the best AI tools for Shopify owners lays it out.
⏰ Make the choice actually stick
Buying the tool is 20% of the work. Adoption is the rest. Onboard AI like a brilliant PhD hire on day one, smart, but clueless about your business until you teach it. Start with one workflow, like a weekly CAC report, and expand once it earns trust. Aim to get AI doing about 92% of the grunt work, so the 8% left is the judgment only you can bring. This is the promise of agentic AI for ecommerce founders.
I built Luca for the operator who is tired of being the human middleware between five dashboards. If that is you, running a scaling DTC or multi-channel brand, it is worth a look as your reasoning layer. Rather than "book a demo," I would just ask: tell me what you are trying to figure out this week, and we can talk about whether Luca actually helps.
FAQ's
What are the best AI-powered BI tools for e-commerce in 2026?
We ranked ten standouts after testing each against real e-commerce questions, not vendor decks.
Luca AI for AI reasoning across your whole data warehouse.
Triple Whale for Shopify-first ad attribution.
Polar Analytics for fast no-code dashboards.
Glew.io for omnichannel multi-store reporting.
Peel Insights for retention and cohort analytics.
Daasity and Improvado for warehouse modeling and marketing aggregation.
Domo for enterprise BI, plus Sellerboard and Fairview for marketplace and margin work.
The pattern we keep seeing is that each tool nails one slice, while you still triangulate across them by hand. That is the gap we built around. Instead of another dashboard, we reason across marketing, finance, and inventory in one place, then flag outliers before you go looking. If you want the fuller landscape, our guide to ecommerce analytics platforms compares the trade-offs by store stage and job to be done.
How is an AI BI tool different from a traditional analytics dashboard?
A traditional dashboard shows what happened. An AI BI tool reasons about why it happened and what to do next.
Most legacy tools park your data in charts and leave the synthesis to you. We think that is backwards, because the decision, not the chart, is the point.
Extract: pull the exact data a question needs, in plain English, with no SQL.
Predict and simulate: forecast from history and model what-if scenarios.
Root-cause: trace an outlier to the metrics that actually drove it.
Act: scan your data 24/7 and ping you when ROAS dips or inventory falls below threshold.
One founder calculated net profit for a new delivery market in five minutes, work that used to take a two-day wait on an expert. That shift from descriptive to prescriptive is the whole difference. You can see the mechanics in our overview of ecommerce business intelligence, and how we treat reasoning as a first-class job, not a bolted-on chatbot.
Why does gross margin mislead, and how do AI BI tools show true contribution margin?
Gross margin only tells you what it costs to make a product, not to sell it. The costs between the supplier invoice and real profit are where brands quietly bleed.
We once watched a founder proud of a 72% gross margin discover her real contribution margin was 8%, mostly because blended shipping hid the true cost of one heavy SKU.
Per-SKU truth: compute real shipping, fees, returns, and discounts instead of blended averages.
Frozen at time of sale: lock the margin so a later cost change does not rewrite history.
Reason across the P&L: surface the hidden costs before they eat a quarter.
Multi-channel brands tracking true contribution margin jumped from 22% in 2024 to 51% in 2026, and that discipline is now the difference between growth and quiet losses. Our deep dive on contribution margin vs gross margin walks through the eight costs line by line so you can spot the leak in your own numbers.
Can you trust AI with your e-commerce numbers without hallucinations?
You can, but only when the AI reads clean, standardized data and a human signs off on high-stakes calls.
In a 2026 audit of 24 tools, 13 hallucinated at least one SKU or margin figure. A confident wrong number is worse than no number, because you act on it.
Standardize lookups first: map "Meta," "Facebook," and "FB" to one thing before asking anything.
Feed clean, connected data: pull from one unified source, not five conflicting exports.
Keep human sign-off: let AI draft the number, but you approve it before it drives a reorder.
Most of the time the model is not the problem, the messy data is. We normalize and standardize your sources on ingestion, so reasoning runs on a clean layer instead of contradictory spreadsheets. That single step is the biggest lever on accuracy. Our guide to ecommerce data integration shows how a unified layer cuts the dirty-data problem at the source, before any answer is generated.
Which AI BI tool is right for my e-commerce business stage?
Choose by your biggest constraint and your revenue stage, not by the store you wish you had.
Under $1M, solo: free or roughly $150/mo dashboards like Polar Analytics.
$1 to 10M, paid-media led: attribution tools such as Triple Whale.
$1 to 10M, marketplace: profit trackers like Sellerboard.
$5 to 25M, multi-channel: an AI reasoning layer across your warehouse.
$10M+, many channels: margin auditors like Fairview.
One fair warning: watch tools that bill on GMV, because your cost climbs even when the tool does not do more. We built Luca for the operator tired of being the human middleware between five dashboards, and we would rather you test it against your own real question than book a generic demo. If Shopify is your core, our roundup of the best AI tools for Shopify owners maps spend and jobs by stage so you can shortlist fast.
Enjoyed the read? Join our team for a quick 15-minute chat — no pitch, just a real conversation on how we’re rethinking Ecommerce with AI - Luca
Loading Schedule...
Your AI Co-Founder is here.
Here’s why:
Shopify, Meta, Xero - one brain.
"Should I scale?" Answered with real data.
Growth capital. No applications. One click.
Thank you! Your submission has been received! Please book a time slot for the Meeting
Oops! Something went wrong while submitting the form.