.svg)
.svg)

Q1. What is customer profitability analysis, and why does gross margin lie? [toc=What It Is & Why Margin Lies]
Last quarter, a founder doing about $400K a month slid her hero-product invoice across the table. Gross margin, 72%. She was proud of it. Then we added the eight costs that sit between her supplier invoice and her bank balance, and her face changed.
Customer profitability analysis measures the real profit one customer, segment, or category generates after every cost to acquire and serve them is subtracted from their revenue: Revenue minus COGS minus CAC minus Cost-to-Serve equals contribution profit. It is not gross margin. Gross margin only tells you what it costs to make a thing, never what it costs to acquire the buyer, ship it, support it, and absorb returns, which is exactly where stores quietly bleed.
📉 Why gross margin is the metric that lies to you
Gross margin answers one narrow question. What did the product cost to make? That is it.
It says nothing about the cost to sell the thing. As one operator put it bluntly, "the eight costs between the supplier invoice and actual profit, those are where businesses bleed." It says nothing about the cost to acquire the buyer, either. CAC (customer acquisition cost, what you pay in ads and offers to win one buyer) is real money. So are returns, support labor, shipping, and payment fees.
Treat those as someone else's problem, and your "healthy" margin becomes fiction. You feel busy. You feel like you are scaling. You are quietly going broke. This is the gap we built a better way to track unit economics to close.
💸 The eight costs hiding between the invoice and the bank
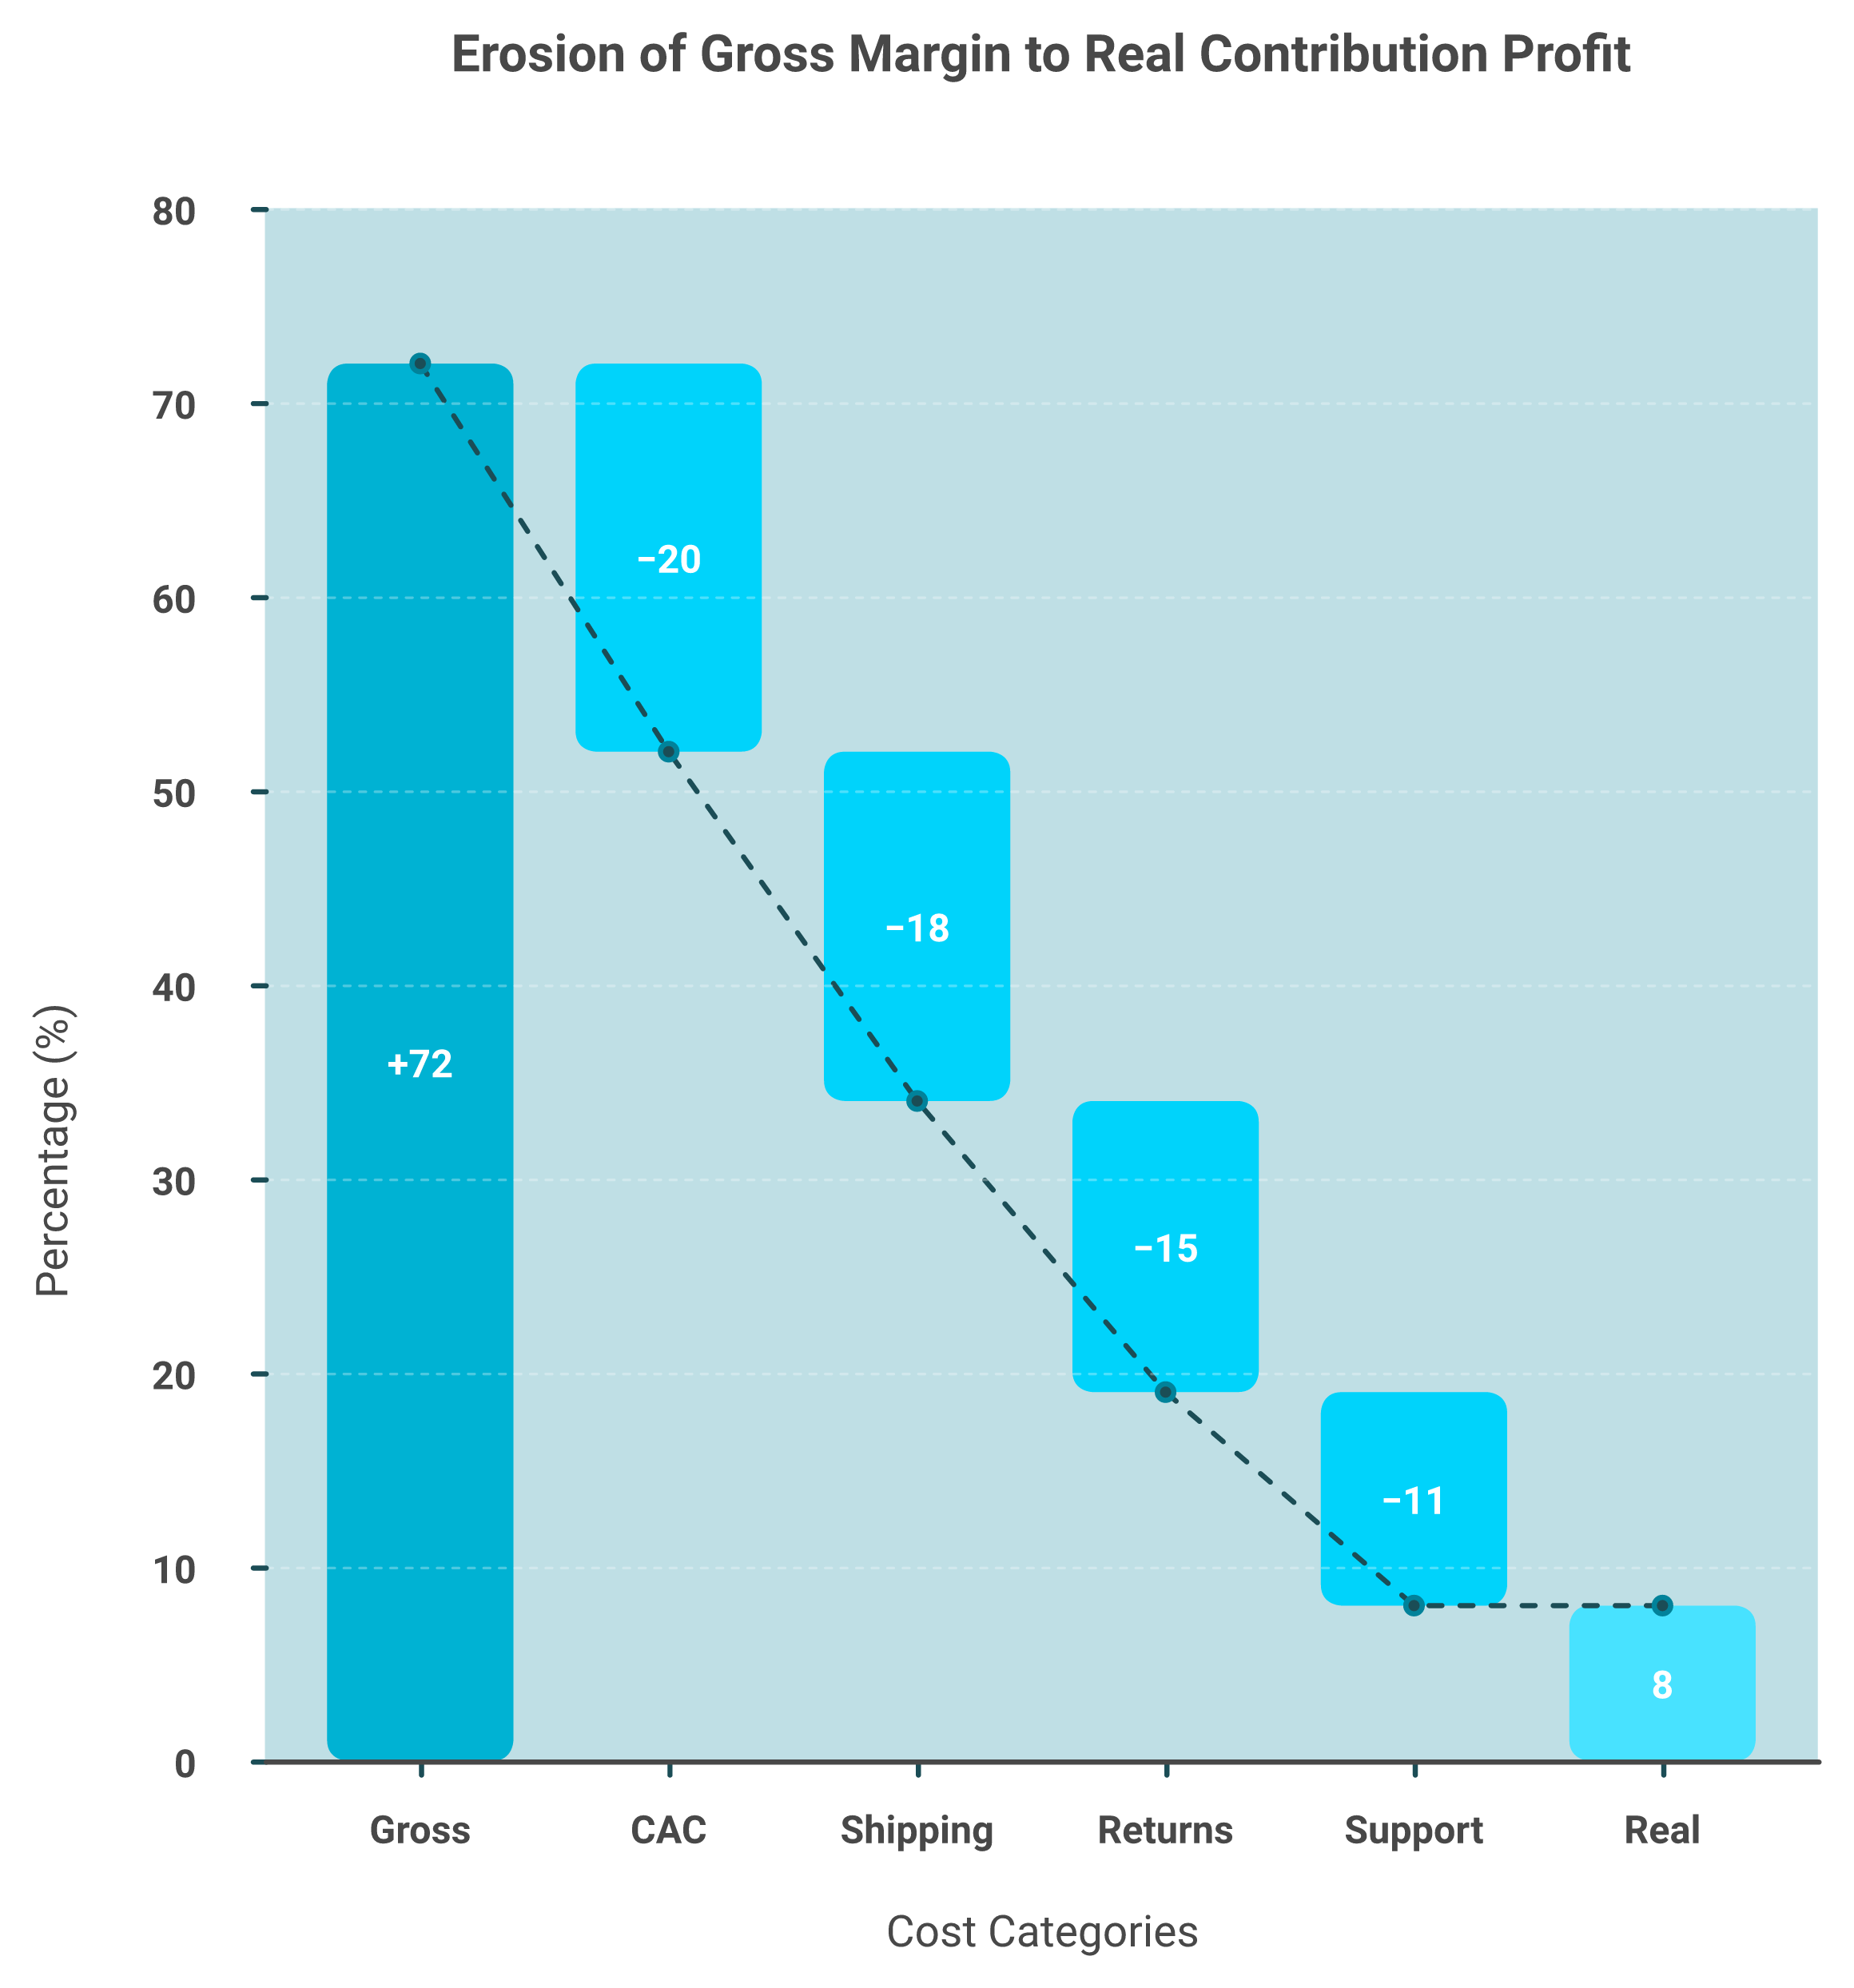
Here is the gap in plain numbers. A product with a 72% gross margin sounds bulletproof.
Now layer in reality, line by line:
- 💰 CAC: the ad spend and discount it took to acquire that buyer.
- 💸 Shipping and fulfillment: the box, the label, the pick-and-pack.
- ⚠️ Returns: refunds, restocking, and the units you cannot resell.
- ⏰ Support labor: the time your team spends answering tickets for that SKU.
Strip all of that out, and a 72% gross margin can collapse into single-digit contribution profit. That collapse is the whole point of customer profitability analysis. You are measuring survival math, not running an accounting chore.
The reader I respect most here is at intermediate maturity, has real revenue, and is "terrified that scaling is actually incinerating their cash." My read, after looking at thousands of Shopify P&Ls through our financial management workflows, is simple. The founders who track contribution profit per customer make calmer decisions. The ones who track gross margin alone get surprised, usually at the worst possible moment.
Q2. The Maya Moment: how did a 72% margin product turn out to be 8%? [toc=The Maya Moment]
I watched a founder cry over a spreadsheet once. Not from stress, from recognition. She had just seen, for the first time, what her best-selling product actually earned her.
A founder we'll call Maya showed an invoice proving her hero product carried a 72% gross margin. Twenty minutes later, after we rebuilt contribution margin line by line, including CAC as a variable cost, real margin was 8%. She had spent two years scaling a product that barely broke even. That gap, gross margin minus everything it actually costs to sell, is the Maya Moment, and most founders are living inside it without knowing.
🧾 The invoice that looked like a win
Maya's situation will feel familiar. Strong revenue, a clear bestseller, and an invoice that confirmed a 72% gross margin. Every instinct said, pour more spend into this product.
That is the trap. The invoice was honest about production cost and silent about everything else. She was reading one true number and drawing one false conclusion from it.
⚠️ The twenty minutes that changed her plan
We rebuilt the math together. We started subtracting the costs the invoice ignored, one at a time.
Acquisition cost came first. As the operator who ran this teardown explained, "if you have to spend money to acquire a customer to sell that unit, it's a variable cost, you cannot make good decisions if you're not including it." Then support. Then returns. Then shipping.
The 72% kept falling. It did not stop until it hit 8%. "Eight," she repeated, "she'd spent two years scaling a product that was barely breaking even."
✅ The lesson hiding inside the tears
Here is the payoff, and it is not gentle. You cannot make good decisions on a number that excludes the cost of getting and keeping the customer.
Maya had not failed at product. She had failed at measurement. Two years of effort had gone into a product that funded almost nothing, while she assumed it funded everything.
I could be wrong on the exact frequency, but from what surfaces when you actually run this with operators, most have at least one Maya product in their catalog right now. The only question is whether they have done the twenty minutes of math to find it, which is exactly the kind of check founders drowning in data keep postponing.
Q3. How do you calculate customer profitability step by step? [toc=Step-by-Step Calculation]
A founder asked me last week how long this takes. My honest answer, the first time, a slow afternoon. After that, minutes. The method is not hard, it is just rarely done with discipline.
Calculate customer profitability in five steps: (1) pull total revenue per customer, (2) subtract product COGS, (3) subtract acquisition cost, since CAC is a variable cost, (4) allocate true cost-to-serve, support, returns, shipping, payment fees, and (5) the remainder is real contribution profit. Run it per customer where your data allows and per segment where it doesn't. Use the median, not the mean, for time between purchases so outliers don't distort the picture.
🧮 The five steps, with the output you should expect
Work them in order. Each step produces a number you carry into the next.
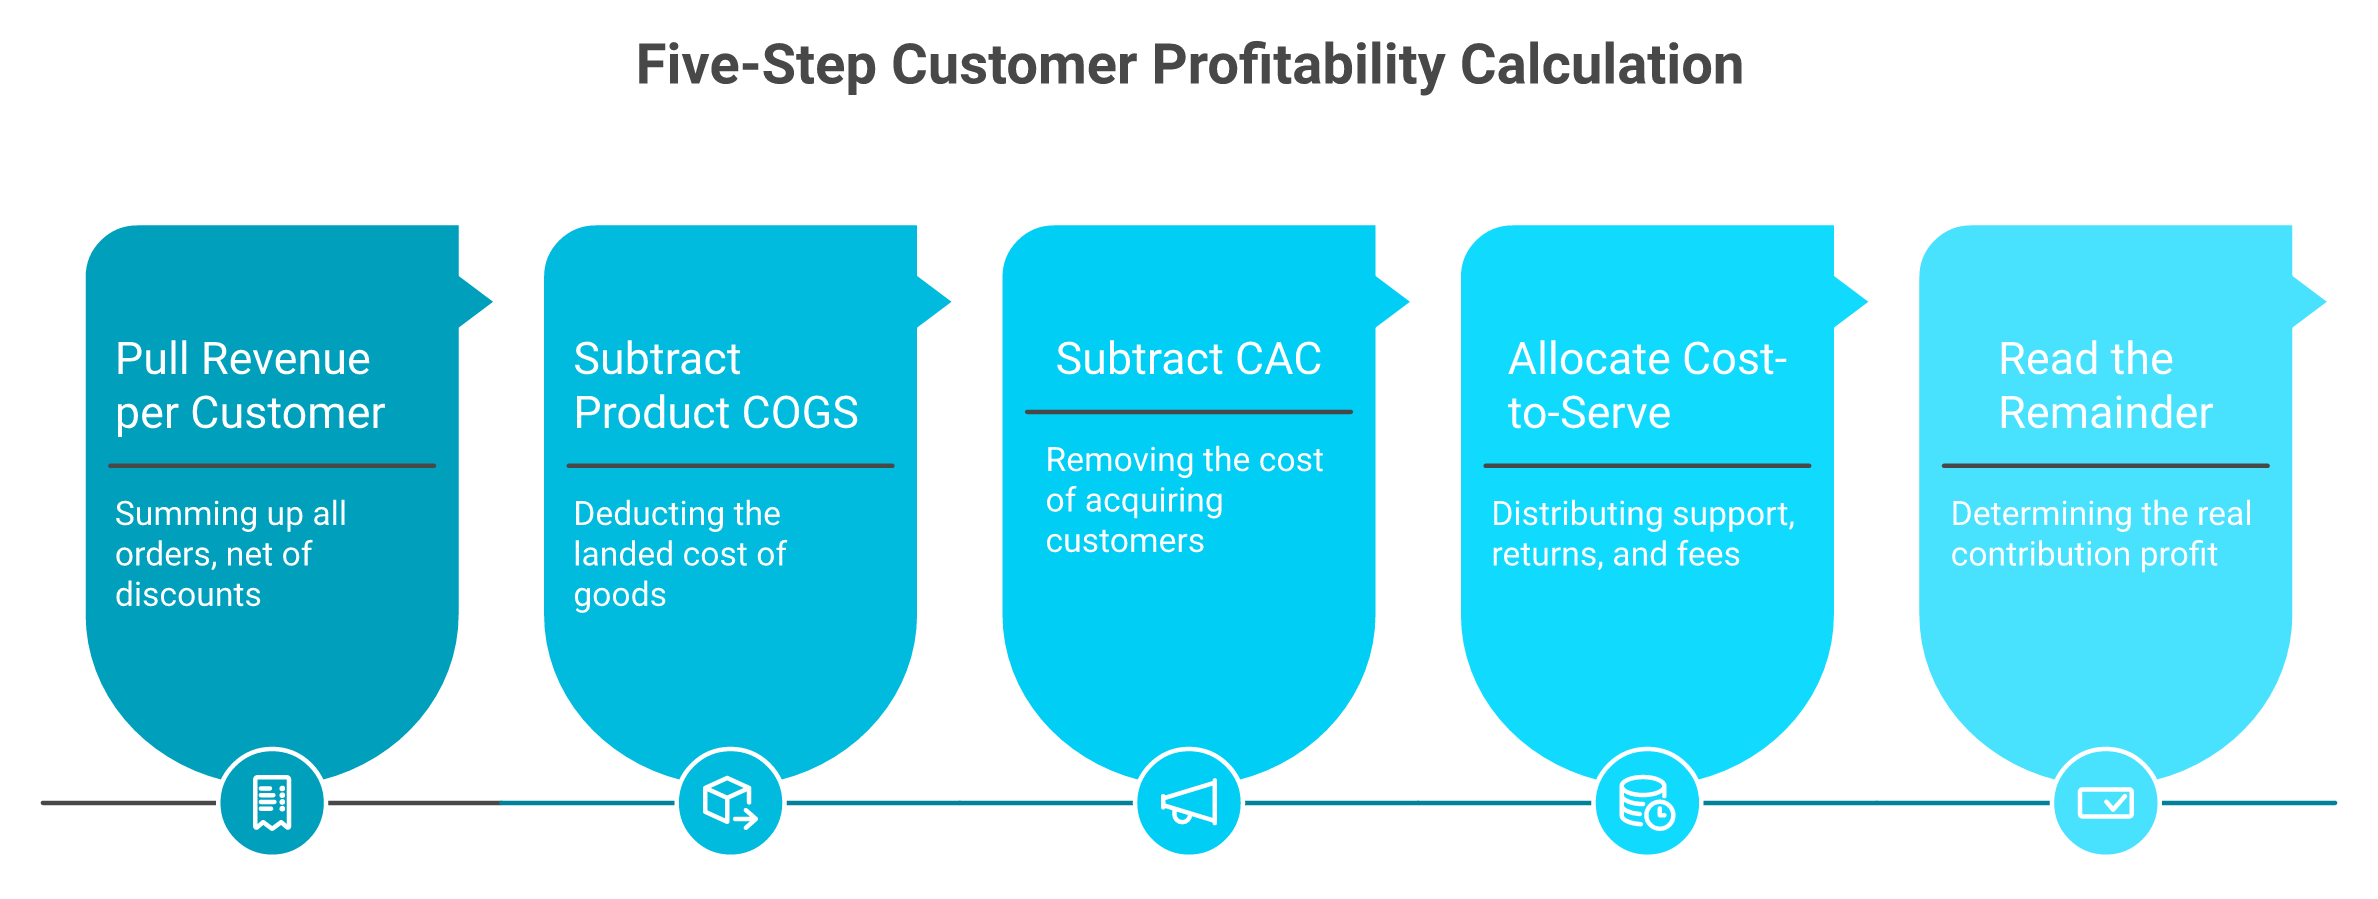
- 💰 Pull total revenue per customer. Sum every order, net of discounts. Output: gross revenue per customer.
- 📦 Subtract product COGS. The landed cost of goods sold. Output: gross profit.
- 💸 Subtract CAC. Ad spend plus acquisition offers, divided by customers won. Output: profit after acquisition.
- ⏰ Allocate cost-to-serve. Support labor, returns, shipping, and payment fees tied to that customer. Output: profit after service.
- ✅ Read the remainder. Whatever is left is real contribution profit, the only number that tells the truth.
📊 A worked example you can copy
Numbers make this concrete. Take one customer over a year.
- Revenue: $600
- COGS: minus $240 (leaves $360)
- CAC: minus $90 (leaves $270)
- Cost-to-serve, shipping plus returns plus support: minus $160 (leaves $110)
That customer's real contribution profit is $110, not the $360 their gross profit implied. If you were tiering customers on gross profit alone, you would badly overrate this one. A clearer view of sales performance starts here.
⚠️ Use the median, not the mean
One precision point that generalist finance blogs skip. When you measure time between purchases, "it's helpful to use the median rather than the mean." A handful of hyper-frequent buyers will drag your average up and hide the typical customer's real behavior.
This is also where the method runs into a wall. The same five steps that take a finance team days, joining Shopify orders, Meta spend, and your returns system by hand, are exactly what an AI layer over your store data can compute continuously. We built Luca to run this loop without the slow afternoon, a point I will earn properly when we get to why dashboards fail, and one we expand on in our data analysis approach.
Q4. How do you allocate cost-to-serve, direct vs. indirect, down to the SKU? [toc=Allocating Cost-to-Serve]
The standard read gets cost-to-serve backwards. Most founders bucket customer service as "overhead," a fixed cost of doing business. That single habit hides your worst products in plain sight.
Direct costs (COGS, shipping, payment fees, returns) attach cleanly to an order; indirect costs (support labor, warehousing, software) must be allocated using a driver. Stop treating customer service as fixed overhead, tag every ticket by product in your helpdesk, then subtract that labor from the offending SKU. In one store, 42% of all tickets traced to a single knife set, about $13,000 a year in hidden service cost that gross margin completely ignored.
🔍 Direct vs. indirect, defined simply
The split is the whole game. Get it right, and loss-making SKUs stop hiding.
- ✅ Direct costs attach cleanly to one order: COGS, shipping, payment processing fees, and returns.
- ⚠️ Indirect costs do not attach to one order: support labor, warehousing, and software. You allocate these using a driver, a measurable signal of who consumed the cost.
A driver is just the fair-share rule. For support, the obvious driver is ticket volume by product. Tag the ticket, attach the labor, assign the cost. Product-level management gets sharper the moment you do this.
🔪 The 42% ticket trap
Here is what surfaces when you actually tag tickets by SKU. In one store, "42% of all customer service tickets were related to this one product, about $13,000 a year in customer service costs."
That knife set looked fine on gross margin. It was quietly burning $13,000 of labor a year that no P&L line ever assigned to it. Allocate that cost back to the SKU, and its real profitability changes completely.
Inventory commitments hide the same way. As one apparel operator noted, "one style of denim, that's a $6,000 commitment, you have to stock sizes 23 to 32 in both stores." Capital sitting in slow sizes is a cost-to-serve too.
⏰ The workflow you can set up this week
You do not need a data team to start. You need a tagging habit.
- Tag every support ticket by product in your helpdesk (Gorgias, Zendesk, or similar).
- Multiply tickets per SKU by your blended cost per ticket to get support labor by SKU.
- Subtract that labor from each SKU's contribution profit.
One honest caution before you start. This only works if your data is clean enough to join tickets to products, and many stores are not there yet. That join, tickets to SKU, returns to SKU, ad spend to customer, is exactly the cross-functional connection siloed tools fail to make, because the data lives in separate systems that never talk. We designed Luca to normalize and join that data on ingestion, so the allocation runs automatically instead of becoming a quarterly spreadsheet chore, a theme we cover across our full set of use cases.
Q5. How do you score customers into A/B/C tiers, and what do you do with each? [toc=A/B/C Segmentation & Actions]
Here is a habit that quietly drains margin. Most stores treat every customer the same, same discounts, same support priority, same win-back spend. Unequal customers, equal treatment. That is the leak.
Score every customer on two axes, profit contribution and relationship risk, then plot them on a 2x2 matrix: high-profit/low-risk (protect and grow), high-profit/high-risk (stabilize), low-profit/low-risk (reprice or upsell), and low-profit/high-risk (offboard). The payoff is concrete, you stop spending equal service and discount dollars on customers who return single-digit margin and redirect resources to the A-tier that actually funds the business.
🎯 Why two axes beat a simple A/B/C list
Most guides stop at ranking customers by spend. That misses half the picture. A high-spending customer who returns half their orders and floods your inbox is not an A-tier account.
So add a second axis. Relationship risk captures return rate, support load, and discount dependence. Profit contribution captures real money kept, after CAC and cost-to-serve. Together, they place each customer on a grid, not just a list. A clearer view of sales performance starts with that grid.
📊 The profitability-vs-risk matrix
Here is how the four quadrants map to action:
A founder doing real volume does not need this perfect. They need it directionally honest. Even a rough placement tells you where your discount budget is being wasted.
💸 The payoff: sharper retention, pricing, and resource calls
This is the "so what." Once customers sit in quadrants, your decisions get specific. You stop sending 20%-off win-backs to the low-profit, high-risk group that should be leaving.
You redirect that budget to the A-tier, the customers who actually fund payroll. You reprice the cheap-to-serve group instead of discounting them further. My read, after watching stores run this, is that the offboarding quadrant is the hardest emotionally and the most freeing financially.
The catch is upkeep. Tiers shift every month as behavior changes, and re-scoring 5,000 customers by hand is a quarterly chore nobody finishes. We built Luca's financial management workflows to re-score these tiers continuously against your live data and ping you in Slack or email when a customer crosses a threshold, so the matrix stays current without the spreadsheet marathon.
Q6. Customer vs. product vs. category profitability: which view actually drives LTV? [toc=Customer vs Product vs Category]
Everyone optimizes purchase frequency. Buy again, buy sooner, buy more often. What if that is the wrong lever for lifetime value?
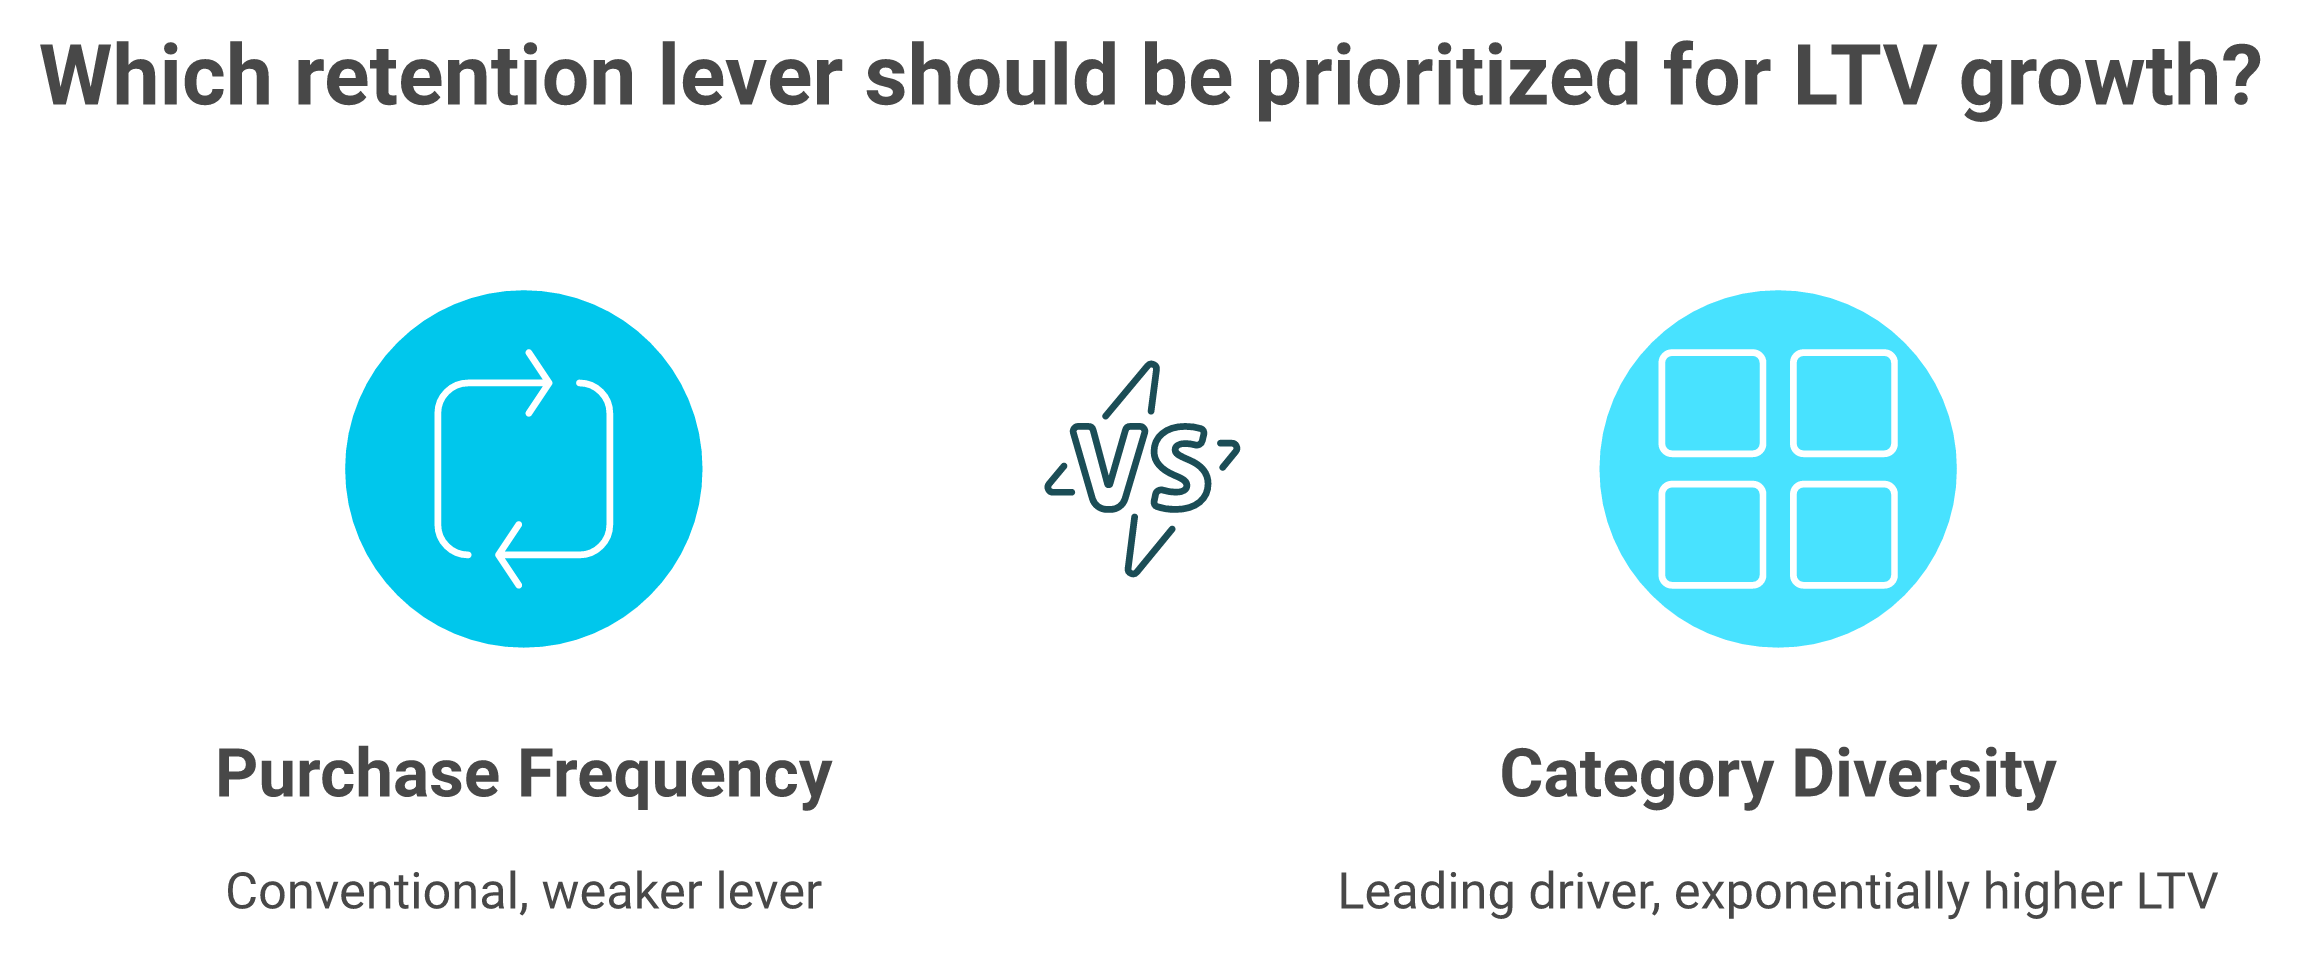
Track profitability at three altitudes, per customer, per product, and per category, because each answers a different question. The surprise: lifetime value is driven less by how often someone buys and more by how many categories they buy from. Customers purchasing across three-to-four-plus categories show exponentially higher LTV, so category-level analysis, not frequency optimization, is where durable retention strategy actually gets built.
🔭 Three altitudes, three different questions
Each view answers something the others cannot. Use them together, not interchangeably.
- 💰 Per customer: who funds the business, and who drains it?
- 📦 Per product: which SKUs carry real contribution margin after returns and support?
- 🗂️ Per category: how does buying across categories change a customer's long-term value?
Stay stuck at one altitude and you get tunnel vision. As one operator put it, focusing on a single metric is "like looking at a Van Gogh through a magnifying glass fixed on one square inch." You miss how the colors interact. A wider lens on product management keeps that from happening.
🔄 The twist: diversity beats frequency
Here is the finding that surprised even the operator who ran it. "I would have never thought product category diversity was the leading driver of lifetime value," he said. "Anyone buying from three-to-four-plus categories has exponentially higher LTV."
The proof was hands-on. Anthony Mink gave Claude terminal access to his Shopify APIs and ran five cohort analyses. He found that moving a customer into body care alone lifted their LTV by 50% to 100%.
That one signal changed his whole plan. He rebuilt his post-purchase marketing around category cross-sell, not "buy again" nudges. It is the kind of pattern marketing analysis and automation is meant to surface.
✅ What this means for your Monday
Stop optimizing only for the next order. Start optimizing for the next category.
Look at your best customers and ask one question. How many categories do they buy from? If the answer is three-plus, your retention play is cross-category introduction, not frequency spam.
I could be off on the exact lift for your store. The direction, though, holds across most catalogs I have seen. Running a Mink-style cross-category cohort by hand means building five reports and reconciling them; we designed our data analysis and research engine to run that analysis on demand, cohort-level vigilance without the cohort-level dashboard.
Q7. CPA vs. CLV vs. contribution margin: what's the difference and when do you use each? [toc=CPA vs CLV vs Contribution Margin]
Operators get told to "maximize LTV" and "protect margin" in the same breath, as if they were the same dial. They are not. Mixing these three metrics is how you end up funding the wrong customers.
These three measure different things. Customer profitability analysis measures realized profit a customer has already generated. Customer lifetime value projects the future profit you expect over the relationship. Contribution margin measures per-unit profit after variable costs on a single sale. Use CPA to judge the past, CLV to forecast and budget acquisition, and contribution margin to price and decide which SKUs to push, confusing them leads to funding the wrong customers.
🧭 The three metrics, side by side
Here is the clean separation. Read it once and the confusion usually clears.
CM is the building block. It is what is left from one sale after variable costs like COGS, shipping, and CAC. CPA stacks those margins across a customer's real history. CLV forecasts where that history is heading. Tracking these cleanly is the heart of solid e-commerce unit economics.
⚠️ The mistake that costs you money
The common error is using CLV to justify present spending while ignoring CPA. A high projected CLV does not pay this month's ad invoice.
If your realized CPA on a cohort is negative, a rosy CLV forecast is a story, not a fact. My rule of thumb: let contribution margin govern pricing, CPA govern who you keep, and CLV govern acquisition budgets. Tools that report these as one blended number only help if they keep the three distinct rather than averaging them into mush, which is why true profitability matters more than a single headline figure.
Q8. Why do most analytics dashboards fail at profitability tracking? [toc=Why Dashboards Fail]
I have sat with founders staring at three browser tabs, Shopify in one, Meta in another, a dashboard in the third, trying to reconcile numbers that refuse to agree. The dashboard was supposed to end that. It did not.
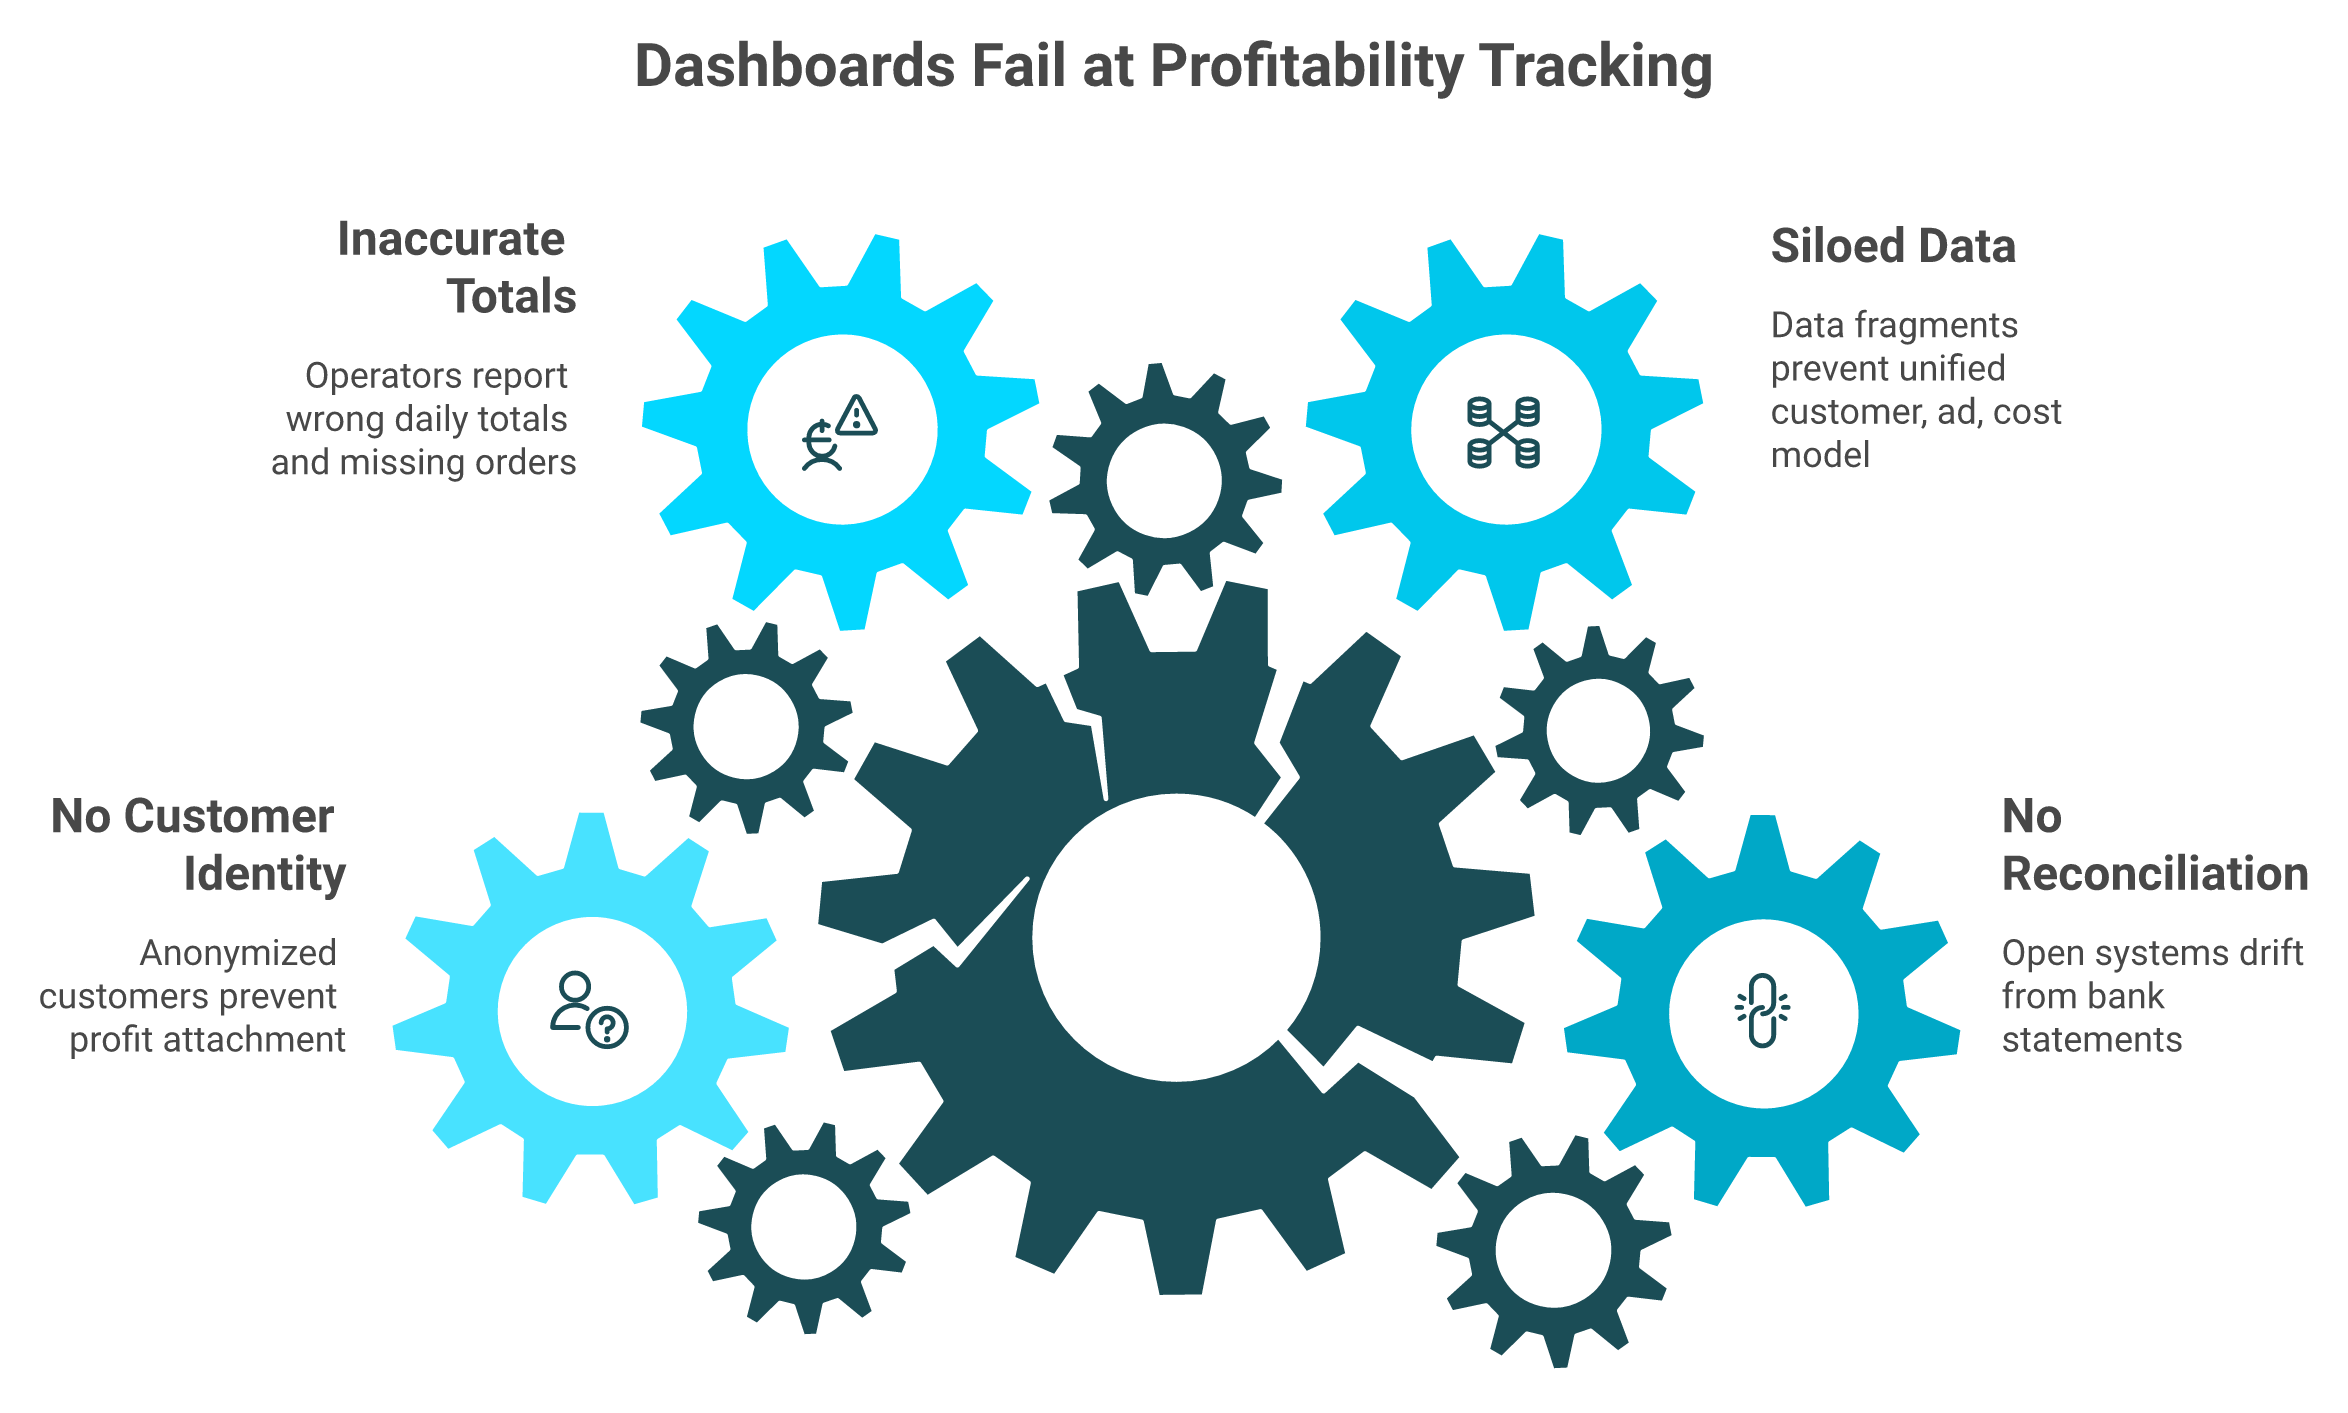
Most dashboards fail for two structural reasons. They run as "open systems" that never reconcile to your bank and card statements, producing large discrepancies versus your actual books, and they silo data so customer, ad, and cost numbers never join. Operators report Triple Whale showing wrong daily totals and missing order blocks; Google Analytics cannot even attach a customer name. Better monitoring was never the goal, prescriptive action is.
🔌 The open-system problem
Here is the structural flaw. Most analytics tools are "open systems," meaning they pull data in but never reconcile back to your bank and card statements. So the numbers drift from your actual books.
The drift is not small. Retailers have lost over $1 trillion to revenue distortion driven by inaccurate inventory data. A dashboard that does not tie back to cash is a confident guess, not a source of truth. This is why we treat financial management as a reconciliation problem first.
⚠️ What operators actually report
This is not theoretical. Verified buyers describe the same failures repeatedly.
"Since day one, the data has been inaccurate. Daily revenue totals are wrong, entire order blocks are missing... Triple Whale shows orders from external marketplaces as if they were real conversions... Completely fake data."
XTRA FUEL Triple Whale Trustpilot Verified Review
"The integrations are inconsistent, building with the AI tool Moby is very buggy and crashes more than half the time... we end up reverting back to direct data sources like Meta, Shopify, Recharge."
Matt Huttner Triple Whale Trustpilot Verified Review
The free option does not solve it either. Google Analytics strips out exactly what you need for profitability work, customer-level identity.
"It is becoming very opaque... there is data loss... To make decisions based on grounded data, it is really difficult to trust it 100%."
Verified User in Retail Google Analytics G2 Verified Review
✅ What a reasoning layer must do instead
Better dashboards were never the goal. Prescriptive action is. ✅ A real profitability system reconciles to your bank and card data, so the numbers match your books. ✅ It joins customer, ad, and cost data into one model instead of leaving you to triangulate across tabs. ❌ Passive dashboards stop at displaying last week's numbers and leave the synthesis to you. ✅ A reasoning layer goes further: it predicts, simulates, finds the root cause, and surfaces the influencing components behind an outlier.
This is the gap we built Luca to close. Luca is an AI layer over your data warehouse that reconciles and joins your sources, then pushes custom reports with reasoning to Slack or email, so the analysis comes to you instead of waiting in a tab you forgot to open. If you are comparing options, our roundup of the best Shopify analytics apps and a closer look at Triple Whale alternatives both walk through what reconciliation-first analytics looks like in practice.
Q9. What should you look for in a profitability intelligence tool? [toc=Choosing the Right Tool]
Founders ask me for "the best dashboard" all the time. I think that is the wrong question. The standard read gets this backwards, you do not need a prettier chart, you need a layer that reasons.
Judge a profitability tool on four analytics criteria: does it reconcile to your bank and card statements, does it join customer, ad, and cost data into one model, can it predict, simulate, and root-cause rather than just report, and can it push the answer to you automatically? Tools that only visualize last week's numbers fail the test; you need a reasoning layer, not another dashboard.
✅ The four-criteria rubric
Before you compare logos, score every tool on these four. They separate a reasoning layer from a rear-view mirror.
- 💰 Reconciliation: does it tie back to your bank and card statements, or just to platform exports?
- 🔗 Data join: does it unify customer, ad, and cost data, or leave you triangulating across tabs?
- 🧠 Reasoning: can it predict, simulate, and find the root cause, or only display what already happened?
- ⏰ Push: does it surface answers proactively, or wait for you to log in and ask?
Scoring tools this way is the same discipline behind picking the right e-commerce analytics platform instead of the loudest one.
🛠️ The tools, ranked against the rubric
Here is how the field scores, in my read.
1.1 Luca AI. Luca is an AI layer over your data warehouse, not a dashboard with AI bolted on. ✅ It reconciles and joins customer, ad, and cost data into one model. ✅ It predicts, simulates, and root-causes, then pushes custom reports with reasoning to Slack or email. Most analytics tools added AI; Luca is AI. The honest trade-off: if you are sub-$10K MRR or marketplace-only, you may not need this depth yet. You can see the wider picture across our full set of use cases.
1.2 Triple Whale. Strong on marketing attribution and a familiar interface. ❌ But operators report reconciliation gaps and integration breakage that undercut profitability trust.
"Since day one, the data has been inaccurate. Daily revenue totals are wrong, entire order blocks are missing."
XTRA FUEL Triple Whale Trustpilot Verified Review
If that pattern worries you, our breakdown of Triple Whale alternatives is worth a read.
1.3 Polar Analytics. Flexible cross-channel reporting and custom metrics. ❌ It is still a reporting layer, so the synthesis and action stay on your plate.
1.4 Google Analytics. Free and ubiquitous. ❌ But it anonymizes customer identity, which makes customer-level profitability nearly impossible.
"It is becoming very opaque... there is data loss... it is really difficult to trust it 100%."
Verified User in Retail Google Analytics G2 Verified Review
For the workaround most stores try first, see our guide to Google Analytics for e-commerce.
🔮 What I am watching next
My honest hypothesis: within 18 months, "dashboard" becomes a feature, not a category. The tools that survive will reason and act, not just render charts.
I could be early on this. But from what surfaces when you actually run profitability work, the founders who win are the ones who stopped collecting dashboards. What would change for your store if the analysis came to you, already reasoned, every Monday? That is the question behind agentic AI for e-commerce founders.
Q10. When you need capital to act, how should you choose a funding partner? [toc=Choosing a Capital Partner]
A founder hits a timing mismatch. Inventory is due, a Stripe payout is held, Q4 stock needs ordering now. That is when revenue-based financing (capital you repay as a share of future sales) looks like a lifeline. The pitch is friendly. The fine print, often, is not.
Choose a capital partner on hard capital metrics: the effective interest rate (not a disguised flat fee that pushes the real APR toward 100%), disbursal time, repayment flexibility, and whether the lender honors written terms. Operators report bait-and-switch cuts, funding reversed at the last minute, and APRs near 100%, so reliability is itself a capital metric. Cheap-looking capital that arrives late or gets clawed back is the most expensive kind.
⚠️ The horror stories operators actually report
These are not edge cases. They are repeated, named complaints from verified buyers.
Funding gets cut after you have already planned around it:
"We signed a 3M loan deal, only for them to come back two weeks later... slashing our funding to 1M. Then, months later... they cut it again to 350K... last-minute bait-and-switch."
Xin Shui Uncapped Trustpilot Verified Review
Approved deals get reversed at the worst moment:
"After being offered funding in writing with specific amounts, repayment terms, and confirmation that the deal was approved, Wayflyer abruptly reversed their decision at the last minute."
Geoff Brand Wayflyer Trustpilot Verified Review
For brands weighing that provider, our roundup of Wayflyer alternatives lays out the options. And the real cost is often buried in the structure:
"Pretty expensive product at 35-40 APR... 6% for 4 months... That puts you to 36% APR in the best case."
Julian Fernau Clearco Trustpilot Verified Review
Similar trade-offs show up in our look at Clearco alternatives.
💰 The capital-metric rubric
Reliability is not a soft factor. It is a capital metric, because a reversed approval costs you real money and real time. Score any partner on these four:
- 💸 Effective interest rate: the true APR, not a flat fee dressed up to look cheaper.
- ⏰ Disbursal time: how fast the cash actually lands when the mismatch hits.
- 🔄 Repayment flexibility: can repayment flex with your revenue, or does it pull faster than the contract says?
- ✅ Term reliability: does the lender honor written offers, or change them daily?
Running this rubric is easier when you can forecast cash flow and size your real working capital needs before you sign anything.
🧭 Where I think this is heading
This is the bar we built Luca's capital to clear: transparent effective rates, fast disbursal, repayment that flexes with your sales, and offers we honor. My read for the next 18 months is that "friendly" financing claims stop working on operators who have read the contracts.
The model I am betting on pairs funding to scale your campaigns with the intelligence to know when the spend is actually worth it. So here is the question I am sitting with: what happens to capital pricing once founders can see the true cost in plain numbers before they sign?

.webp)
.svg)
.webp)

.png)
