.svg)
.svg)

What is ecommerce data collection (and why does it feel like drinking from a fire hydrant)? [toc=1. What It Is]
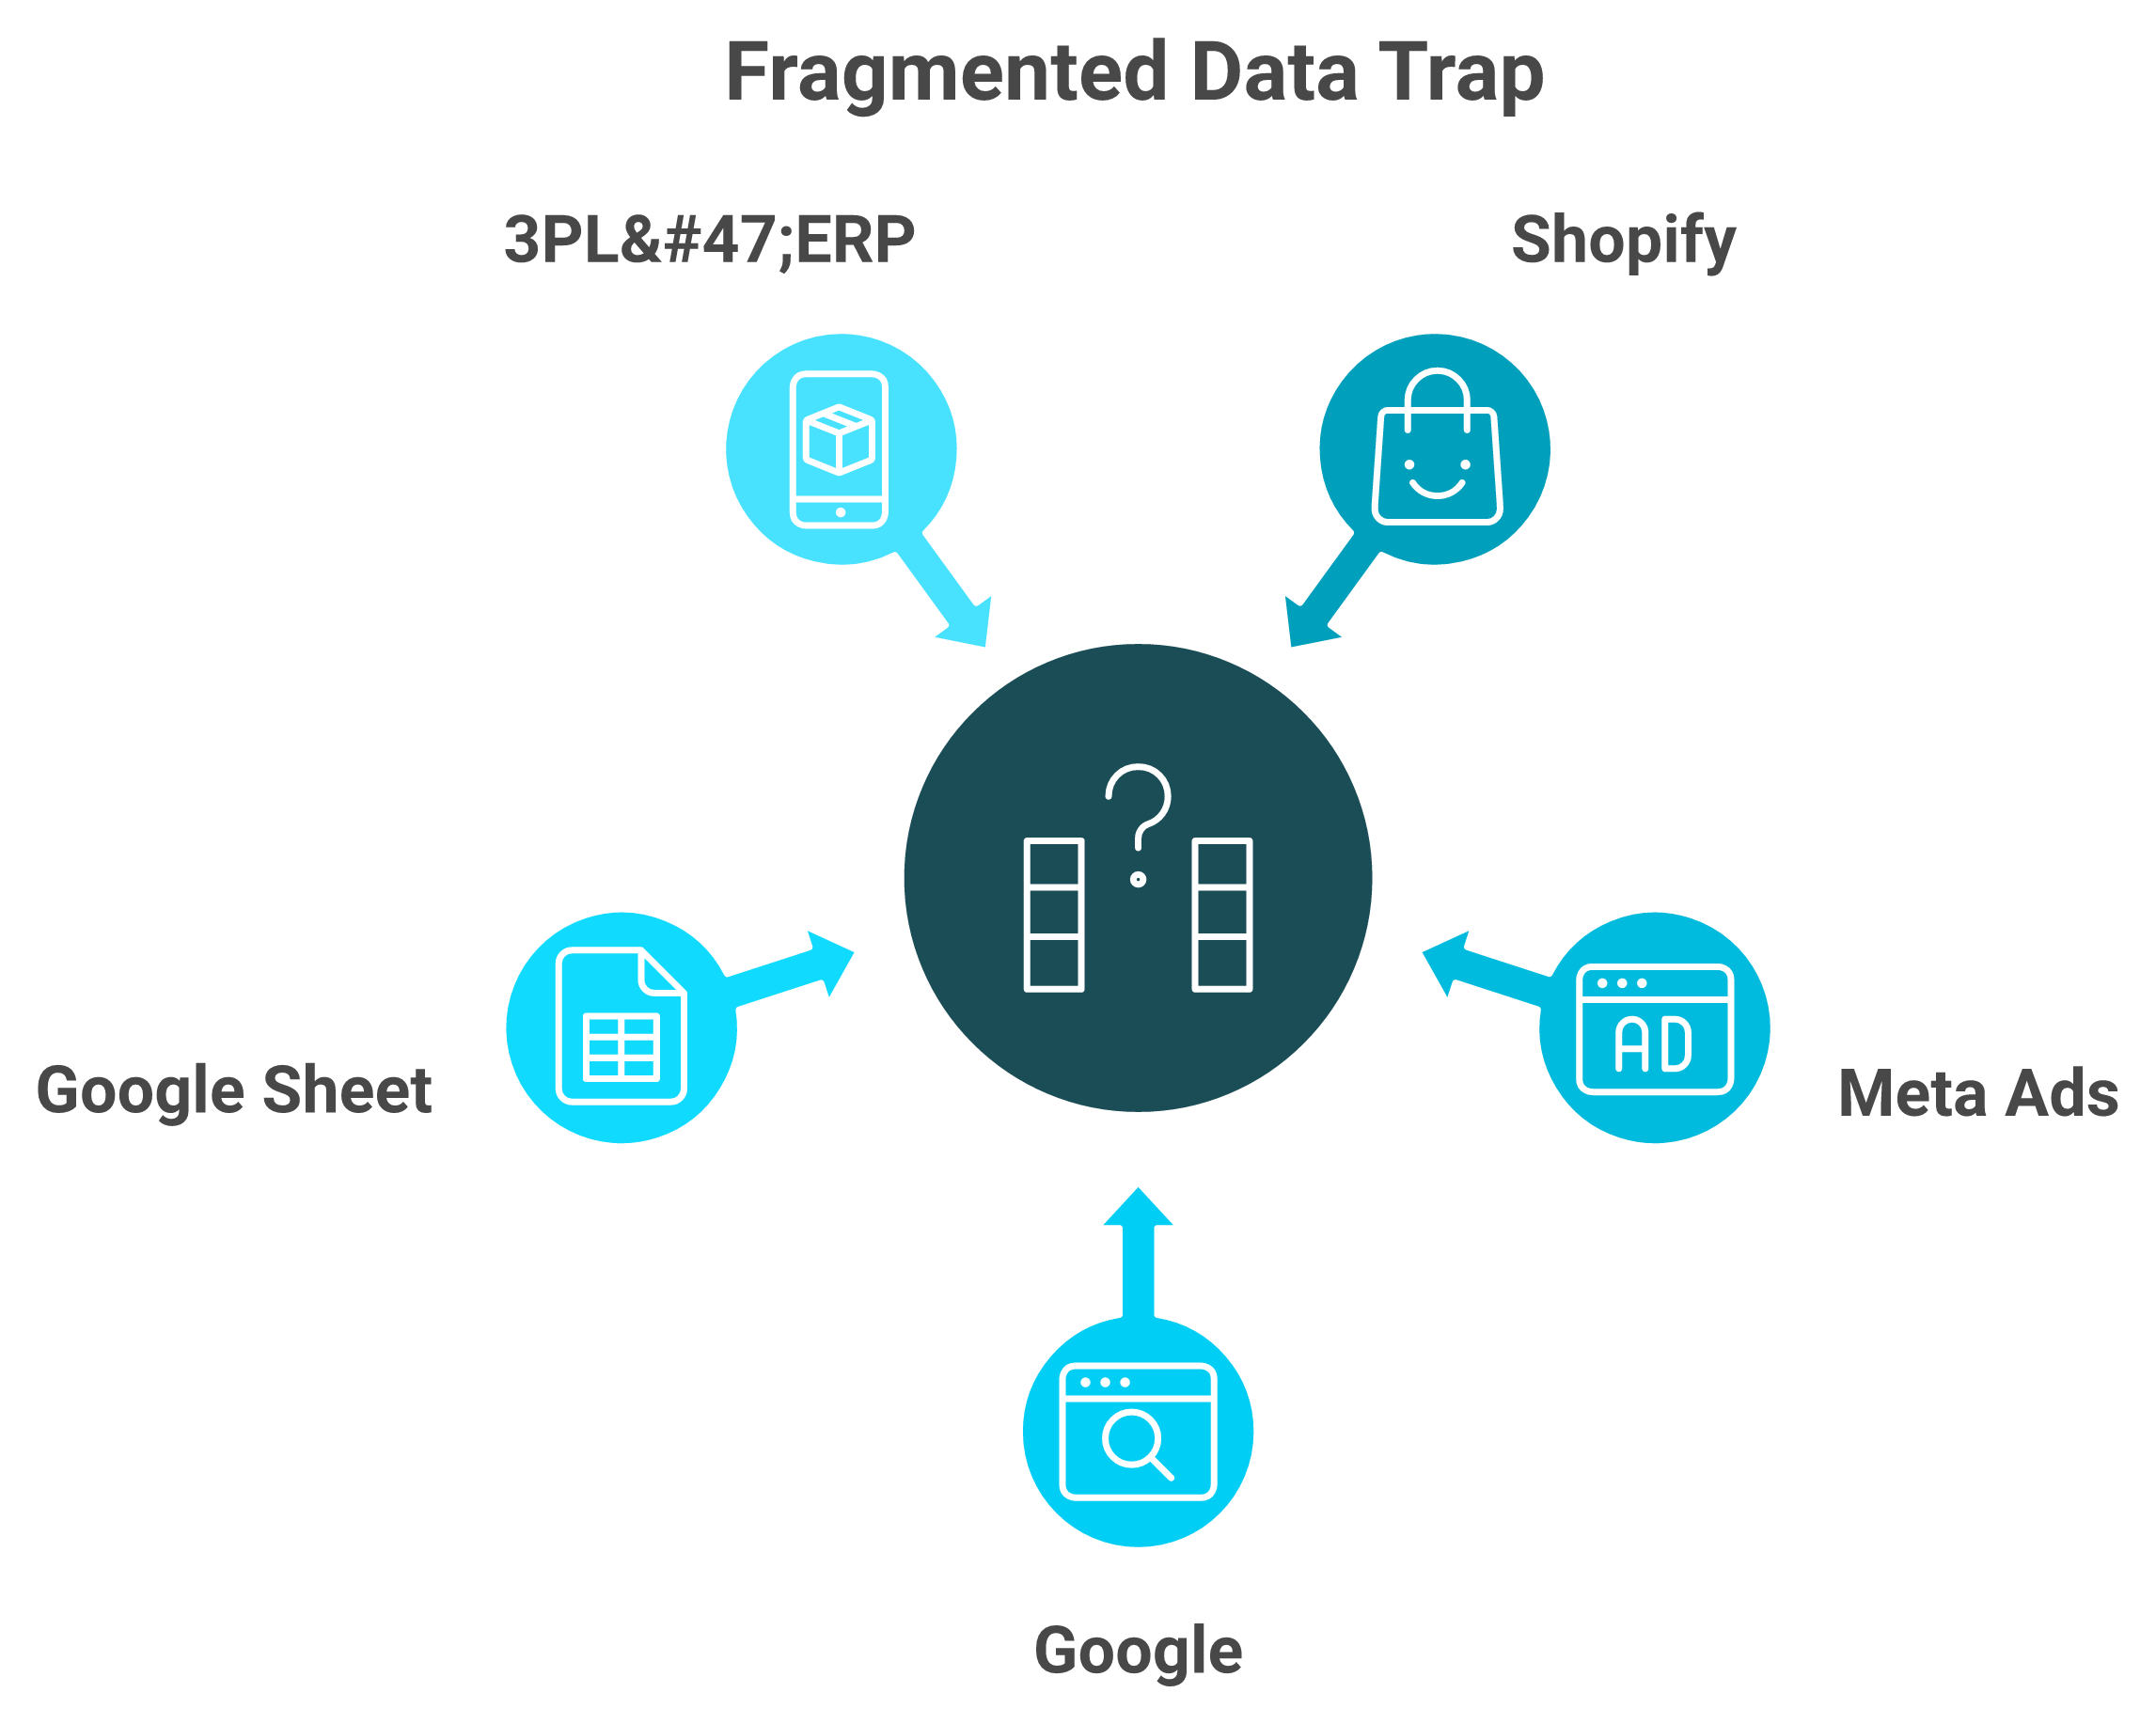
Ecommerce data collection is the practice of capturing, organizing, and acting on the behavioral, transactional, product, and financial data your store generates across Shopify, Meta, Google, and your back office. Done right, it turns scattered exports into one decision-ready layer. Done wrong, you get a torrent of disjointed logs you can't actually make a decision from.
I sat with a founder doing roughly $400K a month last quarter. She opened seven browser tabs to answer one question: "Did we make money on the Black Friday bundle?" Shopify said one thing. Meta said another. Her Google Sheet said a third. That's not a data problem. That's a logic problem.
🌊 The torrent versus the signal
Most operators aren't starved for data. They're drowning in it. One operator described pulling everything into a cloud warehouse and getting back "logs and logs of data you can't make a decision from." The fire hydrant is on full blast. The cup is the size of a Monday morning.
Here are the four domains every store quietly generates:
- Behavioral data: sessions, clicks, scroll depth, and session recordings.
- Transactional data: orders, average order value (AOV), and repeat-purchase rate.
- Product and inventory data: SKU velocity, stock levels, and return rates.
- Financial data: contribution margin, customer acquisition cost (CAC), and cash position.
🧠 From logs to logic
The job isn't collecting more. It's connecting what you already have so a question gets one answer, not seven. That's the gap we built Luca to close. Luca is an AI layer that sits on top of your data warehouse and turns the torrent into one readable view, so you ask a question in plain English instead of reconciling tabs.
My read right now: the brands that win the next 18 months won't be the ones with the most dashboards. They'll be the ones whose data is clean enough to answer a question fast. The rest of this guide walks the three moves that get you there, capture, organize, and use. If you want the longer version of why this hurts, we wrote about why ecommerce founders are drowning in data.
What types of ecommerce data should you collect (zero, first, second, and third-party)? [toc=2. Data Types]
Collect across two lenses. By source: zero-party (data customers volunteer), first-party (your owned behavioral and transactional data), second-party (a partner's first-party data), and third-party (bought, now fading post-cookie). By domain: behavioral, transactional, product, and financial. The real mistake isn't collecting too little. It's collecting volume while ignoring the one number that matters, net contribution margin per SKU.
🔑 The four data parties, in plain English
Marketers love jargon. Operators need definitions. So here they are, fast.
- Zero-party data: what a customer tells you directly, like a quiz answer or a preference.
- First-party data: what you collect on your own store, like orders and on-site behavior.
- Second-party data: a trusted partner's first-party data, shared with permission.
- Third-party data: data bought from outside aggregators, which is fading as cookies die.
First-party is your moat. It's free, it's accurate, and no privacy update can take it away. Third-party is the rented apartment you're about to get evicted from.
📊 Which data actually drives a decision
Here's a number that reframes the whole exercise. An operator analyzing customer-service load found that 42% of all support tickets traced to a single product, which worked out to $1.45 per unit in hidden cost. That cost never shows up in gross margin. It only shows up if you collect data down to the SKU, which is the kind of view our guide to tracking unit economics walks through.
⚠️ More reports, less action
I'll say the quiet part out loud. More dashboards often lead to less action, not more. One mid-market operator put it bluntly: the optimization opportunity around merchandising is huge, yet "more reports often lead to less action." Staring at fifteen charts is not a decision.
This is where Luca earns its keep on the analytics side. Instead of handing you another dashboard, it extracts the relevant slice for the question you actually asked, like true contribution margin per SKU, and tells you which product is quietly bleeding cash.
What are the methods and tools to collect ecommerce data (and which should you use)? [toc=3. Methods and Tools]
The core methods are warehouse-backed AI analysis, server-side event tracking, on-site tags, session recordings, zero-party surveys, and transactional logs. The 2026 accuracy unlock is moving from browser pixels to server-side tracking with consent mode, then reconciling every source back to Shopify as your source of truth. Pick methods by data quality, cost, effort, and compliance risk, not by whatever installs fastest.
🛠️ The collection methods, ranked by leverage
1.1 Warehouse-backed AI layer (Luca). This sits on top of your connected sources and reads them as one pool. The capture methods below feed into it; it extracts, predicts, simulates, and finds root cause across the lot. You ask in plain English, no SQL, no analyst. See the full data analysis use cases.
1.2 Server-side event tracking. Events fire from a server, not the browser, so ad blockers and cookie limits don't gut your data. This is the single biggest accuracy upgrade most stores can make in 2026.
1.3 Google Tag Manager (GTM) plus GA4. Your tag-management and web-analytics base layer. Useful, but increasingly modeled rather than measured (more on that below). If you're setting this up, our walkthrough on adding Google Analytics to Shopify covers the basics.
1.4 Session recordings. Tools like Hotjar or Microsoft Clarity show why people bounce, not just that they did.
1.5 Zero-party surveys. Post-purchase "how did you hear about us?" surveys catch attribution that pixels miss.
1.6 Transactional and inventory logs. Straight from Shopify, your 3PL, and your ERP. The unglamorous source of truth.
⚙️ A hands-on GA4 + GTM + Shopify setup
Here's the sequence I walk operators through. Do it once, reconcile, then trust it.
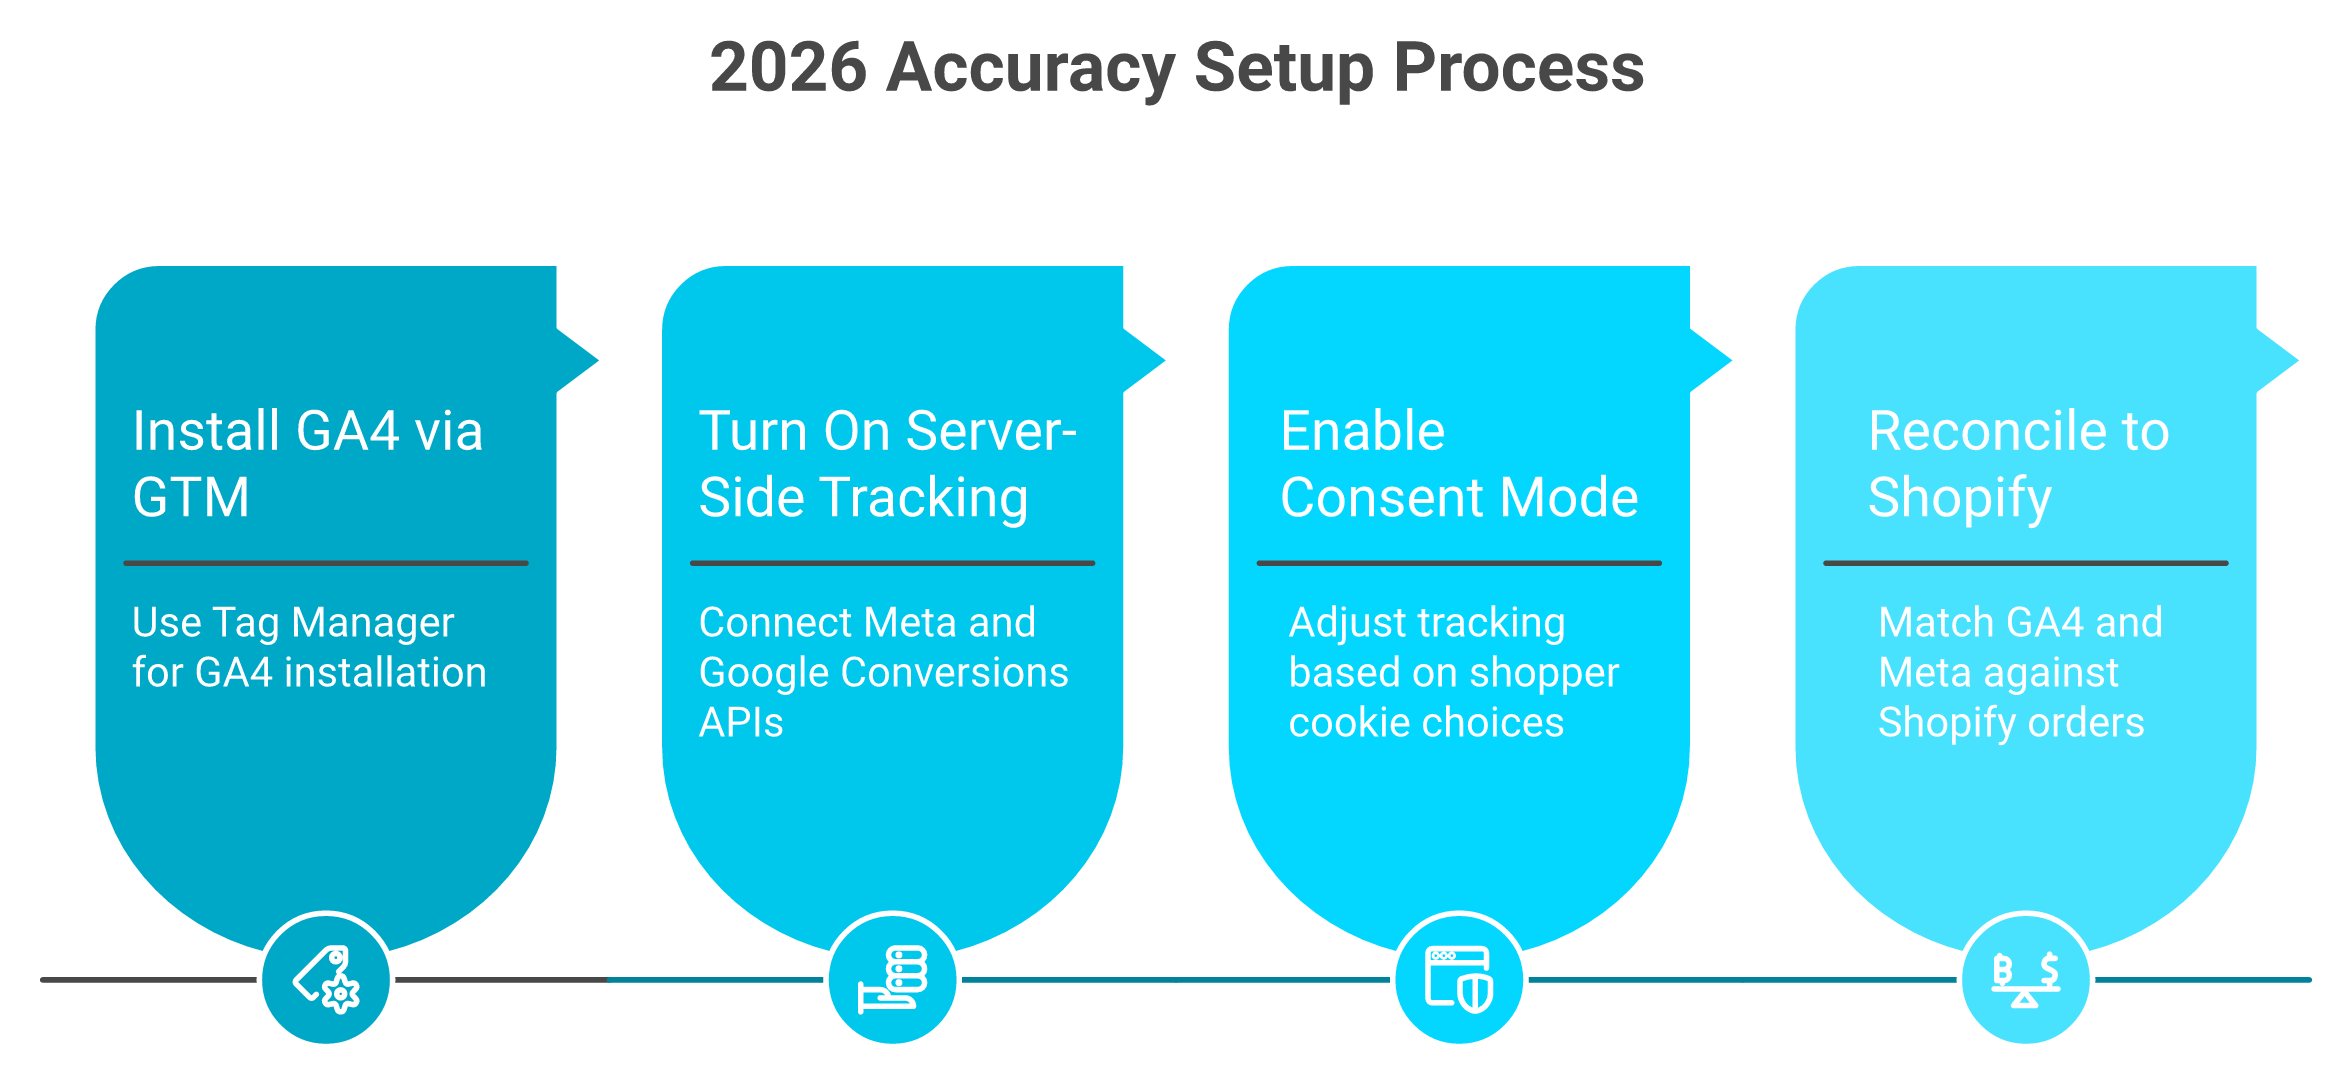
- Install GA4 through GTM, not the native theme snippet, so you control every tag.
- Turn on Shopify's server-side tracking and connect the Meta and Google Conversions APIs.
- Enable consent mode (the setting that adjusts tracking based on a shopper's cookie choice) to stay compliant with GDPR.
- Reconcile GA4 and Meta against Shopify order data. If you're not within ~5%, something's leaking.
📐 Picking a method: quality vs cost vs effort vs risk
🧾 Why "just add a dashboard" keeps failing
Operators don't churn off analytics tools because they hate data. They churn because the data is wrong. One multichannel seller's review is brutal and specific:
"Since day one, the data has been inaccurate. Daily revenue totals are wrong, entire order blocks are missing... Triple Whale shows orders from external marketplaces as if they were real conversions even though these orders never go through our Shopify store."
XTRA FUEL Triple Whale Trustpilot Verified Review
The base layer isn't immune either. A mid-market retail user flagged GA4's drift toward modeled data:
"It is becoming very opaque... the sampling is increasingly wild... sessions do not match the session-start event. To make decisions based on grounded data, it is really difficult to trust it 100%."
Verified User in Retail Google Analytics G2 Verified Review
The lesson I keep relearning: capture is plumbing. If the plumbing leaks, every downstream decision is wrong. Luca's role here is to normalize and standardize the data on the way in, so what you analyze is what actually happened. We compare the wider field in our roundup of the best Shopify analytics apps.
Why does standardizing data on ingestion matter more than any dashboard? [toc=4. Standardize on Ingestion]
Standardizing data on ingestion, fixing schema, naming, and retail-week conventions before data ever hits analytics, is the highest-leverage step in ecommerce data collection. It's also the only foundation that makes AI reliable. A model can only reason on a clean, consistent dataset. As one operator put it, "the only way an agent is going to work is if there's a decent data set, standardized as much as possible."
🧱 The moat nobody brags about
Founders love to argue about attribution models. Almost nobody talks about schema, the boring structure that defines how your data is named and organized. That's a mistake. Standardization is the moat, and it's invisible until it breaks.
Think of it like inventory SKUs. If one warehouse calls it "BLU-TEE-L" and another calls it "tshirt_blue_large," your stock report is fiction. The same thing happens across Shopify, Meta, and your ERP every single day, which is why a clean ecommerce tech stack matters so much.
🔧 The schema bottleneck, made concrete
The friction is painfully specific. One operator running multiple brands described how "simple things around retail weeks, 554, 332," were non-standard across every brand they ingested. One brand's "week 5" is another's "week 6." Multiply that across channels and your year-over-year comparison quietly lies to you.
Here's where most teams lose a year:
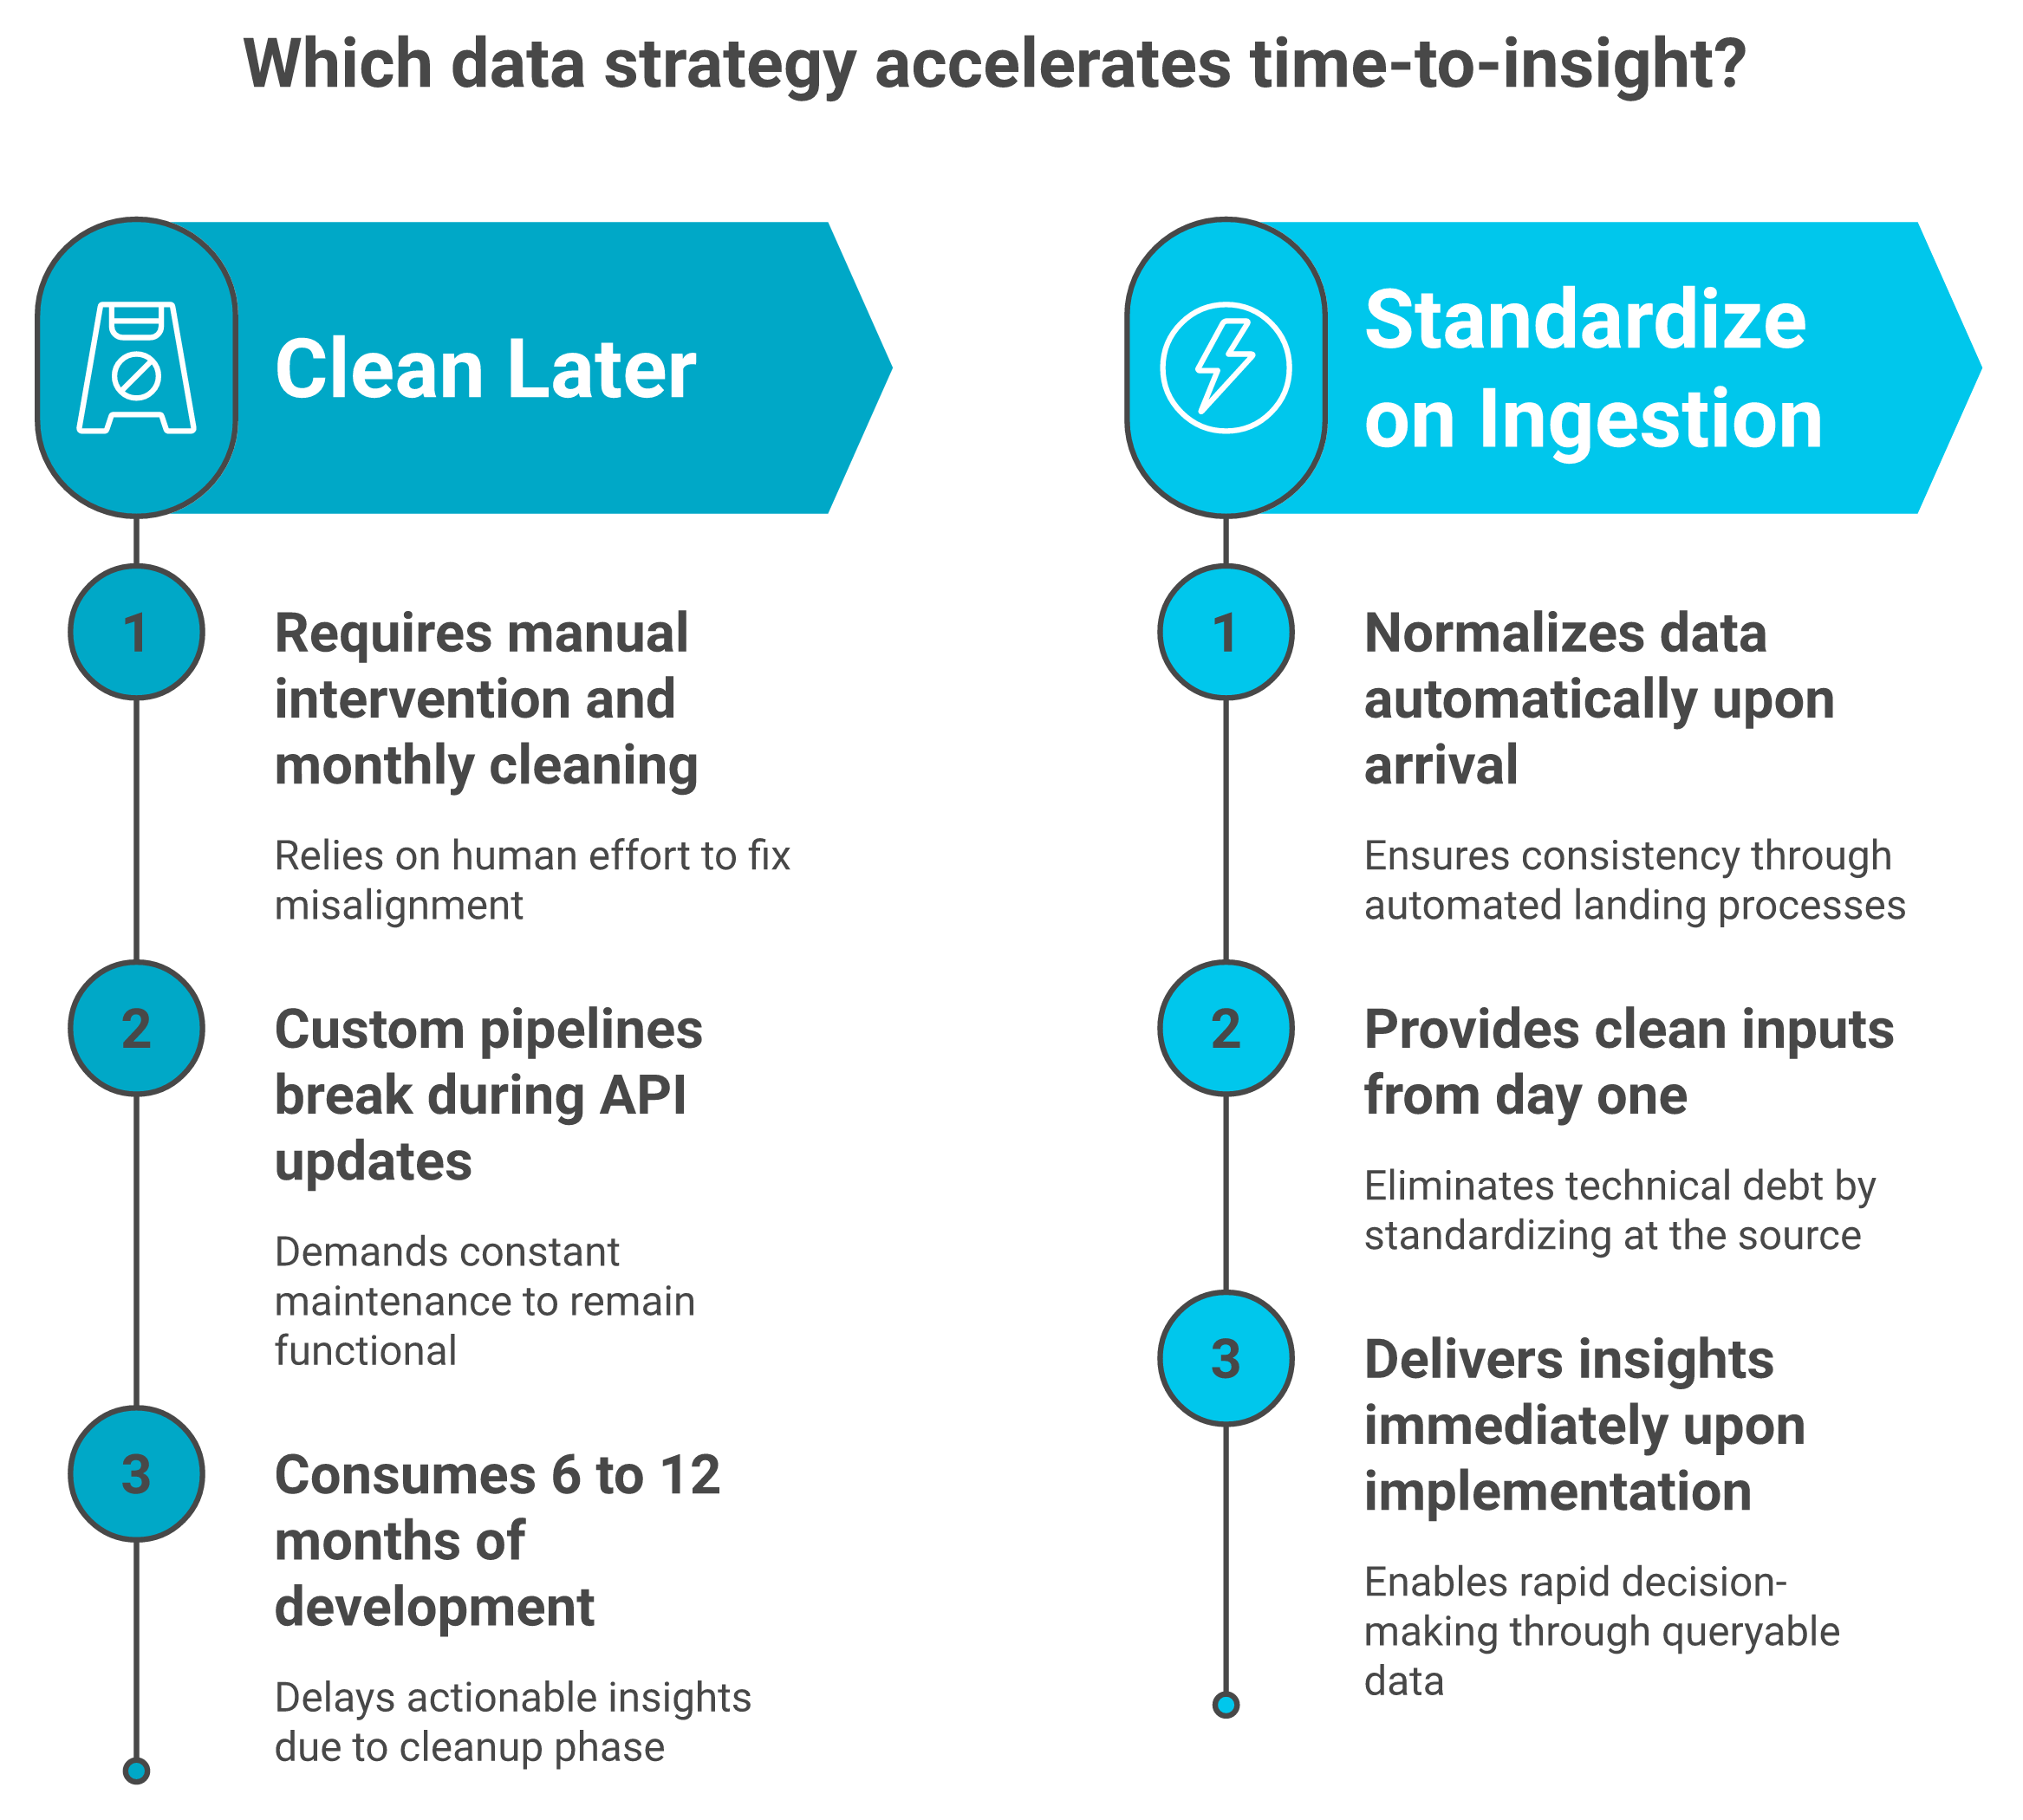
- They connect every source, then discover the data doesn't line up.
- They hire an analyst to clean it, manually, every month.
- They build a custom pipeline that breaks the next time a source updates its API.
I might be wrong on the exact timeline, but from what surfaces when you actually run this, the cleanup phase eats six to twelve months before anyone gets an insight.
⏰ Skip the data-cleanup year
The standard build-it-yourself read gets this backwards. You don't clean data so you can analyze it later. You standardize on ingestion so analysis is possible at all. This is the whole point of an AI layer like Luca. It normalizes and standardizes data as it lands, so its extraction, prediction, and root-cause work run on clean inputs from day one. Plug in, ask, act, instead of plug in, clean, wait, then maybe ask.
The agentic-shopping era makes this non-negotiable. An AI agent acting on your behalf is only as trustworthy as the dataset beneath it. Garbage schema in, confident nonsense out.
Should you build your own data system, buy one, or trust bolt-on "native AI"? [toc=5. Build vs Buy vs Bolt-On]
For almost every brand under nine figures, buy. Don't build, and don't lean on bolt-on native AI. One founder spent roughly $10 million building a proprietary system to turn data into meaning, then watched LLM-native tools arrive that were ten times better. Bolt-on AI inside inventory and analytics tools often hallucinates. Build only if data infrastructure is literally your product.
🏗️ The build trap, with a real price tag
I get why founders want to build. You connect Shopify, Meta, and your ERP (the system that runs inventory and orders), and it feels like a weekend project. It isn't.
Ari Tulla, who ran ELO Health, lived this. He spent about $10 million building a system to turn raw data into meaning, then concluded that newer language models "are ten times better than you can be even after spending $10 million." Your money is finite. It belongs in inventory or ad spend, not a pipeline that's obsolete in 18 months. We unpack this trade-off further in our take on the intelligence-capital thesis.
🤖 Why bolt-on "native AI" keeps disappointing
Every tool now ships an "AI feature." Most are thin wrappers with no real context about your business. One high-growth operator turned on the AI forecasting baked into their inventory system and shut it down fast, because it "was rubbish, hallucinating and telling fibs."
Users report the same pattern with analytics add-ons:
"Moby (the AI) is very buggy. It crashes more than half the time when I try to use it... the data is often inaccurate which defeats the whole purpose."
Matt Huttner Triple Whale G2 Verified Review
The issue isn't that AI is useless. It's that an AI bolted onto one silo can't see the rest of your business. If you're weighing the field, our roundup of Triple Whale alternatives covers the trade-offs.
⚖️ Build vs buy vs bolt-on, side by side
My read right now: buy a context-aware layer that reads all your sources at once. That's the whole design idea behind Luca. It's an AI layer over your data warehouse, a reasoning engine, not a feature bolted onto one silo. Most analytics tools added AI. Luca is AI.
How does collected data turn into action instead of another dashboard? [toc=6. From Data to Action]
Collected data is worthless until it drives a decision, yet most tools stop at descriptive dashboards that leave founders asking "okay, but then so what?" The shift that matters is from monitoring to recommending. That means extracting the relevant data for a situation, predicting from history, finding root cause, then pushing the finding to you in Slack or email instead of waiting for you to log in.
💸 The invoice that made a founder cry
I'll never forget this one. A founder slid an invoice across the table and said, "This is our best seller, 72% gross margin." She was proud, and the dashboard agreed with her.
Then we walked the contribution margin line by line. We added the real costs: shipping, returns, payment fees, and the support load. Actual contribution margin was 8%. Her best seller was a money pit wearing a winner's jersey. This is exactly the gap our guide to tracking ecommerce unit economics exists to close.
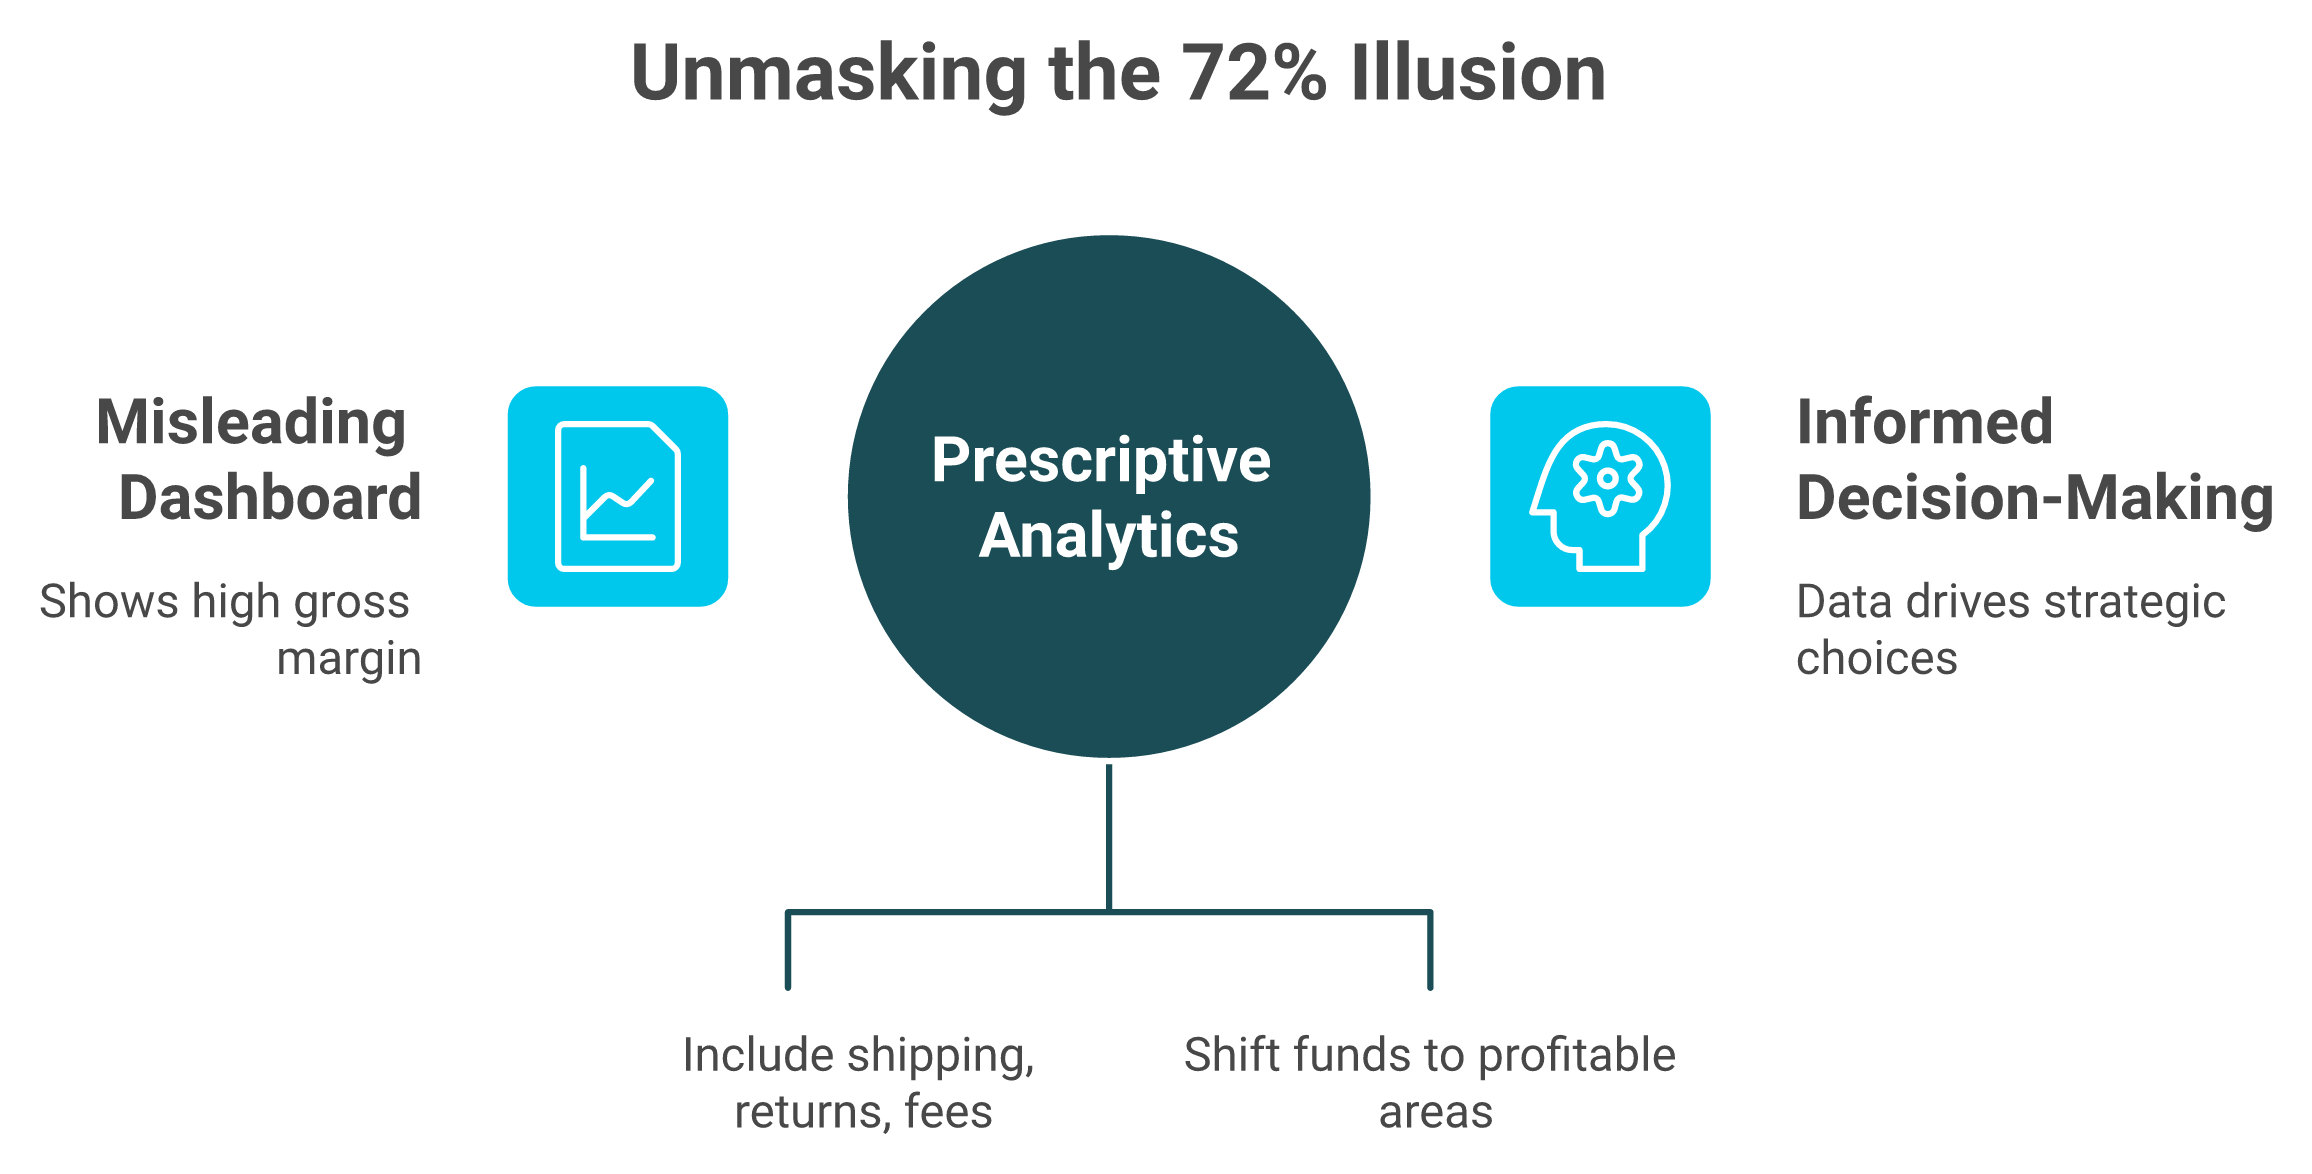
❌ Why dashboards stop at "so what?"
This is the core failure of rear-view-mirror analytics. They show you descriptive numbers, what happened, and then leave you alone with the interpretation. As one operator put it, founders are done with that: "No more descriptive analytics. Give me prescriptive."
Operators feel the gap in their reviews, too:
"Polar is good for high-level dashboards, but it tells you the what, not the why. When revenue dips, I still have to dig through five other tabs myself to figure out the cause."
Verified User Polar Analytics G2 Verified Review
A chart that needs five more tabs to explain it isn't an answer. It's homework. We compare the wider field in our roundup of ecommerce analytics platforms.
✅ From description to recommendation
The fix is a system that reasons, not just reports. Anthony Mink gave Claude terminal access to his data and ran cohort analysis (grouping customers by when they first bought). He woke up to roughly 20 executive summaries, 25 pages each, surfacing patterns no person on his team could have produced.
That's the bar for the analytics side of Luca. It extracts the relevant data, predicts from your history, simulates scenarios, and finds the root cause, then pushes a weekly report with graphs and reasoning straight to your Slack. You get cohort-level vigilance without building a cohort-level dashboard.
Where does human judgment still beat the data? [toc=7. Human Judgment Limits]
Data collection has a ceiling. Brands that get "too data driven" lose the emotional read that drives categories like fashion, where people don't decide based on a one or a zero. And autonomy without human review backfires. Even a brand at Specialized's scale shipped a $20,000 bike image with the rear derailleur mounted on the front wheel. Collection should free your judgment, not replace it.
🎨 The data-versus-soul tension
I'll hedge here, because this is contested ground. Numbers are not the whole business. One operator admitted they "fell into the trap of getting too data driven and losing touch with the emotional side."
Fashion is the clearest example. A trend, a fabric, a story, these don't show up cleanly in a spreadsheet. The standard "let the data decide" read gets this backwards. Data narrows the options. A human still picks the winner.
⚠️ When automation skips the human, it breaks
Here's the cautionary tale. A brand at Specialized's scale published a homepage image of a $20,000 road bike with the rear derailleur placed on the front wheel. AI generated the asset, and no human caught it before it went live.
That's the risk of autonomy without QA (quality assurance, a human checking the output). The lesson isn't "don't use AI." The lesson is keep a human in the loop on anything customer-facing, which is why we built process-malfunction troubleshooting to flag, not auto-publish.
🤝 Let the machine do the plumbing
So where does this leave us? AI is excellent at the grind: cleaning data, watching metrics, and flagging the outlier at 2am. Humans are still better at taste, timing, and the feel of what will work.
That's how I think about Luca. It handles the plumbing and surfaces the alert, then hands the judgment call back to you. We don't want autonomy without QA. We want a sharper operator with less busywork.
When your data signals a growth move, how fast and cheap can you fund it? [toc=8. Funding the Move]
When your data flags a winning SKU to reorder, the bottleneck is usually capital, not insight. Judge a funding source on the metrics that actually matter: effective rate, disbursal time, repayment flexibility, and the reliability of the committed offer. Operators get burned constantly by financiers that reverse approved offers, redirect Shopify payouts, or take weeks to release funds, turning a timing edge into a missed quarter.
⏰ Speed and reliability are the real product
A reorder decision has a clock on it. If your bestseller is selling out and the cash takes three weeks, you've already lost the window. Slow capital is expensive capital, even at a low headline rate. Our guide on funding to scale marketing campaigns walks the timing math.
The reliability problem is worse than the speed problem. Operators describe getting a written, approved offer, then watching it vanish:
"After being offered funding in writing with specific amounts, repayment terms, and confirmation that the deal was approved, Wayflyer abruptly reversed their decision at the last minute. This caused significant disruption to our operations and cash flow."
Geoff Brand Wayflyer Trustpilot Verified Review
You can't plan a Q4 inventory buy on an offer that evaporates. If Wayflyer is on your shortlist, weigh the Wayflyer alternatives first.
💸 Read the terms, not the pitch
The headline rate is rarely the real cost. Watch the contract mechanics, because that's where the money leaks.
"They pulled funds far faster than the contract stated, thereby increasing the effective interest rate significantly, and then could never resolve these issues."
Thomas Bishop Clearco Trustpilot Verified Review
And bait-and-switch on the committed amount is common at the worst possible moment:
"We signed a 3M loan deal, only for them to come back two weeks later... slashing our funding to 1M. Then, months later, right as we hit our 5% EBITDA margin and were expanding, they cut it again to 350K."
Xin Shui Uncapped Trustpilot Verified Review
✅ What to demand from a capital partner
On capital, Luca competes where it counts: fast disbursal, transparent and fixed terms, and an offer that holds once it's committed. We'd rather fund the move on time than win the headline-rate beauty contest.
How do you build an agentic-ready data collection system this quarter? [toc=9. Your 90-Day Plan]
Start this quarter in four moves: make your store machine-readable and shift to server-side tracking, standardize your schema on ingestion so every source reconciles to Shopify, prioritize one decision metric (net contribution margin per SKU) over dashboard volume, and set up proactive reporting so insights reach you in Slack or email. Skip the data-cleanup year. Plug in, ask, act.
🤖 Step 1: Make your data machine-readable
Before anything clever, get the basics readable. One operator put it plainly: "making your website machine readable for agents is the first layer, the most basic thing."
- Action: Move to server-side tracking and clean up your product feed and structured data.
- Expected outcome: Agents and tools can read your store without guessing.
- Pitfall: Skipping this and wondering later why your AI answers are wrong.
If you want the deeper version of this shift, our primer on agentic AI for ecommerce founders walks the readiness checklist.
🧱 Step 2: Standardize on ingestion, not later
This is where most teams lose six months. Don't connect five sources and then start a cleanup project. Fix the schema as the data lands.
- Action: Set one naming convention and one retail-week standard across every source.
- Expected outcome: Year-over-year comparisons stop lying to you.
- Pitfall: A custom pipeline that breaks the next time a source updates its API.
This is the design choice behind Luca. It normalizes and standardizes data on ingestion, so analysis runs on clean inputs from day one.
💰 Step 3: Pick one metric that drives a decision
You don't need forty dashboards. You need one number that changes what you do on Monday.
- Action: Track net contribution margin per SKU, the profit left after every variable cost.
- Expected outcome: You spot the "72% gross, 8% contribution" trap before it drains cash.
- Pitfall: Drowning in vanity metrics while the money-loser hides in plain sight.
I could be off on the exact ranking, but from what surfaces when you actually run this, contribution margin per SKU beats almost every other starting metric. Our guide to tracking unit economics shows how to calculate it cleanly.
⏰ Step 4: Make it proactive, not a login chore
A dashboard you have to remember to check is a dashboard you'll forget. The real unlock is scale and automation.
One operator framed the ambition well: a marketer reviews maybe five session recordings a week, so "what if you get the AI to look at 5,000 recordings per day" and surface what no human could?
- Action: Set outlier alerts (ROAS dips, inventory below threshold, and CAC spikes) pushed to Slack.
- Expected outcome: The system pings you, instead of you hunting.
- Pitfall: Pushing so many alerts that your team mutes the channel.
One quiet tactic from the field: a team named their AI "Harry," which cut adoption resistance and saved "100 questions a day from new starters." Personifying the tool made people actually use it. This is the kind of always-on monitoring our marketing analysis and automation use case is built around.
🚀 Where this goes next
This is the analytics job Luca is built for: connect your sources, standardize on ingestion, then send a weekly CAC report with graphs, reasoning, and recommendations straight to your inbox. Cohort-level vigilance, without building the cohort-level dashboard.
Here's the question I'm sitting with for the next 18 months. As agentic shopping grows, the brands with clean, standardized data will let AI act on their behalf, and the rest will still be reconciling tabs. So my honest question back to you: if you had to pick one decision to hand a reasoning engine this week, what would it be? Tell me what you're trying to decide, and we'll pressure-test whether your data is ready for it.

.webp)
.svg)
.webp)

.png)
