10 Best AI Agents for Ecommerce Data Analysis (Shopify, Amazon & DTC)
14
mins read
TL;DR
The ten agents worth evaluating in 2026 are Luca AI, Triple Whale Moby, Polar Analytics, Saras IQ, Peel Insights, Glew.io, Julius AI, ThoughtSpot Spotter, Tellius, and Jungle Scout AI Assist.
Scoring weighted root-cause depth at 30%, ecommerce data coverage at 25%, agentic push at 20%, setup at 15%, and verified reviews at 10%.
Three tiers exist: a model on an upload, a copilot inside a dashboard, and a true agent that plans, checks, and explains its own analysis.
Test every vendor on five questions: MER movement, contribution margin by SKU, blended CAC, stockout risk before Q4, and cohorts about to churn.
Median DTC revenue grew 15.2% in H1 2026 while ad spend grew 28%, which is a margin problem dressed as growth.
Fix SKU naming, revenue and customer definitions, landed COGS, and your retail calendar before any demo, then cap spend at 2% of monthly ad spend.
Q1. What are the 10 best AI agents for ecommerce data analysis in 2026? [toc=1. The 10 Best Agents]
The ten best AI agents for ecommerce data analysis in 2026 are Luca AI, Triple Whale Moby, Polar Analytics, Saras IQ, Peel Insights, Glew.io, Julius AI, ThoughtSpot Spotter, Tellius, and Jungle Scout AI Assist. Luca AI leads this list because it sits as an AI layer over your store data, finds the root cause behind a metric move, and pushes the finding to you. Most tools here still wait for you to open a tab. I picked these ten after checking verified ratings, connector coverage, and how much reasoning each one actually does.
The 10 tools at a glance
Luca AI: Best for cross-functional root cause analysis and proactive reporting
Triple Whale Moby: Best for paid media attribution and ad-side agents
Polar Analytics: Best for fast unified dashboards on Shopify
Saras IQ: Best for governed answers on a managed ecommerce warehouse
Peel Insights: Best for cohort and retention analysis
Glew.io: Best for multichannel and marketplace reporting
Julius AI: Best for ad hoc analysis on uploaded files
ThoughtSpot Spotter: Best for search-style analytics at mid-market scale
Tellius: Best for automated driver and root cause investigation
Jungle Scout AI Assist: Best for Amazon seller research and catalog signals
Comparison table
10 Best AI Agents for Ecommerce Data Analysis in 2026
Tool Name
Key capabilities offered
Best For
Pricing
Luca AI ⭐⭐⭐⭐⭐
Plain-English querying, root cause analysis, predictive reorder and sales alerts, scheduled Slack and email reports
DTC and mid-market stores at $1M to $5M revenue with data sitting unused
Mid-market teams with a warehouse already in place
Quote-based to Custom
Tellius ⭐⭐⭐⭐
Automated driver analysis, anomaly detection, natural language to SQL
Data teams that want automated why-did-this-change answers
Quote-based to Custom
Jungle Scout AI Assist ⭐⭐⭐
Amazon product and keyword research, catalog signals, sales estimates
Amazon FBA sellers and hybrid marketplace brands
Quote-based to Custom
1.1 Luca AI [toc=1.1 Luca AI]
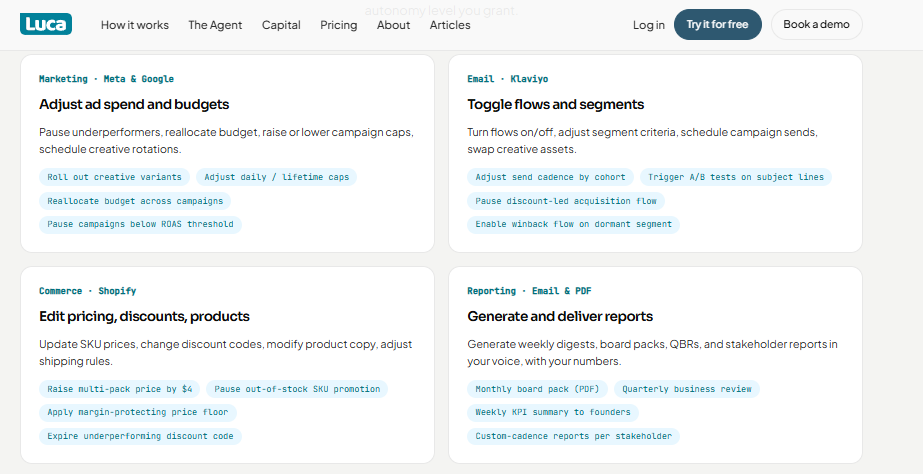
Luca AI executes marketing, email, pricing and reporting tasks at the autonomy level you grant.
⭐ Why did we choose this tool?
I put Luca AI first, and I should be upfront: I co-founded it. That is exactly why I can be specific about where it wins and where it does not. Luca AI is an AI layer over your store's data that reasons across marketing, finance, inventory, and customers in one pass. It answers why a number moved, not just what the number is. That cross-functional read is the part I could not buy anywhere else, so we built it.
What was the problem? A women's supplements founder walked into a review with an invoice for her top seller. She was certain it carried 72% gross margin, and she had scaled it for two years.
How Luca helped? We rebuilt the number line by line, cost by cost. Freight, duties, payment fees, pick and pack, returns, and the ad spend tied to that SKU all got loaded against the product.
What was the outcome? ⚠️ True contribution margin came in at 8%, not 72%. She had spent two years scaling a product that barely broke even. Within 20 minutes, she had a reorder decision she could defend, and a margin floor for every future buy.
❌ Not recommended for
Luca AI is the wrong buy below roughly $1M in revenue, where there is not enough history to reason against. It is also wrong for enterprises that already staff a data team with a governed warehouse.
Luca AI normalizes and standardizes data on ingestion, so revenue means the same thing whether it arrives from Shopify, Stripe, or Xero, and the first useful answer lands before a cleanup project would have started.
1.2 Triple Whale Moby [toc=1.2 Triple Whale Moby]
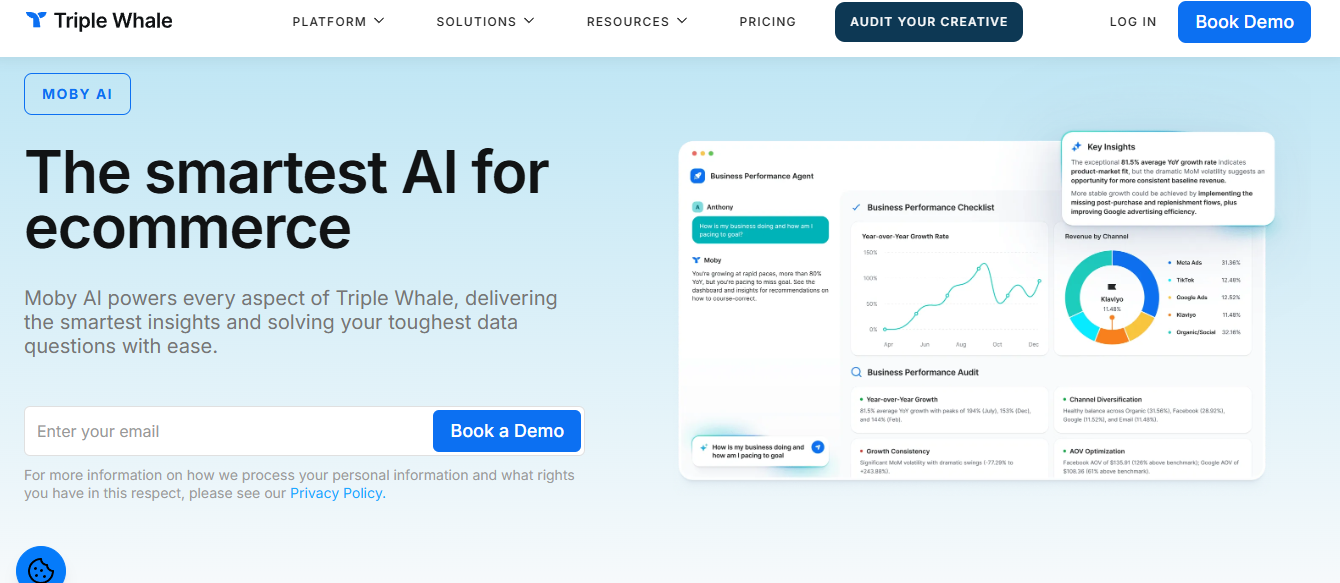
Moby AI answers pacing questions with channel revenue splits and an automated performance audit.
⭐ Why did we choose this tool?
Triple Whale earned its place because Moby is the most widely used AI analyst in DTC. Moby 2, launched in May 2026, moves past reporting into configured actions inside ad platforms. Operators genuinely use it live in meetings instead of pulling reports afterward. The Triple Pixel also gives you first-party tracking that beats native Meta reporting after the iOS privacy changes.
📊 Core evaluation metrics
Data sources connected: Shopify, Meta, Google, TikTok, Klaviyo, plus Triple Pixel events
Root-cause depth: strong on marketing drivers, no finance or accounting layer
Autonomy tier: acts in ad platforms, but only with the Moby AI Pro add-on
Setup time: minutes to install, though Triple Whale advises waiting one customer-journey length before trusting pixel data
Verified rating: 4.5/5 across 481 G2 reviews, 4.2/5 across 91 Shopify App Store reviews, roughly 3.0/5 on Trustpilot
✅ Solutions offered
First-party Triple Pixel tracking and multi-touch attribution
Marketing mix modeling and incrementality testing through Compass
Moby agents for anomaly detection and budget simulation
Creative analytics and retention agent templates
Blended profit dashboards across ad platforms
😊 Best for
Brands spending real money on Meta and Google every month
Growth leads who need channel-level budget decisions weekly
Teams above roughly £4,000 in monthly ad spend, where cleaner attribution changes the call
"The attribution system is consistently buggy and unreliable, causing more harm than good." Verified user, Triple Whale, G2 Verified Review
❌ Not recommended for
Attribution accuracy is contested in recent reviews, and the one-star cluster centers on attribution, billing, and contract handling. Cost is the other wall. One founder building an alternative put the objection plainly:
"While tools like Triple Whale provide some solutions, their $129/month price tag is quite high for smaller businesses." u/Negative-Contest-592, r/ShopifyAppDev Reddit Thread
⚠️ Treat Triple Whale as decision support for media, not as your books. If you are weighing this trade-off across the category, the wider set of Triple Whale alternatives is worth reading. It sees marketing well and cash flow not at all.
Luca AI reads the same ad data alongside accounting and inventory, which is why a question like "can I fund this scale-up" gets an answer rather than a redirect. That is the same reasoning path behind declining platform ROAS versus true profitability.
1.3 Polar Analytics [toc=1.3 Polar Analytics]
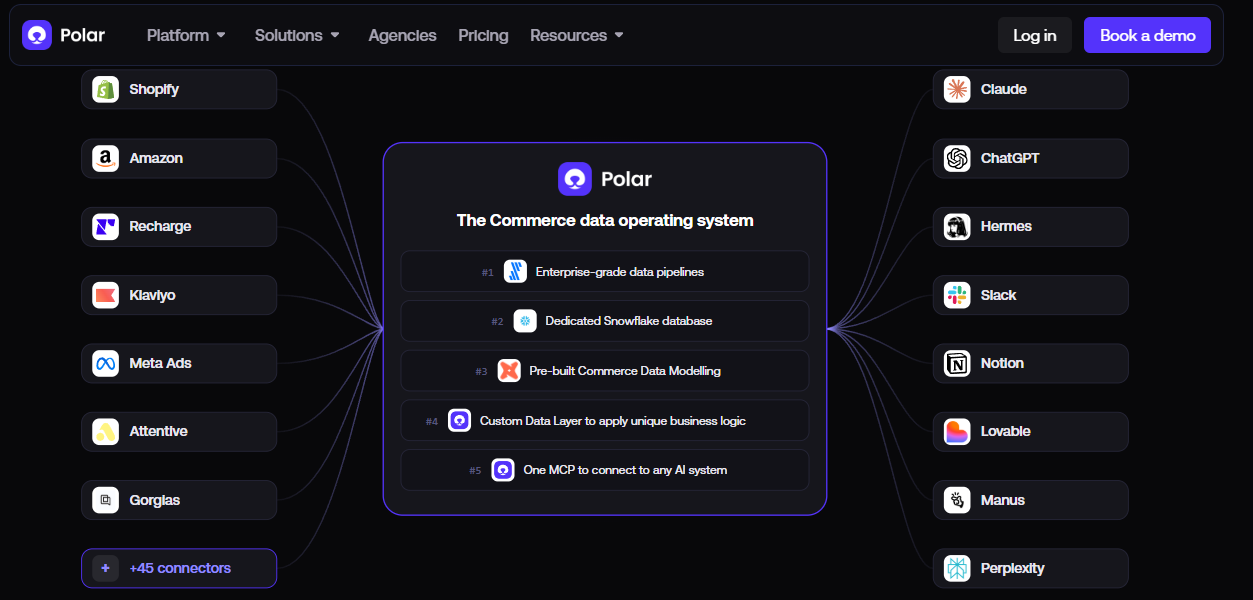
Polar centralizes Shopify and Amazon data, then exposes it to AI assistants through one MCP connection.
⭐ Why did we choose this tool?
Polar Analytics earns its spot on speed to value. Merchants report data flowing within hours of install, not weeks. It holds a 4.9 rating across 103 Shopify App Store reviews, with 97% at five stars. That is the strongest verified rating in this list. The 2026 build added multi-touch attribution and incrementality testing, which pushes it past plain reporting.
📊 Core evaluation metrics
Data sources connected: Shopify, Meta, Google, Klaviyo, TikTok, Amazon, plus custom connectors
Root-cause depth: surfaces trends and anomalies, lighter on cross-functional cause
Autonomy tier: alerts and scheduled reports, no autonomous action
Setup time: minutes to install, data visible within hours
Verified rating: 4.9/5 across 103 Shopify App Store reviews
✅ Solutions offered
Unified dashboards across store, ad, and email data
Multi-touch attribution and incrementality testing
Custom metric builder without SQL
Daily and weekly report delivery
Custom connector requests handled by their team
😊 Best for
Small marketing teams with no analyst on payroll
Shopify brands that want one reporting layer live this month
Global stores pulling from several regional storefronts
📝 Reviews
"Great tool to centralise your dispersed data! Brings everything from Shopify to Meta ads into one place. It has revolutionised how we report and helps uncover hidden trends in campaign performance and product performance. Would recommend for small marketing teams due to the low cost and easy implementation" Susanne Kaufmann, Austria, Polar Analytics, Shopify App Store Verified Review
"We've had a great experience with Polar Analytics! It makes it easy to see all of our e-commerce and marketing data in one place without having to jump between a bunch of different platforms." Naturtint USA, Polar Analytics, Shopify App Store Verified Review
❌ Not recommended for
⚠️ Polar remains a dashboard product at heart. It shows you the number and the trend. It will not tell you whether your cash position can fund the decision, because accounting data sits outside its model. For that join, see how cash flow forecasting works alongside ad data.
1.4 Saras IQ [toc=1.4 Saras IQ]
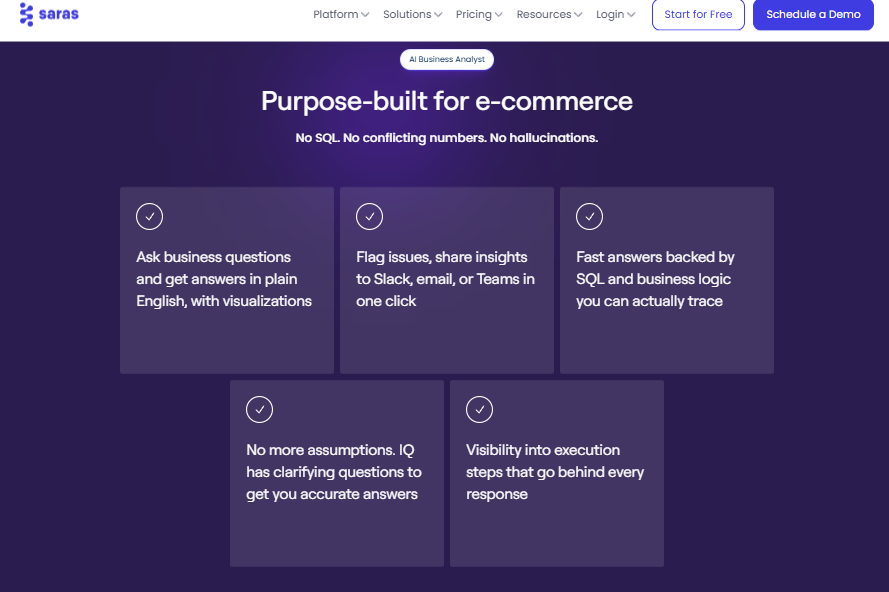
Saras IQ answers ecommerce questions in plain English with traceable SQL and visible execution steps.
⭐ Why did we choose this tool?
Saras is the pick when marketplace data matters as much as Shopify. Its Daton pipeline replicates Amazon data into a warehouse, then Saras IQ answers questions on top. G2 users rate the data layer 4.7 across 37 reviews. Saras IQ is also built as a governed vertical layer on Claude, so answers stay tied to defined logic.
📊 Core evaluation metrics
Data sources connected: Amazon, Shopify, Walmart, Meta, Google, and 100+ pipelines
Root-cause depth: strong on governed queries, depends on your warehouse model
Autonomy tier: recommends and reports, action stays with humans
Setup time: weeks, since it assumes a warehouse build
Verified rating: 4.7/5 across 37 G2 reviews for the Daton layer
✅ Solutions offered
Managed data pipelines into Snowflake, BigQuery, or Redshift
Governed natural language querying over ecommerce models
Analyst-defined semantic layer for consistent answers
😊 Best for
Brands selling on Shopify plus Amazon or Walmart
Teams that already have or want a warehouse
Mid-market operators with an analyst to own the model
📝 Reviews
"Dayton by Saras Analytics has significantly improved our Amazon advertising analysis. It seamlessly replicates our Amazon data, feeding it directly into our custom Power BI dashboards." Verified user, Saras Analytics, G2 Verified Review
"Their initial Amazon knowledge wasn't as deep as we'd hoped, but they were quick to learn and now provide excellent support." Verified user, Saras Analytics, G2 Verified Review
❌ Not recommended for
❌ Skip Saras if you have no warehouse and no appetite to build one. G2 reviewers also want more visibility into data consumption metrics, which matters when pipeline volume drives your bill. Operators comparing pipeline-first setups against a managed layer often start with reverse ETL options.
1.5 Peel Insights [toc=1.5 Peel Insights]
⭐ Why did we choose this tool?
Peel does one thing at a level nobody in this list matches: cohort and retention math. It holds a perfect 5.0 across 34 Shopify App Store reviews, with zero ratings below five stars. Reviewers repeatedly cite custom dashboards built for their specific business by Peel staff. Native Skio and Amazon connections are rare in retention tooling.
📊 Core evaluation metrics
Data sources connected: Shopify, Amazon, Skio, Recharge, Klaviyo, ad platforms
Root-cause depth: deep on repeat purchase and LTV drivers, narrow elsewhere
Autonomy tier: scheduled reports and alerts, no autonomous action
Setup time: days, with hands-on onboarding from their team
Verified rating: 5.0/5 across 34 Shopify App Store reviews
✅ Solutions offered
Automated cohort analysis by acquisition month and channel
Subscription analytics through native Skio support
😊 Best for
Consumables and subscription brands with real repeat purchase behavior
Retention leads who need cohort views without building them
Brands selling on both Shopify and Amazon
📝 Reviews
"Great app for all things retention and cohort analysis! Easy to use but also excellent service (hi, Jordan!) which has enabled me to have custom reports built out to explore problems unique to the business." Koh, Australia, Peel Insights, Shopify App Store Verified Review
"They gone through some turnover but the team at Peel now is great. They're very responsive and quick to help with any needs that I may have." Saltair, United States, Peel Insights, Shopify App Store Verified Review
❌ Not recommended for
Peel is a specialist, not a spine. ⚠️ It will not answer a margin question or a cash question. Reviewers also note past staff turnover, which is worth probing if custom work matters to you. If retention is your main lever, pair it with retention strategies built on cohort data.
1.6 Glew.io [toc=1.6 Glew.io]
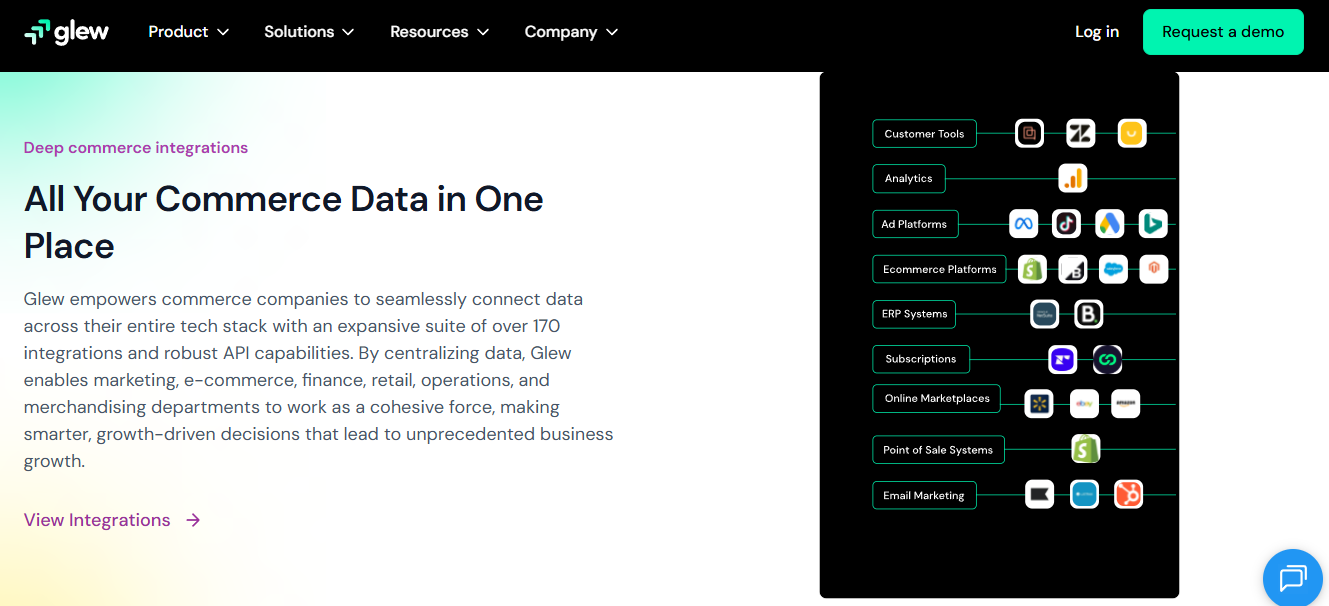
Glew consolidates multichannel commerce data across 170 integrations for finance, retail and merchandising teams.
⭐ Why did we choose this tool?
Glew has been consolidating multichannel data since before most tools here existed. Merchants use it for LTV by product type, first-touch attribution, and Klaviyo segment syncing. One reviewer credits it with insights that would have cost thousands in analyst fees. Daily snapshot emails land before the store opens, which is a real workflow habit rather than a feature.
📊 Core evaluation metrics
Data sources connected: Shopify, Amazon, eBay, Walmart, Meta, Google, Klaviyo
Root-cause depth: segment-level reporting, limited automated cause analysis
Autonomy tier: daily snapshot emails and alerts only
Setup time: hours to install, longer to configure segments
Verified rating: 68 Shopify App Store reviews, mixed on value at renewal
✅ Solutions offered
Multichannel and marketplace reporting in one view
Daily snapshot email with revenue, AOV, and ad spend
😊 Best for
Sellers running Shopify plus one or more marketplaces
Teams that want product-level buying and planning data
Brands using Klaviyo as their retention engine
📝 Reviews
"By utilizing Glew, we can obtain insights that are not native to Shopify, such as customer LTV, advertising performance and partner segmentation. We have found these insights to be invaluable for our business." Verified merchant, Glew.io, Shopify App Store Verified Review
"Communication is great in the beginning then to zero. The data is great, but Shopify's data is catching up to make Glew less valuable. Beware you will be auto renewed annually. Not enough there to justify the high cost anymore." Verified merchant, Glew.io, Shopify App Store Verified Review
❌ Not recommended for
💸 Check the renewal terms before signing. That one-star review flags annual auto-renewal with a long wait to exit. Native Shopify reporting has also closed part of the gap Glew used to fill, which is worth checking against a Shopify analytics dashboard first.
1.7 Julius AI [toc=1.7 Julius AI]
⭐ Why did we choose this tool?
Julius AI belongs here because it handles the one-off question fast. Upload a CSV, ask in plain English, and it runs Python or R behind the scenes. The free tier gives 25 daily credits, which is enough to prep for a client call. For an operator who needs one analysis before a Monday meeting, that is genuinely useful.
📊 Core evaluation metrics
Data sources connected: file uploads and limited integrations, no native Shopify sync
Root-cause depth: statistical work on what you upload, no business context
Autonomy tier: reactive only, answers when asked
Setup time: under a minute, no card required
Verified rating: 2.6/5 on Trustpilot, with 66% one-star reviews as of June 2026
✅ Solutions offered
Natural language analysis on uploaded spreadsheets
Chart and visualization generation in chat
Statistical modeling and forecasting on clean files
Presentation and slide generation
Free tier for testing before purchase
😊 Best for
Founders running a single ad hoc analysis on an export
Analysts prototyping before building something permanent
"IMO they suck because they try to solve an advanced problem without addressing intermediate steps first." Verified user, r/datascience Reddit Thread
❌ Not recommended for
❌ This is not an ecommerce agent. Reviewers report inconsistent answers on repeat questions, hallucinated analysis, and billing surprises, including one charged $500 instead of $38. Verify every number before you act on it, and compare it against a purpose-built conversational analytics layer.
Spotter is the most credible agentic layer for teams already sitting on Snowflake or BigQuery. Search-style querying means a manager can ask a question and skip the data queue. ThoughtSpot holds 4.4 across 340 G2 reviews. Pricing starts at $25 per user per month on Essentials, which is unusually transparent for this tier.
📊 Core evaluation metrics
Data sources connected: Snowflake, BigQuery, Databricks, Redshift, and cloud warehouses
Root-cause depth: Spotter explains results and guides follow-up questions
Autonomy tier: conversational and agentic, with human-controlled actions
Setup time: weeks, and requires a modeled semantic layer first
Verified rating: 4.4/5 across 340 G2 reviews
✅ Solutions offered
Natural language search across warehouse data
Spotter agent for explanation and guided analysis
Liveboards for dynamic drill-down
Governed semantic modeling with row-level security
Embedded analytics for customer-facing reporting
😊 Best for
Mid-market and enterprise teams with a cloud warehouse
Organizations with an analyst to own the data model
Businesses needing governed self-service across many users
📝 Reviews
"I find Spotter particularly valuable as it goes beyond just information retrieval by explaining data, providing additional context, and guiding users to insights they might not think of on their own." Farid V., Enterprise user, ThoughtSpot, G2 Verified Review
"I find the flexibility to transform data very limited and there's no way to stipulate what type of join to use." Louis J., Mid-Market user, ThoughtSpot, G2 Verified Review
❌ Not recommended for
⚠️ Warehouse compute costs can climb fast when business users query freely. There is no Shopify connector story here. A $2M DTC brand with no data engineer will stall during setup, which is why most stores at that stage start with AI-powered BI built for ecommerce.
1.9 Tellius [toc=1.9 Tellius]
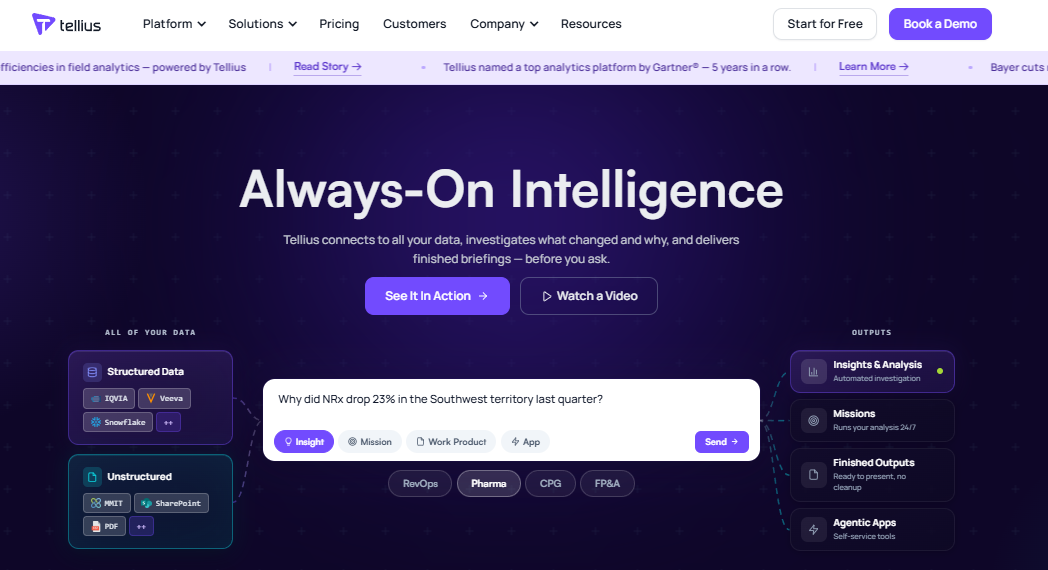
Tellius investigates what changed and why, then delivers finished briefings before anyone asks.
⭐ Why did we choose this tool?
Tellius automates the question every operator actually asks: what changed and why. Its driver analysis, anomaly detection, and narrative explanations go past dashboard summaries. G2 rates it 4.3 across 25 reviews. Reviewers with no analyst on staff describe cutting monthly reporting work in half.
Analyst-governed semantic layer and row-level security
😊 Best for
Mid-market companies with messy multi-source data
Teams that need explainable analysis for compliance
Operators replacing manual monthly deep dives
📝 Reviews
"I can ask questions in plain English, and it quickly returns relevant charts and insights, which saves me a lot of time." Ravi P., Sales Professional, Tellius, G2 Verified Review
"It's pricey, and it requires you to organize your information really well in order to use it to its full potential." Beatriz M., Administrative assistant, Tellius, G2 Verified Review
❌ Not recommended for
💰 Cost is the recurring complaint, and G2 reviewers say the pricing structure suits enterprises rather than small businesses. Visualization options are also thin for board decks, so plan your data visualization layer separately.
1.10 Jungle Scout AI Assist [toc=1.10 Jungle Scout AI Assist]
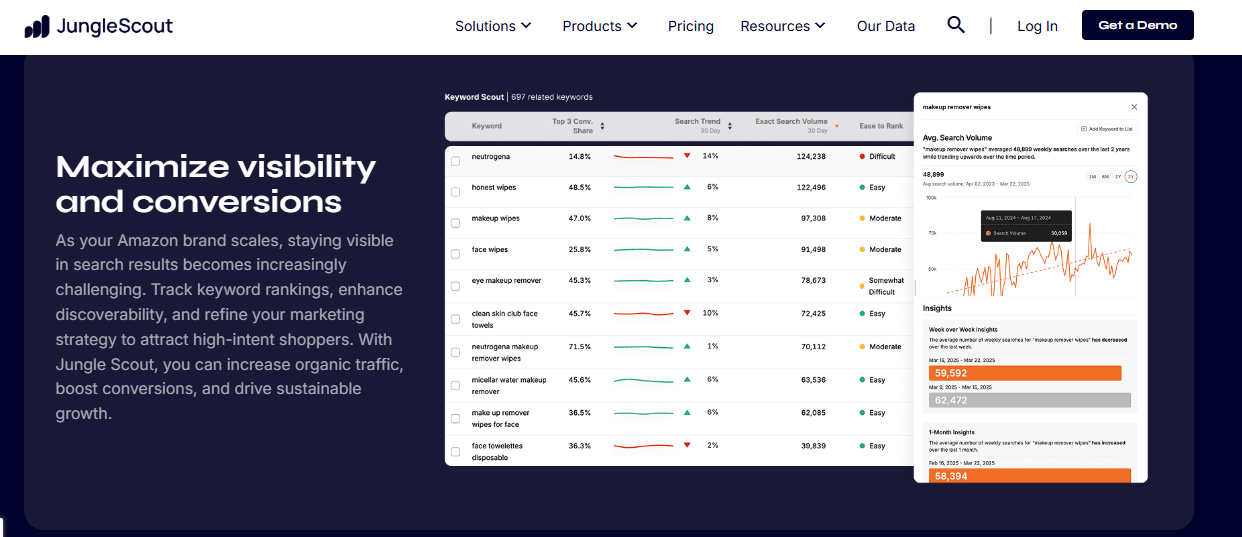
Jungle Scout surfaces Amazon keyword demand signals, though estimates need checking against Seller Central numbers.
⭐ Why did we choose this tool?
Amazon sellers need a different data layer, and Jungle Scout still owns that category. AI Assist speeds up product and keyword research on a catalog you do not fully control. It carries 4.1 across 3,940 Trustpilot reviews. Adoption context matters here: 48% of Amazon sellers report using AI tools in operations.
📊 Core evaluation metrics
Data sources connected: Amazon Seller Central, marketplace catalog and keyword data
Root-cause depth: research and estimates, not cross-functional cause analysis
Autonomy tier: read-only reporting and research, ad analytics not actionable
Setup time: minutes for the extension, longer for account data sync
Verified rating: 4.1/5 across 3,940 Trustpilot reviews
✅ Solutions offered
Product and keyword research with sales estimates
Competitor catalog and listing analysis
Inventory and financial tracking for Amazon accounts
Review request automation
Supplier discovery
😊 Best for
Amazon FBA sellers researching new product launches
Hybrid brands selling on both Shopify and Amazon
Sellers who need marketplace demand signals weekly
📝 Reviews
"A good platform for someone who is starting out their journey of eCommerce. Great place to do product research with enough data to back your product strategy. It's an ideal starting point for a business owner." Siddhartha, Jungle Scout, Trustpilot Verified Review
"Unfortunately, the data is not accurate and I launched a product based on it which failed given the low search volume and sales, not recommended" Irina Bianchi, Jungle Scout, Trustpilot Verified Review
❌ Not recommended for
❌ Data accuracy and billing draw the loudest complaints, including plan forced upgrades and mismatches against Seller Central numbers. Treat estimates as direction, not truth. This tool sees Amazon only, so your Shopify margin picture stays missing, and omnichannel analytics remains a separate job.
Which three should you actually shortlist?
If you run Shopify under $5M, test Luca AI, Polar Analytics, and Peel. If Amazon carries most of your revenue, pair Jungle Scout AI Assist with Saras IQ. If you already have a warehouse and an analyst, look at ThoughtSpot Spotter and Tellius instead.
Luca AI sits first on this list because it joins ad, order, cost, and cash data on ingestion, then answers why a number moved. That single question is where the other nine either hand you a chart or hand you a redirect. If you want the wider picture, our take on agents for ecommerce covers where this category is heading.
Q2. How did we score and rank these AI agents? [toc=2. Scoring Methodology]
Every agent in this list was scored out of 100 across five weighted criteria: Root-Cause and Predictive Depth (30%), Ecommerce Data Coverage (25%), Agentic Push and Alerting (20%), Setup and Usability (15%), and Verified User Reviews (10%). Star bands run from one star at 0 to 20, up to five stars at 81 to 100. Luca AI earns five stars on the strength of root-cause depth and scheduled push reporting.
⚠️ Why most "best of" lists cannot be trusted
Most rankings in this category are written by vendors ranking themselves first. Others sort by affiliate payout and call it research. Neither tells you which tool answers your actual question.
So the rubric here is published in full. Re-weight it if your situation differs. That is the point of showing the math.
📊 The five criteria and why each weight exists
Scoring Criteria and Weights
Criterion
Weight
Why it carries this weight
Root-Cause and Predictive Depth
30%
Descriptive dashboards leave you asking "okay, but so what?" Prescription is the only output that changes a decision.
Ecommerce Data Coverage
25%
An agent that cannot join Shopify orders, ad spend, COGS, and 3PL costs will get margin questions wrong.
Agentic Push and Alerting
20%
The 2026 standard is a system that tells you what to do, does it, then notifies you only when something breaks.
Setup and Usability
15%
Tools requiring a warehouse build stall at brands with no data engineer.
Verified User Reviews
10%
Aggregate ratings from G2 and the Shopify App Store, checked August 2026.
Root cause got the heaviest weight on purpose. Tools that only monitor are capped at three stars here by design, which is the same standard we apply across ecommerce analytics platforms.
Peel Insights, Glew.io, Julius AI, Jungle Scout AI Assist
Luca AI holds the top band because it pushes customized periodic reports with graphs, reasoning, and recommendations into Slack and email without being asked. I weighted that behavior heavily because I watch operators skip dashboards they pay for, which is why automated data reporting scores so high here.
📝 What verified reviews actually showed
Review data moved several rankings, in both directions. Polar Analytics carries the strongest verified score in this list at 4.9 across 103 Shopify App Store reviews. Triple Whale sits at 4.5 across 481 G2 reviews, with attribution accuracy as the loudest complaint.
"Great tool to centralise your dispersed data! Brings everything from Shopify to Meta ads into one place. It has revolutionised how we report and helps uncover hidden trends in campaign performance and product performance." Susanne Kaufmann, Austria, Polar Analytics, Shopify App Store Verified Review
"The attribution system is consistently buggy and unreliable, causing more harm than good." Verified user, Triple Whale, G2 Verified Review
💰 Re-weight this rubric for your stage
Below $1M in revenue, drop Root-Cause Depth to 20% and raise Setup and Usability to 25%. You need something working this week, not a modeling project.
Above $10M with an analyst on staff, flip it. Coverage and governance matter more than ease, so ThoughtSpot and Tellius climb.
Luca AI scored highest on the two criteria that carry half the weight here, root cause and agentic push, and lowest on public review volume because the product is young. That trade-off is real, and worth knowing before you shortlist against the wider field of AI tools for Shopify owners.
Q3. What makes something an AI agent rather than a dashboard or a BI copilot? [toc=3. Agents vs Dashboards]
An AI agent for data analysis plans and runs multi-step analytical work on its own. It breaks down a business question, finds the relevant data, queries it, checks its own result, and explains what it found. A BI copilot only speeds up chart building. A chatbot on a CSV forgets your business the moment the session ends.
✅ The three tiers, named plainly
Tier one is a general model on an upload. You paste a file, it does math, it remembers nothing.
Tier two is a copilot inside a dashboard. It writes the query you would have written, faster.
Tier three is an agent. It decides which questions to ask next, then checks whether its own answer holds. That distinction sits at the heart of agentic AI for ecommerce founders.
⏰ One question, three very different answers
Take a real question. Why did MER drop last week? MER means marketing efficiency ratio, your total revenue divided by total ad spend.
Tier one tells you MER dropped, if you uploaded the right file. Tier two charts the drop by channel. Tier three traces it to a CPM increase on one campaign, a price test on your hero SKU, and a shipping promo that lifted orders but killed margin.
Luca AI holds persistent business memory, so it remembers last quarter's ROAS pattern and flags this week's deviation instead of starting from a blank canvas each session.
❌ Why dashboards keep failing operators
Here is the uncomfortable part. Dashboards did not fail because they were badly built. They failed because they answer "what happened" and then stop.
Somebody still has to notice the dip, hunt the cause, and decide. That somebody is usually you, on a Sunday night. One operator who scaled to £200 million in GMV described the early years as exports from Shopify and exports from the returns system, stitched by hand. That is the gap Shopify business intelligence is supposed to close.
⚠️ Growth is hiding your margin problem
The numbers make this urgent. Across the Common Thread Collective portfolio, median DTC revenue grew 15.2% in the first half of 2026, while median ad spend grew 28%.
That gap is a margin problem wearing a growth costume. A dashboard shows both lines and says nothing about which one is about to bankrupt you, which is why ecommerce profit margins deserve their own reporting layer.
📊 The autonomy ladder
The Autonomy Ladder for AI Agents
Tier
What it does
What you still do
Alerts
Tells you a metric crossed a threshold
Investigate, diagnose, decide, act
Recommends
Diagnoses the cause and proposes a move
Approve and execute
Acts
Executes inside connected systems
Review exceptions only
Most tools sold as agents in 2026 sit at the alert tier. A handful reach recommend. Very few act, and the ones that do usually gate it behind a premium add-on.
✅ How to test which tier you are being sold
Ask the vendor one question in the demo. "Show me the last five things this pushed to a customer without being asked."
If the answer is a threshold alert, you are buying tier one behavior at tier three pricing. If they show reasoning, not just a red number, keep them on the list.
I would also stop calling these chatbots. The framing invites the wrong expectation, and operators are already tired of it. Reasoning sentry is closer to what you are actually buying.
Luca AI scans store data around the clock and pings when ROAS dips, CAC spikes, or inventory falls below a set threshold, which is the recommend tier working in practice rather than in a demo script. Compare that behavior against standard ecommerce monitoring tools.
Q4. Which questions should an AI agent be able to answer about your store? [toc=4. The Operator Economics Test]
Run every vendor against five questions: why did MER move this week, what is my fully burdened contribution margin by SKU, what is blended CAC including operational costs, which SKUs will stock out before Q4, and which cohorts are about to churn. Tools that master one function will fail at least three. Luca AI answers all five by reasoning across marketing, finance, inventory, and customer data in one pass.
1. ⚠️ Why did MER move this week?
Data joins required: ad spend across every platform, total revenue, discounts, and returns.
Failure mode: the tool reports the move and stops, or blames the channel with the worst last-click number.
Pass threshold: it names at least two contributing drivers and quantifies each. Context matters here. Median Meta ROAS sits at 1.86, with CPM at $14.19, up 20.03%. A 10% MER slide can be entirely CPM inflation, not your creative, which is the core argument in declining platform ROAS versus true profitability.
2. 💸 What is my fully burdened contribution margin by SKU?
Data joins required: landed COGS, freight, duties, payment fees, pick and pack, returns, and SKU-level ad spend.
Failure mode: the tool shows gross margin and calls it profit.
Pass threshold: it produces a per-SKU number after all eight cost layers. Gross margin only tells you what it costs to make the thing. It says nothing about what it costs to sell the thing, a distinction we unpack in contribution margin versus gross margin.
❤️ The 20 minutes that changed a reorder decision
A supplements founder once slid an invoice across the table and told me her hero product ran at 72% gross margin. She had scaled it for two years on that belief.
We rebuilt it line by line. True contribution margin came in at 8%. She was crying inside 20 minutes, and she was right to.
3. 📊 What is blended CAC including operational costs?
Data joins required: ad spend, agency fees, creative costs, discount depth, and new customer counts.
Failure mode: the tool divides ad spend by new customers and calls it done.
Pass threshold: CAC treated as a variable cost with every acquisition dollar included. DTC CAC ranges from $5 to $15 on owned channels to roughly $120 on mega-influencer deals. Blending those without segmentation hides which channel is actually working, so start with tracking unit economics properly.
4. ⏰ Which SKUs will stock out before Q4?
Data joins required: sell-through velocity, current stock, lead times, and open purchase orders.
Failure mode: the tool reports today's inventory level with no forward projection.
Pass threshold: a reorder date per SKU, with a flag when cash timing conflicts with the order. This is where the money actually sits. One denim style can be a $6,000 commitment across a size run, and a bad call on it hurts for two quarters. That is the case for predictive analytics tools over static stock reports.
5. 😊 Which cohorts are about to churn?
Data joins required: order history by acquisition month, repeat purchase intervals, and product category mix.
Failure mode: the tool shows a churn percentage with no cohort structure underneath.
Pass threshold: it identifies which acquisition cohort is decaying and what changed for them, which is exactly what customer churn analysis is built to surface.
✅ Score it honestly
Grade each answer against a manual pull you build yourself. Below four out of five, keep looking. Most tools will pass one and fake two.
⚠️ One open question remains, and it is the one that sinks most evaluations. If your landed COGS, freight, and returns are not loaded anywhere, no agent on this list can answer question two. That gap is yours to close first, and ecommerce data collection is where it starts.
Luca AI traces a metric move back to the influencing components across functions, then simulates the outcome against your own history, which is what separates a reorder decision you can defend from a chart you cannot act on.
Q5. What data foundation does an AI agent need before it is worth buying? [toc=5. Data Foundation Prerequisites]
An agent is only as good as the joins beneath it. Before you buy, standardize SKU naming, agree on one definition of revenue and one of customer, load landed COGS including freight and duties, and fix your retail calendar. Tools that normalize on ingestion save you the cleanup year. Tools that assume a governed warehouse do not.
⚠️ Dirty joins produce confident nonsense
Here is the failure nobody demos. You ask a clean question, and the agent returns a clean answer that happens to be wrong.
It is wrong because "revenue" means gross in Shopify, net of refunds in your accounting tool, and something else again in your ad platform. The model does not know that. It just picks one, which is why ecommerce data integration comes before any agent decision.
✅ Do not build this yourself
The build-versus-buy question is already settled, and expensively. One founder in the health space put roughly $10 million into a proprietary system to turn data into meaning. Then commercial models arrived and did it ten times better.
That is not a knock on his team. It is a knock on the timing of anyone starting that project in 2026. Sean Frank of Ridge and Jason Panzer of HexClad reached the same conclusion on the record: a clean data foundation is a prerequisite, not a nice-to-have.
Luca AI normalizes and standardizes data on ingestion, so revenue means the same thing whether it arrives from Shopify, Stripe, or Xero.
📊 The five-item readiness checklist
Run these before any demo call.
SKU naming: one convention across Shopify, your 3PL, and your purchase orders. Variants included.
Revenue definition: pick gross or net, write it down, and apply it everywhere.
Customer definition: decide whether a guest checkout with the same email counts as returning.
Landed COGS: unit cost plus freight, duties, and inbound handling, loaded per SKU.
Retail calendar: fix whether you report on 4-5-4 retail weeks or calendar months. Mixing 554 and 332 patterns breaks every year-over-year comparison.
⏰ What to fix this week versus what to outsource
Items one, two, and three are yours. No tool can decide whether your guest checkouts are returning customers. That is a business judgment, and it takes an afternoon.
Item four is the one most stores skip, and it is the one that decides whether margin questions get real answers. Pull your last three inbound shipments and calculate true landed cost on your top ten SKUs. That is a Monday morning task, and it feeds directly into product data management.
Item five belongs to the ingestion layer if your tool handles it. Ask directly in the demo whether the platform supports a retail calendar. Many do not, and you will discover it during your first Q4 comparison.
💸 The honest test to run on any vendor
Ask them to connect your data and answer one question you already know the answer to. Not a demo dataset. Yours.
If the number comes back matching your manual pull, the joins work. If it comes back close but not equal, you have found your normalization gap before you signed anything. Vendors that lean on API integrations without normalization tend to fail this test.
I could be reading this too strongly, but my view is that ingestion quality now matters more than model quality. The models are all good enough. The joins are not.
Luca AI's unified data model gives revenue and customer one definition across every connected source, which means the first useful answer lands before a cleanup project would have started. That sequencing is the whole argument, and it is why ecommerce data management belongs inside the tool rather than beside it.
Q6. Which AI agent fits Shopify DTC, Amazon sellers, and mid-market brands? [toc=6. Choosing by Store Type]
Shopify DTC brands under $5M should shortlist Luca AI, Polar Analytics, and Peel Insights. Amazon and hybrid sellers need Jungle Scout AI Assist plus a marketplace-aware layer like Saras IQ. Mid-market brands with a warehouse can weigh Tellius or ThoughtSpot Spotter. Expect roughly $99 to $300 per month at store level, and $500 to $2,000 at mid-market.
📊 Routing by platform and stage
Which AI Agent Fits Your Store Type
Your situation
Shortlist these
Skip these
Shopify, under $1M
Polar Analytics, Peel Insights
Tellius, ThoughtSpot, Saras IQ
Shopify, $1M to $5M
Luca AI, Polar Analytics, Peel Insights
ThoughtSpot Spotter
Amazon-heavy or hybrid
Jungle Scout AI Assist, Saras IQ, Glew.io
Peel Insights
$10M+ with a data team
Tellius, ThoughtSpot Spotter, Saras IQ
Julius AI
😊 The sweater brand at $80K per month
Picture a woolen knitwear brand on Shopify, running Meta ads, with a small loyal Instagram following. No analyst. The founder does reporting on Sunday nights.
This store needs one thing: a system that joins ad spend to landed cost and flags the SKUs quietly losing money. Polar Analytics gets dashboards live fastest. Luca AI is a replacement for the junior ecommerce data analyst this brand cannot afford to hire yet, which is the same argument behind the best Shopify analytics apps.
⚠️ The Amazon FBA seller
Marketplace sellers get treated as an afterthought in most rankings, which is strange. Jungle Scout research found 48% of Amazon sellers have already used AI tools in operations.
Jungle Scout AI Assist handles research and catalog signals well. It sees Amazon only, and its ad analytics remain read-only. Pair it with something that pulls Seller Central into a joined view, or you will keep making margin decisions blind. That joined view is what an omnichannel analytics platform is built to deliver.
"Unfortunately, the data is not accurate and I launched a product based on it which failed given the low search volume and sales, not recommended" Irina Bianchi, Jungle Scout, Trustpilot Verified Review
⭐ The $20M omnichannel brand
This company already has a warehouse and an analyst. Its problem is not access, it is queue time. Every question waits three days.
ThoughtSpot Spotter and Tellius both solve that with governed self-service. ThoughtSpot starts around $25 per user per month on Essentials. Tellius reviewers describe pricing built for enterprises, not small teams.
💰 Pricing bands and the hidden costs
Pricing Bands and Cost Drivers
Tier
Monthly range
What drives the bill up
Store-level agents
$99 to $300
Order volume, connector count
Ecommerce intelligence
€299 to €499
Data sources, report cadence
Mid-market platforms
$500 to $2,000+
Seats, query credits, warehouse compute
Warehouse-native
Usage-based
A heavy query month can double it
Implementation time is the cost nobody quotes. Warehouse-native tools need weeks of modeling before the first answer, which is worth weighing when you plan your ecommerce tech stack.
💸 Set your ceiling before the first demo
Here is a rule worth writing down. Cap analytics spend at 2% of monthly ad spend, or the cost of one junior analyst day per month, whichever is lower.
At $50,000 in monthly ad spend, that is a $1,000 ceiling. That single number kills half your shortlist before you waste a call. Cost is the loudest real complaint operators raise.
"While tools like Triple Whale provide some solutions, their $129/month price tag is quite high for smaller businesses." u/Negative-Contest-592, r/ShopifyAppDev Reddit Thread
Luca AI fits SMB and mid-market operators, and is honestly the wrong buy for enterprises that already staff a data team, or for stores with too little history to reason against. Priced against the analyst role rather than a dashboard seat, that comparison is the one a CFO will actually run.
Q7. How do you pilot an AI agent in 30 days without losing a quarter? [toc=7. Piloting and Oversight]
Week one: connect Shopify, Meta, and one cost source, then time how long until the first trustworthy answer. Week two: run the five-question test set and grade accuracy against a manual pull. Week three: set three outlier alerts and count false positives. Week four: hand it to a non-technical teammate. Kill it below 80% accuracy.
⏰ Week one: connection and time to first answer
Connect three sources only. Shopify, your largest ad platform, and one cost source with landed COGS.
Start a timer. Log how many hours pass before you get one answer you would act on. Pass threshold: under 48 hours. Anything longer signals a modeling project in disguise.
✅ Week two: accuracy against your own math
Run the five operator questions from earlier in this article. Pull each answer manually in a spreadsheet first, then compare.
Grade it out of five. Pass threshold: four correct, with the margin question among them. Ask Luca AI, or whichever tool you are testing, to show the reasoning path rather than just the number.
⚠️ Week three: alerts and false positives
Set exactly three alerts. ROAS below your break-even point, inventory below a reorder threshold, and CAC above your ceiling.
Count how many fire without cause. Pass threshold: fewer than two false positives per week. Alert fatigue kills adoption faster than bad data does, so map your alerts to the KPIs that actually move money.
💰 Week four: the non-technical handoff
Give it to someone who did not run the pilot. A marketing coordinator, an ops assistant, anyone.
If they get a useful answer without your help, the tool works. If they need you to translate, you did not buy an agent. You bought a query interface with a friendly name.
❌ Where the pilot goes wrong
One premium bike brand let an AI workflow publish a homepage image unsupervised. The photo showed a $20,000 bike with the rear derailleur mounted on the front wheel.
The lesson is simple and worth repeating. Do not remove the QA, and do not let the AI be the QA.
"Communication is great in the beginning then to zero. The data is great, but Shopify's data is catching up to make Glew less valuable. Beware you will be auto renewed annually." Verified merchant, Glew.io, Shopify App Store Verified Review
📊 Automate versus gate
What to Automate and What to Gate
Automate freely
Keep a human gate
Monitoring and anomaly detection
Published creative and copy
Root cause investigation
Price changes
Forecasting and reporting
Campaign launches and budget shifts
Cohort and churn analysis
Reorder commitments above your cash buffer
The rule underneath the table: agents decide what to look at and what it means. You decide what ships. Reorder gates in particular should sit against a live cash flow forecast.
⭐ Check support before you commit
Read the three most recent one-star reviews of every shortlisted tool. Support quality shows up there, not in the sales deck.
"They gone through some turnover but the team at Peel now is great. They're very responsive and quick to help with any needs that I may have." Saltair, United States, Peel Insights, Shopify App Store Verified Review
Luca AI recommends, alerts, and reports rather than publishing anything customer-facing, which keeps human sign-off exactly where operators say it belongs.
What I am still sitting with is the next 18 months. My guess is that by 2027, your agent will negotiate ad rates with the platform's agent, and the human gate moves from execution to setting the constraints. I am not certain that is a good thing. If you are piloting something now, tell me where your gate sits, because I am collecting real answers on this. For the wider view of where this is heading, our take on how AI can actually help you run your ecommerce business covers the ground.
FAQ's
What is an AI agent for data analysis, and how is it different from a dashboard?
An AI agent for data analysis plans and runs multi-step analytical work on its own. It breaks a business question into parts, finds the relevant data, queries it, checks its own result, and explains what it found.
A dashboard answers what happened and stops there. Somebody still has to notice the dip, hunt the cause, and decide what to do. That somebody is usually the founder on a Sunday night.
The category splits into three tiers:
Tier one: a general model on an uploaded file. It does math and remembers nothing.
Tier two: a copilot inside a dashboard. It writes the query faster than you would.
Tier three: a real agent. It decides which question to ask next and validates its own answer.
Luca AI holds persistent business memory, so it remembers last quarter's ROAS pattern and flags this week's deviation instead of starting from a blank canvas each session. We built it that way because operators do not want another tab to open.
If you want the longer version of this argument, our breakdown of agentic AI for ecommerce founders walks through the autonomy ladder in detail.
Can AI agents analyze Shopify and Amazon data together?
Yes, but the constraint is rarely the model. It is whether your cost data is normalized before the agent touches it.
Agents connect to Shopify through the API or an app install, then join order data with ad spend, email, and marketplace data. The join breaks when definitions disagree. Revenue means gross in Shopify, net of refunds in your accounting tool, and something different again in Meta Ads Manager.
What to load before you expect useful answers:
Landed COGS per SKU, including freight, duties, and inbound handling
One agreed definition of revenue, applied everywhere
One definition of customer, including how guest checkouts count
A fixed retail calendar, so year-over-year comparisons hold
Marketplace sellers face an extra gap. Amazon-only tools read Seller Central well but leave your Shopify margin picture missing, which means blended decisions stay guesswork.
Luca AI normalizes and standardizes data on ingestion, so revenue means the same thing whether it arrives from Shopify, Stripe, or Xero. That sequencing removes the cleanup year most stores budget for.
Which questions should an AI agent be able to answer about our store?
Five questions separate a real agent from a demo-friendly one. Run every vendor against all five before you sign anything.
Why did MER move this week? It must name at least two drivers and quantify each, not blame the worst last-click channel.
What is fully burdened contribution margin by SKU? Gross margin is not profit. Eight cost layers sit between the supplier invoice and real money.
What is blended CAC including operational costs? Agency fees, creative, and discount depth all belong in the number.
Which SKUs stock out before Q4? A reorder date per SKU, flagged when cash timing conflicts.
Which cohorts are about to churn? A churn percentage without cohort structure is useless.
Grade each answer against a manual pull you build yourself. Below four out of five, keep looking.
Luca AI traces a metric move back to the influencing components across marketing, finance, inventory, and customer data, then simulates the outcome against your own history. That is the difference between a reorder decision you can defend and a chart you cannot act on.
What do AI agents for ecommerce data analysis cost in 2026?
Pricing splits into four bands, and the sticker price is rarely the real cost.
Store-level agents: roughly $99 to $300 per month, driven by order volume and connector count
Ecommerce intelligence platforms: around €299 to €499 per month, driven by data sources and report cadence
Mid-market platforms: $500 to $2,000 or more, driven by seats and query credits
Warehouse-native tools: usage-based, where one heavy query month can double the bill
Implementation time is the cost nobody quotes. Warehouse-native options need weeks of modeling before the first answer arrives.
Set a ceiling before the first demo. Cap analytics spend at 2% of monthly ad spend, or one junior analyst day per month, whichever is lower. At $50,000 in monthly ad spend, that is a $1,000 ceiling, and it kills half your shortlist before you waste a call.
Luca AI is priced against the junior ecommerce data analyst it replaces rather than against a dashboard seat, which is the comparison a CFO will actually run. Our full pricing tiers are published rather than quote-gated.
How do we pilot an AI analytics agent in 30 days without wasting a quarter?
Run a four-week pilot with pass thresholds written down before you start, plus a kill criterion you will actually honor.
Week one: connect Shopify, your largest ad platform, and one cost source. Time how long until the first answer you would act on. Pass under 48 hours.
Week two: run the five-question test set and grade against a manual spreadsheet pull. Pass at four out of five, with the margin question included.
Week three: set three alerts on ROAS, inventory, and CAC. Pass at fewer than two false positives per week.
Week four: hand it to a non-technical teammate. If they need you to translate, you bought a query interface, not an agent.
Keep humans gated on anything customer-facing: published creative, price changes, campaign launches, and reorder commitments above your cash buffer. Automate monitoring, root cause work, forecasting, and cohort analysis freely.
Luca AI recommends, alerts, and reports rather than publishing anything customer-facing, which keeps sign-off exactly where operators say it belongs. If you are running a pilot now, tell us where your gate sits, because we are collecting real answers on this.
Enjoyed the read? Join our team for a quick 15-minute chat — no pitch, just a real conversation on how we’re rethinking Ecommerce with AI - Luca
Loading Schedule...
Your AI Co-Founder is here.
Here’s why:
Shopify, Meta, Xero - one brain.
"Should I scale?" Answered with real data.
Growth capital. No applications. One click.
Thank you! Your submission has been received! Please book a time slot for the Meeting
Oops! Something went wrong while submitting the form.