.svg)
.svg)


Q1. What is Shopify business intelligence, really? [toc=1. What Is Shopify BI]
Shopify business intelligence is the practice of unifying your store, ad, and finance data into one trustworthy view, then turning it into decisions and action. It goes beyond native Shopify Analytics and ShopifyQL reporting, which mostly show what already happened. It adds cross-functional reasoning that connects margin, inventory, and cash. The goal is not more charts. It is faster, clearer decisions.
🧭 The word "intelligence" is doing a lot of work here
Most founders I talk to use "BI" to mean "more dashboards." That read gets it backwards. A dashboard shows you a number. Intelligence tells you what the number means and what to do next.
Here is the line I keep coming back to. Data is great, but it does nothing until you turn it into insight, and insight into execution. A revenue chart that drops on a Tuesday is just a fact. Knowing that returns from one SKU caused the drop is intelligence.
🔥 Why most stores feel like they are drinking from a fire hydrant
By the time you run Shopify, Meta, Google, and email, you have more data than any human can read. Operators describe it as drinking from a fire hydrant. You are soaked, but not informed.
The trap is staring at one chart at a time. It is like looking at a Van Gogh through a magnifying glass fixed on one square inch. You see the brushstroke. You miss the painting. You miss the synchronicities between channels that actually explain your numbers. This is exactly the problem we unpack in our breakdown of why e-commerce founders are drowning in data.
⚖️ Reporting versus reasoning, in one example
Say your blended ROAS (total revenue divided by total ad spend) dips 12% in a week. Native Shopify reporting shows you the dip. That is the speedometer. It tells you how fast you are going.
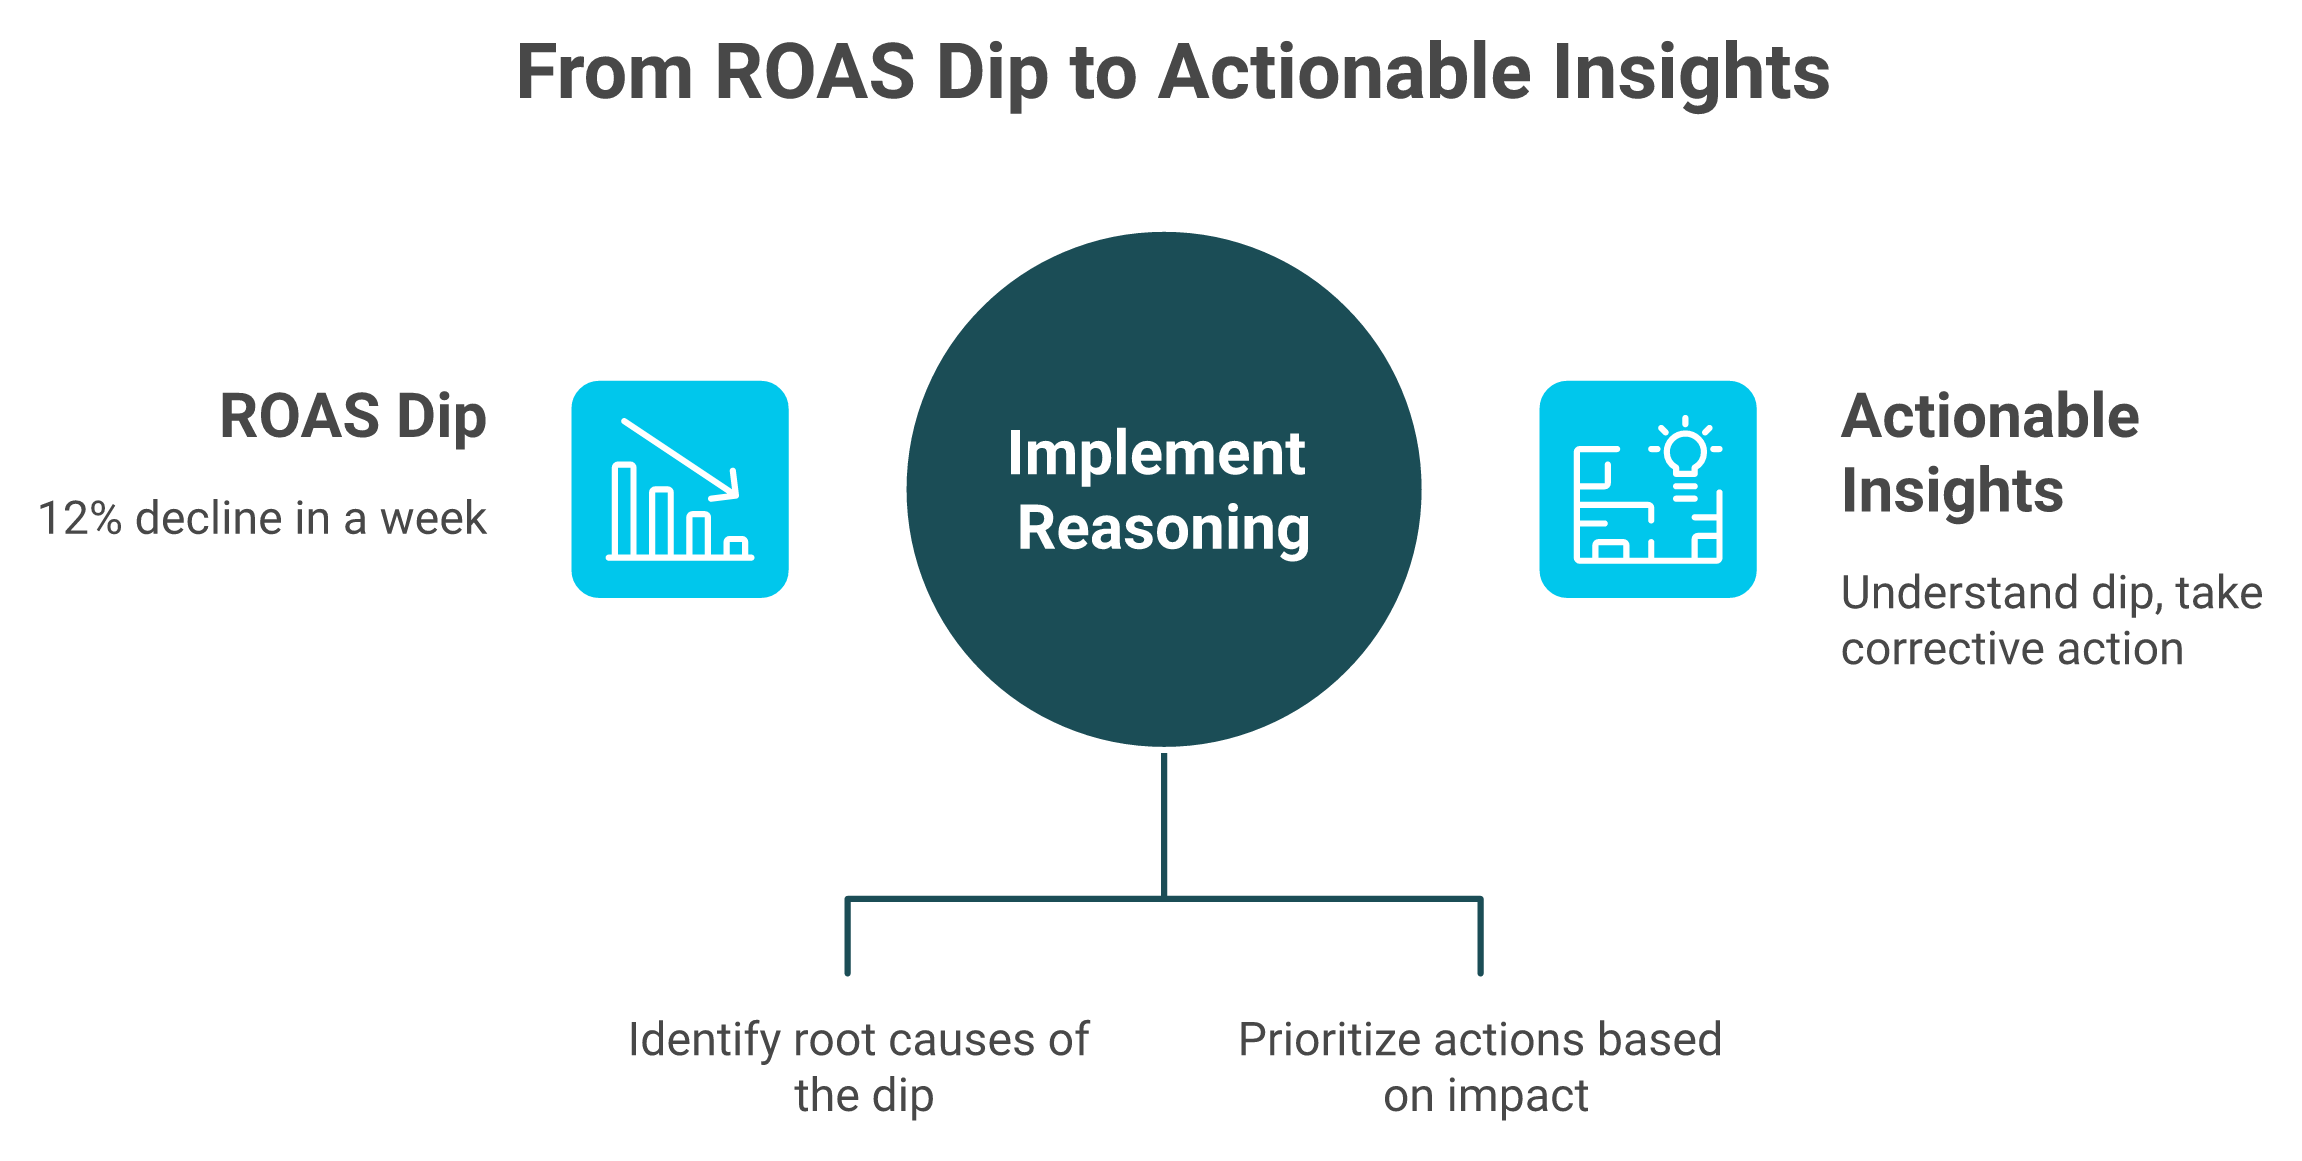
Reasoning tells you the road ahead. It connects the dip to a price test on your hero product, a shipping delay, and a returns spike, then ranks which one to fix first. This is the layer Luca AI was built for. Luca is an AI layer over a data warehouse (a single store for all your data) that reasons across your sources instead of just displaying them. I might be biased, but after looking at thousands of Shopify P&Ls, the stores that win are the ones that close this gap early.
Q2. What can native Shopify Analytics do, and where does it honestly fall short? [toc=2. Native Analytics & Limits]
Native Shopify Analytics gives you 60+ prebuilt reports, real-time dashboards, and ShopifyQL for custom queries. It is strong for store-level sales, sessions, and product performance. It falls short on multi-step funnels, blended Meta and Google attribution, and true contribution margin. The common workarounds are GA4 for behavior and a connector-fed dashboard for blended spend, until manual reconciliation stops scaling.
✅ What native Shopify reporting does genuinely well
Credit where it is due. Shopify ships more than 60 commerce-specific reports, real-time dashboards, and customizable metric cards out of the box. For a single-channel store under roughly $1M, that is often enough. Our Shopify analytics dashboard explainer walks through what each of those reports actually shows.
ShopifyQL, Shopify's query language, lets you pull custom cuts without a third-party tool. You can answer "top products by margin last 30 days" without leaving the admin. For many founders, that covers the Monday review.
⚠️ Where it stops scaling
The ceiling shows up fast once you spend on ads. Three gaps come up again and again with the operators I work with.
The structural issue is not a Shopify failure. Native tools see vertically, deep into store data. They do not see horizontally across ads, finance, and inventory. That horizontal view is where profit hides, and it is the core of the marketing analysis and automation work we focus on.
🧾 The receipt: the Monday morning shudder
This gap has a felt cost. Operators describe the early days as Excel-based, with most of the week tied up exporting from Shopify and the returns system just to report. One operator running a large multi-brand business called it the Monday morning shudder.
Founders also distrust the surface numbers. After Shopify reworked its reports, merchants posted real friction.
"What happened to Shopify Analytics & Reports? The new interface is missing reports I used every week."
r/shopify Reddit Thread
Here is my contrarian add. Most founders make decisions on gross margin, and gross margin is a lie. It tells you what it costs to make the thing. It tells you nothing about what it costs to sell the thing. Native reporting rarely closes that gap on its own.
Q3. Which 11 Shopify business intelligence tools actually matter in 2026? [toc=3. The 11 BI Tools]
The 11 tools that matter fall into five buckets: an AI reasoning layer (Luca AI), native tools (Shopify Analytics, ShopifyQL, Sidekick), free behavioral tools (GA4, Microsoft Clarity), dashboarding (Looker Studio, Power BI), and DTC analytics (Triple Whale, Polar, Northbeam). The right stack depends on your channel count and margin complexity, not the longest feature list.
🤖 AI reasoning layer
1.1 Luca AI. Best at turning scattered data into decisions. Luca is an AI layer over a data warehouse that extracts the data relevant to a situation, predicts on your history, simulates scenarios, and finds root causes and influencing components, all in plain English. The catch: it is built for stores past the hobby stage, not sub-$10K MRR or marketplace-only sellers. Fits founders tired of triangulating five tabs by hand. If you are comparing options, our roundup of the best e-commerce analytics tools that fund your campaigns covers the trade-offs.
🏪 Native tools
1.2 Shopify Analytics. Best at store-level sales and sessions. The catch: thin on blended attribution and margin. Fits single-channel stores.
1.3 ShopifyQL. Best at custom queries inside the admin. The catch: you need to learn query syntax. Fits analytical founders.
1.4 Shopify Sidekick. Best at quick admin help. The catch: operators report it overpromises.
"We had something that said your sales are down this week and when I clicked it, it said you had no sales at all last week, which was incorrect. More useless junk on my dashboard."
u/ntn63rj, r/shopify Reddit Thread
📊 Free behavioral tools
1.5 GA4. Best at free behavioral and funnel tracking. The catch: sampling and modeling erode trust at scale. Fits budget-conscious stores that accept the learning curve.
"It is becoming very opaque, it doesn't have real-time, the sampling is increasingly wild. To make decisions based on grounded data, it is really difficult to trust it 100%."
Verified User in Retail Google Analytics G2 Verified Review
1.6 Microsoft Clarity. Best at free heatmaps and session replays. The catch: behavior only, no revenue math. Fits CRO work.
📈 Dashboarding
1.7 Looker Studio. Best at free custom dashboards. The catch: you build and maintain it yourself. Fits operators who like blending data.
1.8 Power BI. Best at deep enterprise reporting. The catch: operators feel it has fallen behind on how AI-ready it is. Fits data teams.
🛒 DTC analytics
1.9 Triple Whale. Best at marketing attribution dashboards. The catch: persistent integration and contract complaints. We compare it directly in our Triple Whale alternatives guide.
"Broken integrations, fake attribution for external marketplaces. Daily revenue totals are wrong, entire order blocks are missing. If you're a serious seller, avoid Triple Whale."
XTRA FUEL Triple Whale Trustpilot Verified Review
1.10 Polar Analytics. Best at no-code DTC dashboards. The catch: pricing climbs with connectors. Fits multi-channel mid-market.
1.11 Northbeam. Best at media-mix attribution. The catch: expensive and built for higher spend. Fits brands running heavy paid budgets.
One honest note: most of these tools bolted AI on later. A high-growth operator told me their inventory system added its own AI forecasting and it was rubbish, so they stopped using it. The difference with Luca AI is that reasoning is the foundation, not a feature added on top.
Q4. Why do your analytics tools keep showing you the wrong numbers? [toc=4. Why Numbers Disagree]
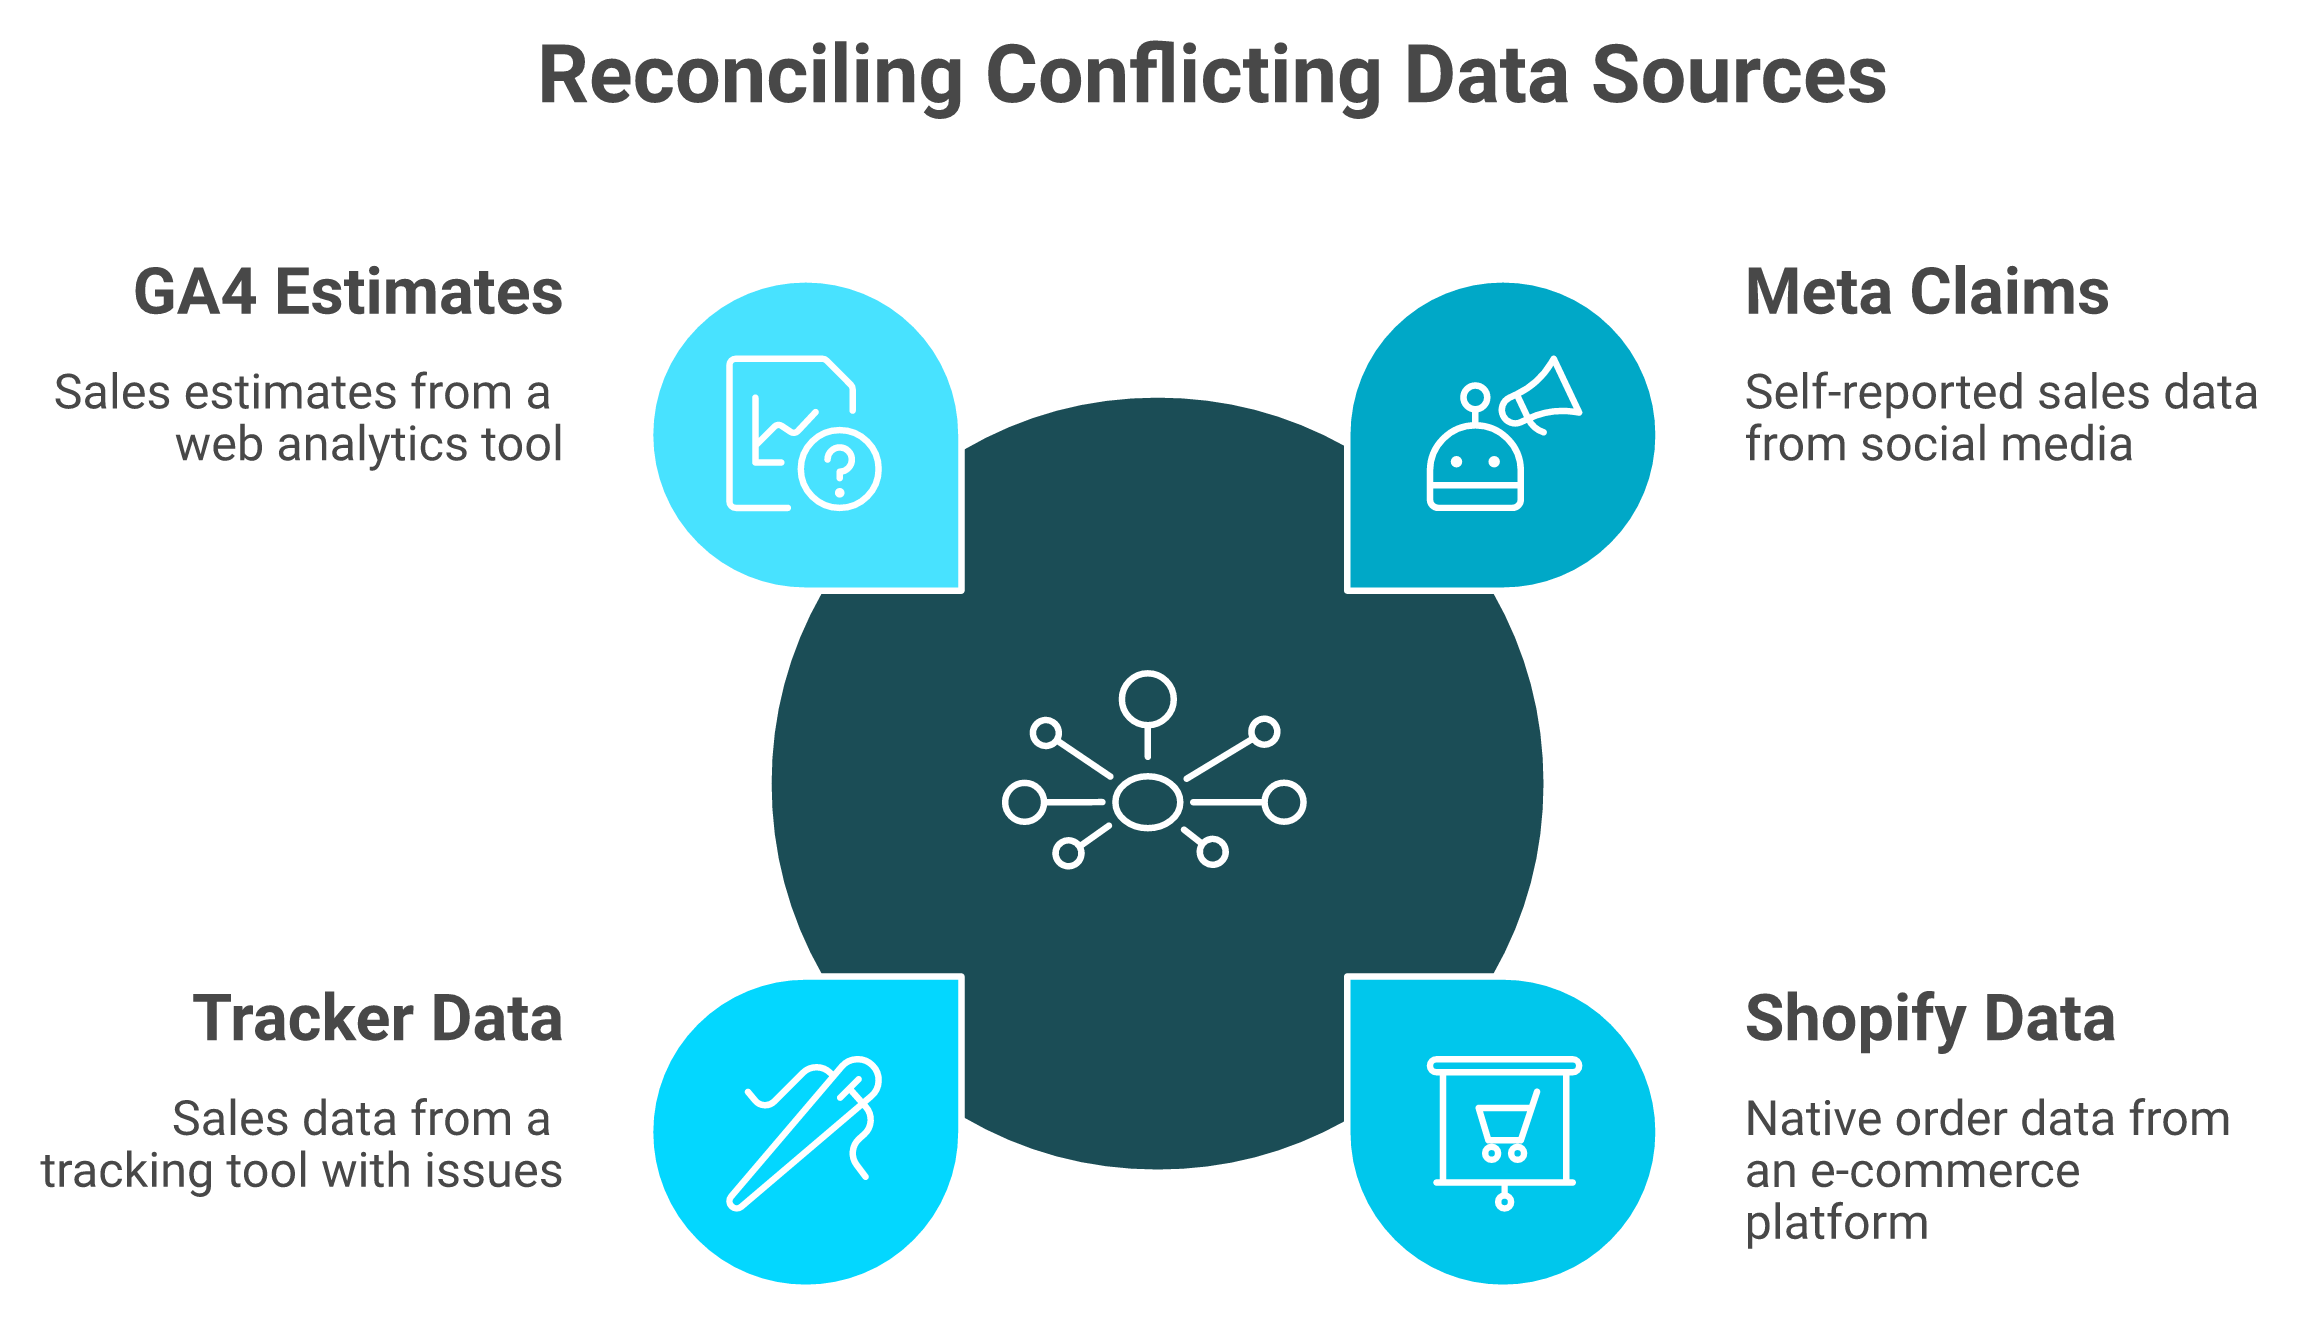
Analytics tools disagree because each one measures differently. GA4 samples and models data. Ad platforms self-report their own conversions. Third-party trackers stitch sources together imperfectly. The result is three revenue numbers and zero trust. The durable fix is a single reasoning layer over one data warehouse that reconciles the sources and finds the root cause, instead of leaving you to audit spreadsheets at midnight.
🧮 The popular belief: more tools means more clarity
The standard playbook says add another tracker and the picture sharpens. From what surfaces when you actually run a store, the opposite happens. Each new tool adds another version of the truth.
You end up with Meta claiming 40 sales, Shopify showing 31, and your tracker insisting on 35. Now you are not running the store. You are refereeing your own dashboards. We dig into this exact tension in declining platform ROAS vs true profitability.
❌ Why the numbers actually diverge
Three mechanics cause most of the chaos, and none of them are your fault.
- Sampling and modeling. GA4 estimates once data volume climbs, so sessions stop matching events.
- Self-reported attribution. Each ad platform takes credit for the same sale, so totals overlap.
- Broken stitching. Third-party trackers misfire, and the errors persist for months.
The receipts are brutal and specific.
"The integrations are inconsistent, building with the AI tool Moby is very buggy and crashes more than half the time. It has been unable to deliver accurate data, and we end up reverting back to Meta, Shopify, Recharge."
Matt Huttner Triple Whale Trustpilot Verified Review
"Increasingly more modeled and less performance and fidelity. Sessions do not match the session_start event. It complicates decision-making."
Verified User in Retail Google Analytics G2 Verified Review
✅ The better read: reconcile, don't re-stitch
Here is the part the category avoids saying. The fix is not a prettier dashboard. It is not cohort-level vigilance that costs you three hours of chart-staring every week.
The real magic is cohort-level vigilance without the cohort-level dashboard. A system that scans the data and pings you only when ROAS dips or inventory crosses a threshold. This is where Luca AI fits, sitting as a single reasoning layer for data analysis and deep industry research. It reasons over one warehouse to extract the data relevant to the moment, finds the root cause, and surfaces the influencing components, rather than adding a fourth conflicting tracker to your pile.
I could be off on the exact timing, but my read right now is that the "stack more trackers" era is ending. The economics already point there. Ari Tulla of ELO Health spent roughly $10 million building a proprietary data system, then watched LLMs arrive that were ten times better than what that money bought.
Q5. How do you build a Shopify BI data pipeline and dashboard? [toc=5. Build the Pipeline]
Build the pipeline in clear layers. Pull Shopify, Meta, and GA4 into a warehouse or Google Sheets through connectors, model the data, then visualize it in Looker Studio. Define four KPIs: blended CAC, contribution margin per order, cohort LTV, and retention. Automate threshold alerts, and validate each insight with a cheap smoke test before you scale spend.
🗺️ The architecture, in plain layers
Think of the pipeline as four stops, left to right. Each stop has a job, and skipping one is where most stacks break.
- Sources. Shopify, Meta Ads, Google Ads, and GA4 (your behavior data).
- Connector. A tool like Coupler.io pipes those sources out automatically.
- Storage. A warehouse (like BigQuery) or a Google Sheet holds the blended data.
- Visualization. Looker Studio turns it into a dashboard you actually read.
Operators confirm this is the real-world path, not a textbook one. If you are mapping your own setup, our guide to the e-commerce tech stack covers each layer in depth.
"For data blending (FB ads, Google, GSC) I use Looker Studio with Coupler.io. I personally think Looker is easier to use and customize than Power BI."
u/advanced_analytics, r/shopify Reddit Thread
🔧 The five setup steps
Here is the build order I give founders. By the end, you have one dashboard you trust.
- Connect your sources. Authorize Shopify, Meta, Google, and your finance tool into the connector.
- Pick four KPIs. Blended CAC, contribution margin per order, cohort LTV, and retention. No vanity metrics.
- Blend and model. Land everything in the warehouse or Sheet, then map fields so revenue means one thing.
- Automate alerts. Set thresholds so you get pinged when ROAS dips or inventory runs low.
- Validate cheaply. Run a smoke test before scaling.
⏰ The smoke test guardrail (and the 90-second leap)
The step founders skip is validation. You have to prove an insight in the cheapest way possible before you scale it. It is one of the simplest, most overlooked systems you will ever run on a Shopify brand.
Say the dashboard suggests your ret, cream cohort is your best repeat buyer. Do not pour $20K into it yet. Run a small, cheap test first, then scale what holds.
The payoff for building this once is speed. Manual data manipulation that you would think takes two weeks gets done in about 90 seconds when the pipeline is set. I have watched founders use that speed for physical decisions too, like loading a year of sales data and letting it decide which products go on the first shelf, at hip height, and at head height. We cover this further in our look at the best Shopify analytics apps.
💸 Where this gets expensive (and how Luca changes the math)
Here is the honest trade-off. The manual stack is cheap in dollars but expensive in your hours. You become the connector, the analyst, and the alert system.
This is where Luca AI fits. We sit as the AI layer on top of the warehouse and collapse the connect, model, and visualize steps into plain English. You ask a question, you get the reasoning, not a blank Looker canvas. It is the same logic behind our data analysis and deep industry research work.
Luca also runs the alert layer for you. In agentic mode, it scans your data 24/7 and pushes customized reports to Slack or email when CAC spikes or inventory falls below your threshold. I will be straight, though. If you are under $10K MRR and single-channel, the manual Sheet is probably enough for now. Build the habit before you buy the layer.
Q6. Which metrics and formulas separate vanity numbers from real profit? [toc=6. Metrics That Matter]
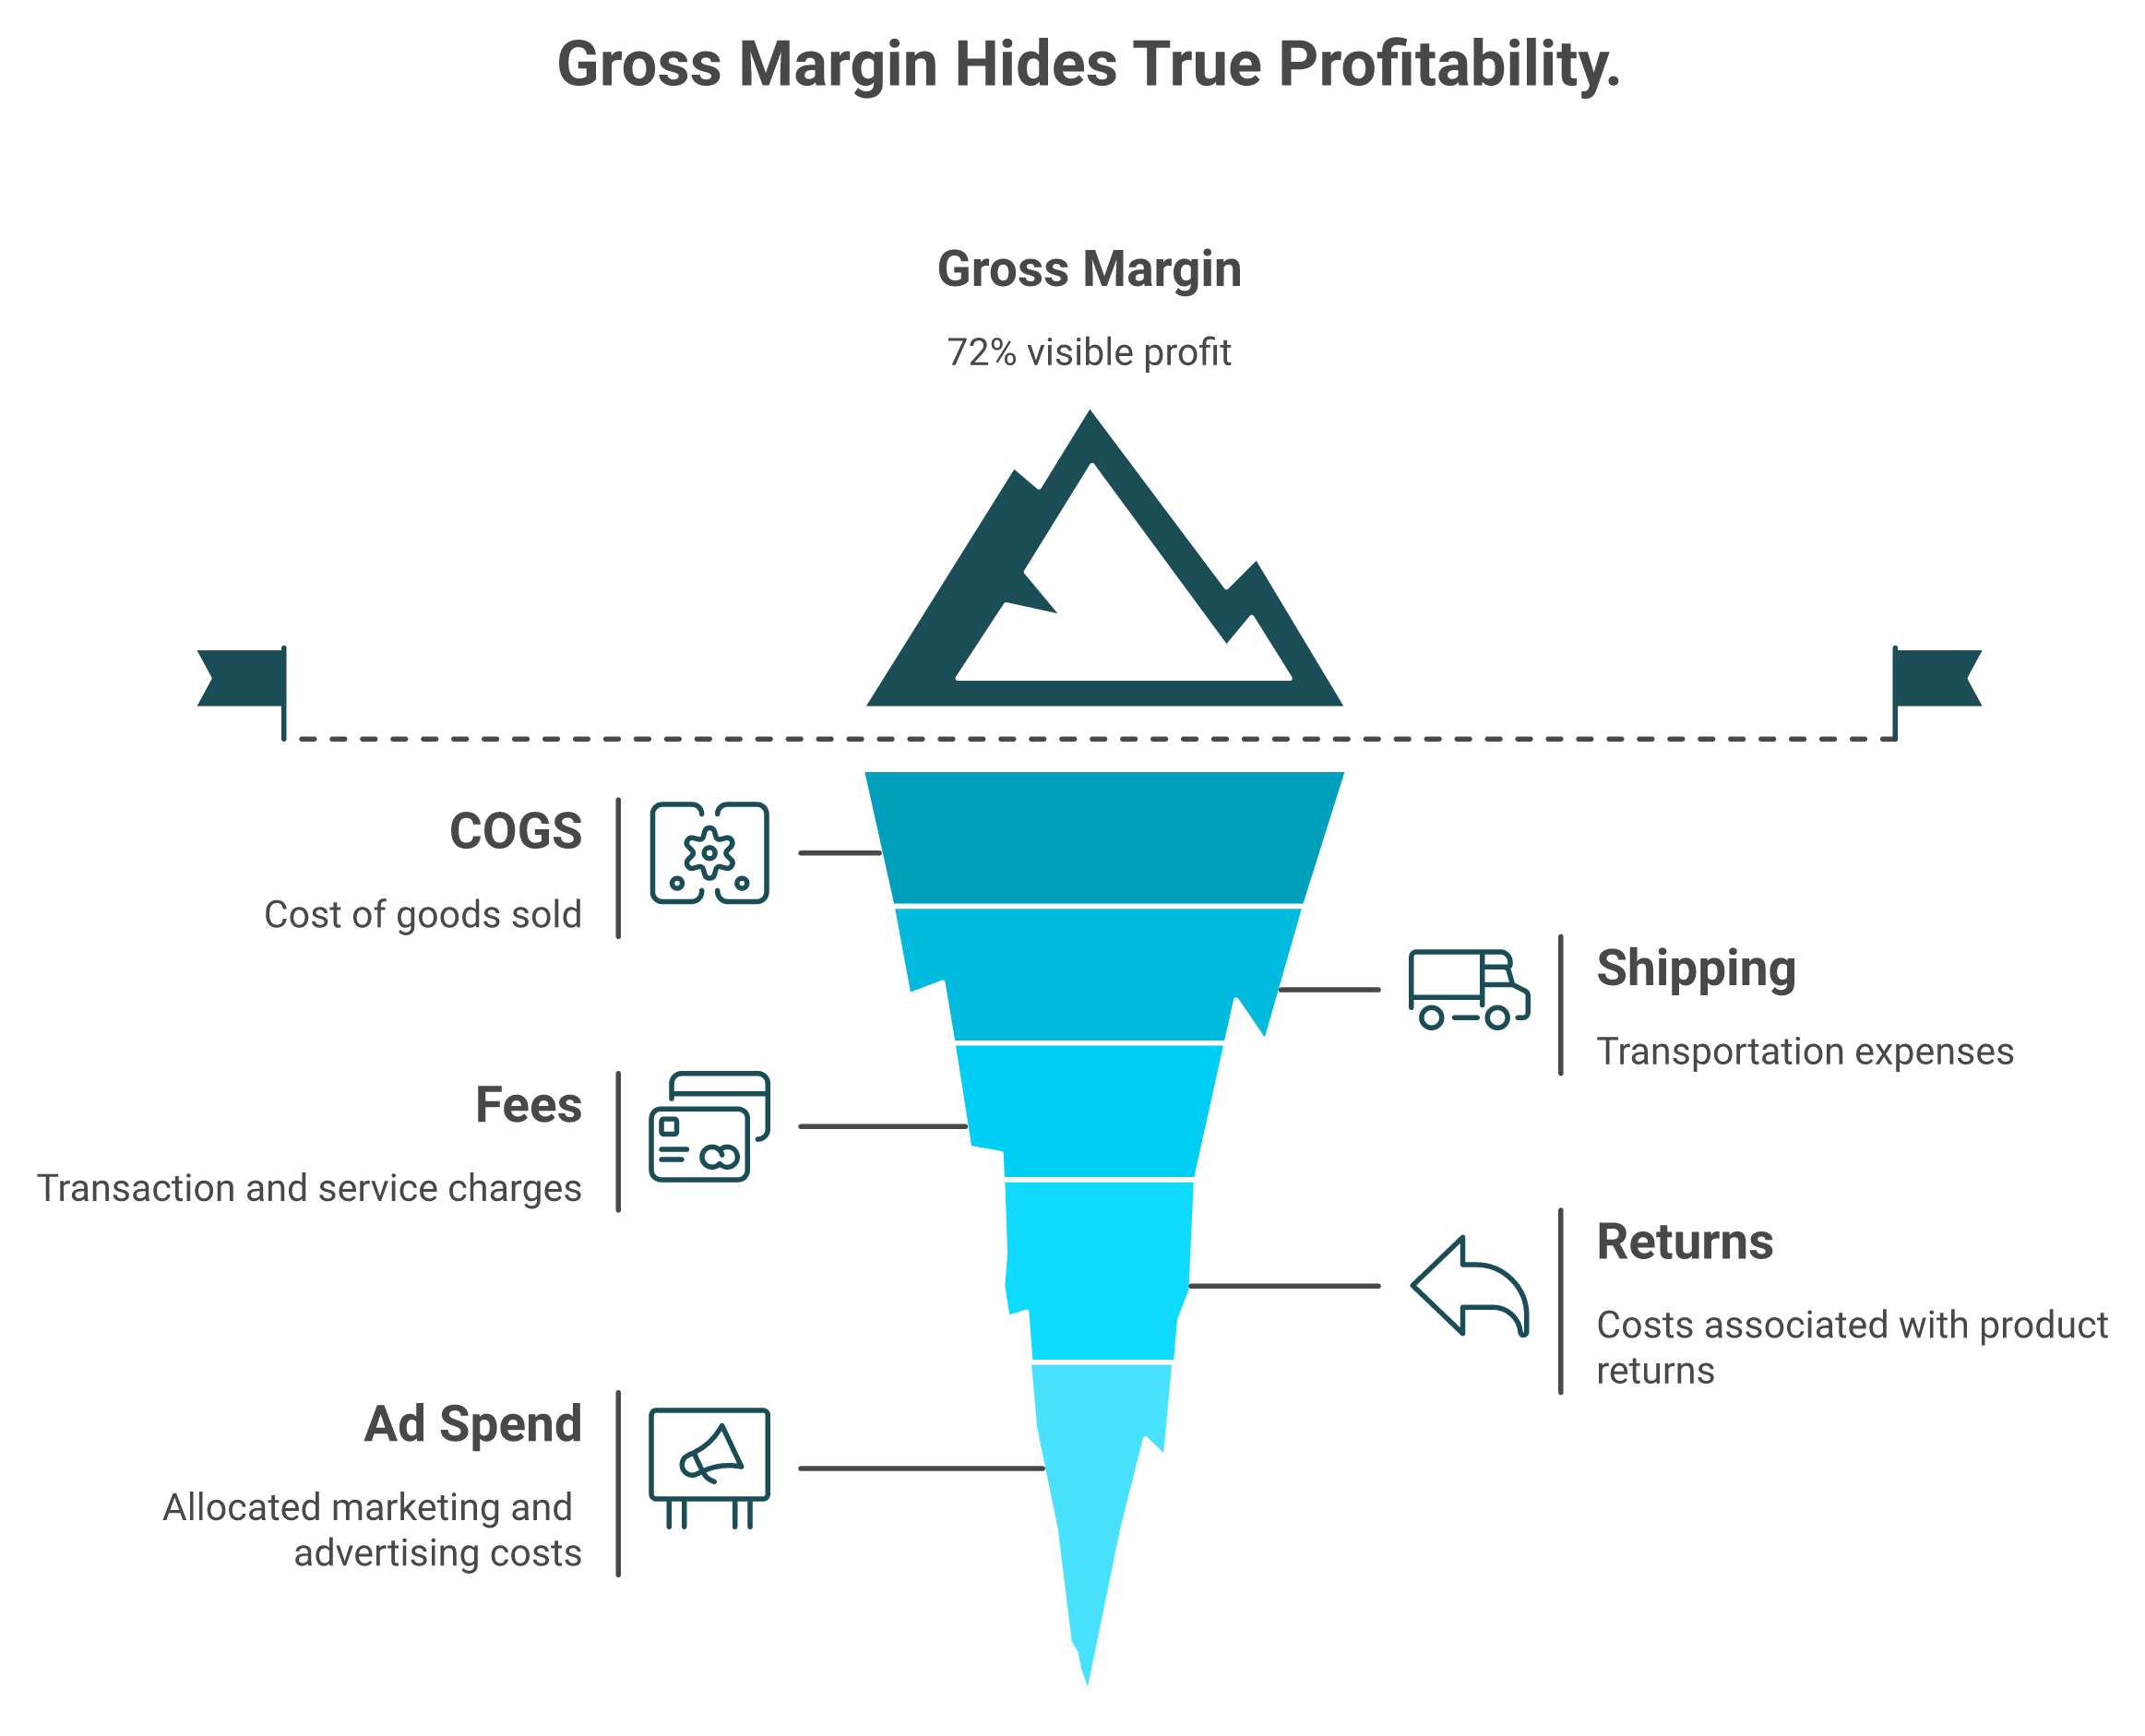
Track contribution margin per order (revenue minus COGS, shipping, fees, returns, and allocated ad spend), blended CAC, LTV:CAC, cohort retention, and RFM segments. Gross margin is the trap. A 72% gross-margin "best seller" can hide an 8% contribution margin once you allocate true selling and service costs down to the SKU.
📐 The five numbers that actually matter
Vanity metrics feel good and pay nothing. Revenue and gross margin top that list. The numbers below tell you if the business is real. Our deep dive on the best way to track e-commerce unit economics shows how to wire these into a live view.
Define each one inline the first time your team sees it. Most adoption problems start with a metric nobody can define.
🧾 The invoice that made a founder cry
Here is the story I think about most. A founder slid an invoice across the table and said, "This is our best seller, 72% gross margin." On paper, a winner.
Then the contribution margin got calculated line by line. After COGS, shipping, returns, and the ad spend it took to sell it, the real number was 8%. She had scaled a money-pit for two years and did not know it.
⚠️ Why gross margin lies to you
The standard read gets this backwards. Most founders decide on gross margin, and gross margin only tells you what it costs to make the thing. It says nothing about what it costs to sell the thing.
The fix is allocating overhead down to the SKU. One operator traced a single knife set to about $13,000 a year in customer service costs. That is $1.45 per unit, quietly eating the margin nobody had assigned.
🤖 Doing this without a finance team
I will be honest about the catch here. This SKU-level math is tedious, and most founders never finish it by hand. That is exactly why the money-pit runs for years.
This is where Luca AI earns its keep on the analytics side. We reason over your warehouse and pull COGS, shipping, and ad spend together to compute contribution margin down to the SKU. You can also ask it to simulate the margin impact of a price change before you make it. Think of it as a junior data analyst that already knows how these metrics relate, working without the salary or the two-week turnaround. That same reasoning powers our financial management use case.
Q7. What is an "AI Co-Founder" and how is it different from a dashboard? [toc=7. The AI Co-Founder]
An AI Co-Founder is a reasoning layer over your data warehouse that proactively surfaces what changed, predicts on historical data, simulates scenarios, and finds root causes, then pushes the answer to you in Slack or email. Unlike a dashboard, it does not wait for you to ask the right question. Unlike a generic chatbot, it reasons in your business context.
🪞 Why dashboards plateaued
Here is a question the category avoids. If dashboards solved business intelligence, why do founders still spend Mondays staring at charts and guessing?
A dashboard is a rear-view mirror. It shows you what happened, beautifully, then waits for you to interpret it. The work of connecting the dots stays on your desk. We explore this shift in detail in what is an AI Co-Founder for e-commerce.
🧠 Raw AI is not the answer either
More AI is not automatically the fix. One founder gave an AI terminal access to his data and got back 20 executive summaries, each 25 pages long. His honest reaction was, "Okay, how do I actually use this?"
That is the gap. Raw reasoning power without applied business context just makes prettier noise. The standard "add AI" pitch misses this entirely.
⚙️ What the Co-Founder model actually does
An AI Co-Founder closes that gap by reasoning horizontally across marketing, finance, and operations at once. It does four things a dashboard cannot.
- Predicts on your historical patterns, not generic benchmarks.
- Simulates scenarios, so you test a decision before you fund it.
- Root-causes outliers by checking the metrics that influence them.
- Pushes the finding to you, instead of waiting in a tab.
This is the core of Luca AI. Most analytics tools added AI as a feature later. Luca is AI at the foundation, trained on how e-commerce metrics relate, so it behaves like a junior analyst who never sleeps. You can see the broader thesis in agentic AI for e-commerce founders.
🔔 Proactive beats passive
Here is the twist that matters for your week. The value is not in looking at data more often. It is in being told only when something needs you.
Luca scans your data 24/7 and pings you when ROAS dips, CAC spikes, or inventory crosses a threshold. You get cohort-level vigilance without building the cohort-level dashboard. I could be early on this call, but my read is that the next 18 months belong to proactive systems, not passive screens. The founders who professionalize toward specialists, and away from doing every report by hand, will move faster than the ones still refreshing tabs.
Q8. When should you upgrade your BI stack (and when not)? [toc=8. When to Upgrade]
Stay on native Shopify Analytics plus GA4 until you cross roughly $1M or add a second paid channel. Add a Looker Studio blend next, consider a DTC analytics tool past three channels, and move to an AI reasoning layer when manual reconciliation eats your Mondays. Upgrading earlier wastes money on tools you will not fully use.
🪜 The staged upgrade path
There is no universal "best stack." There is only the right stack for your stage. Here is the ladder I walk founders up.
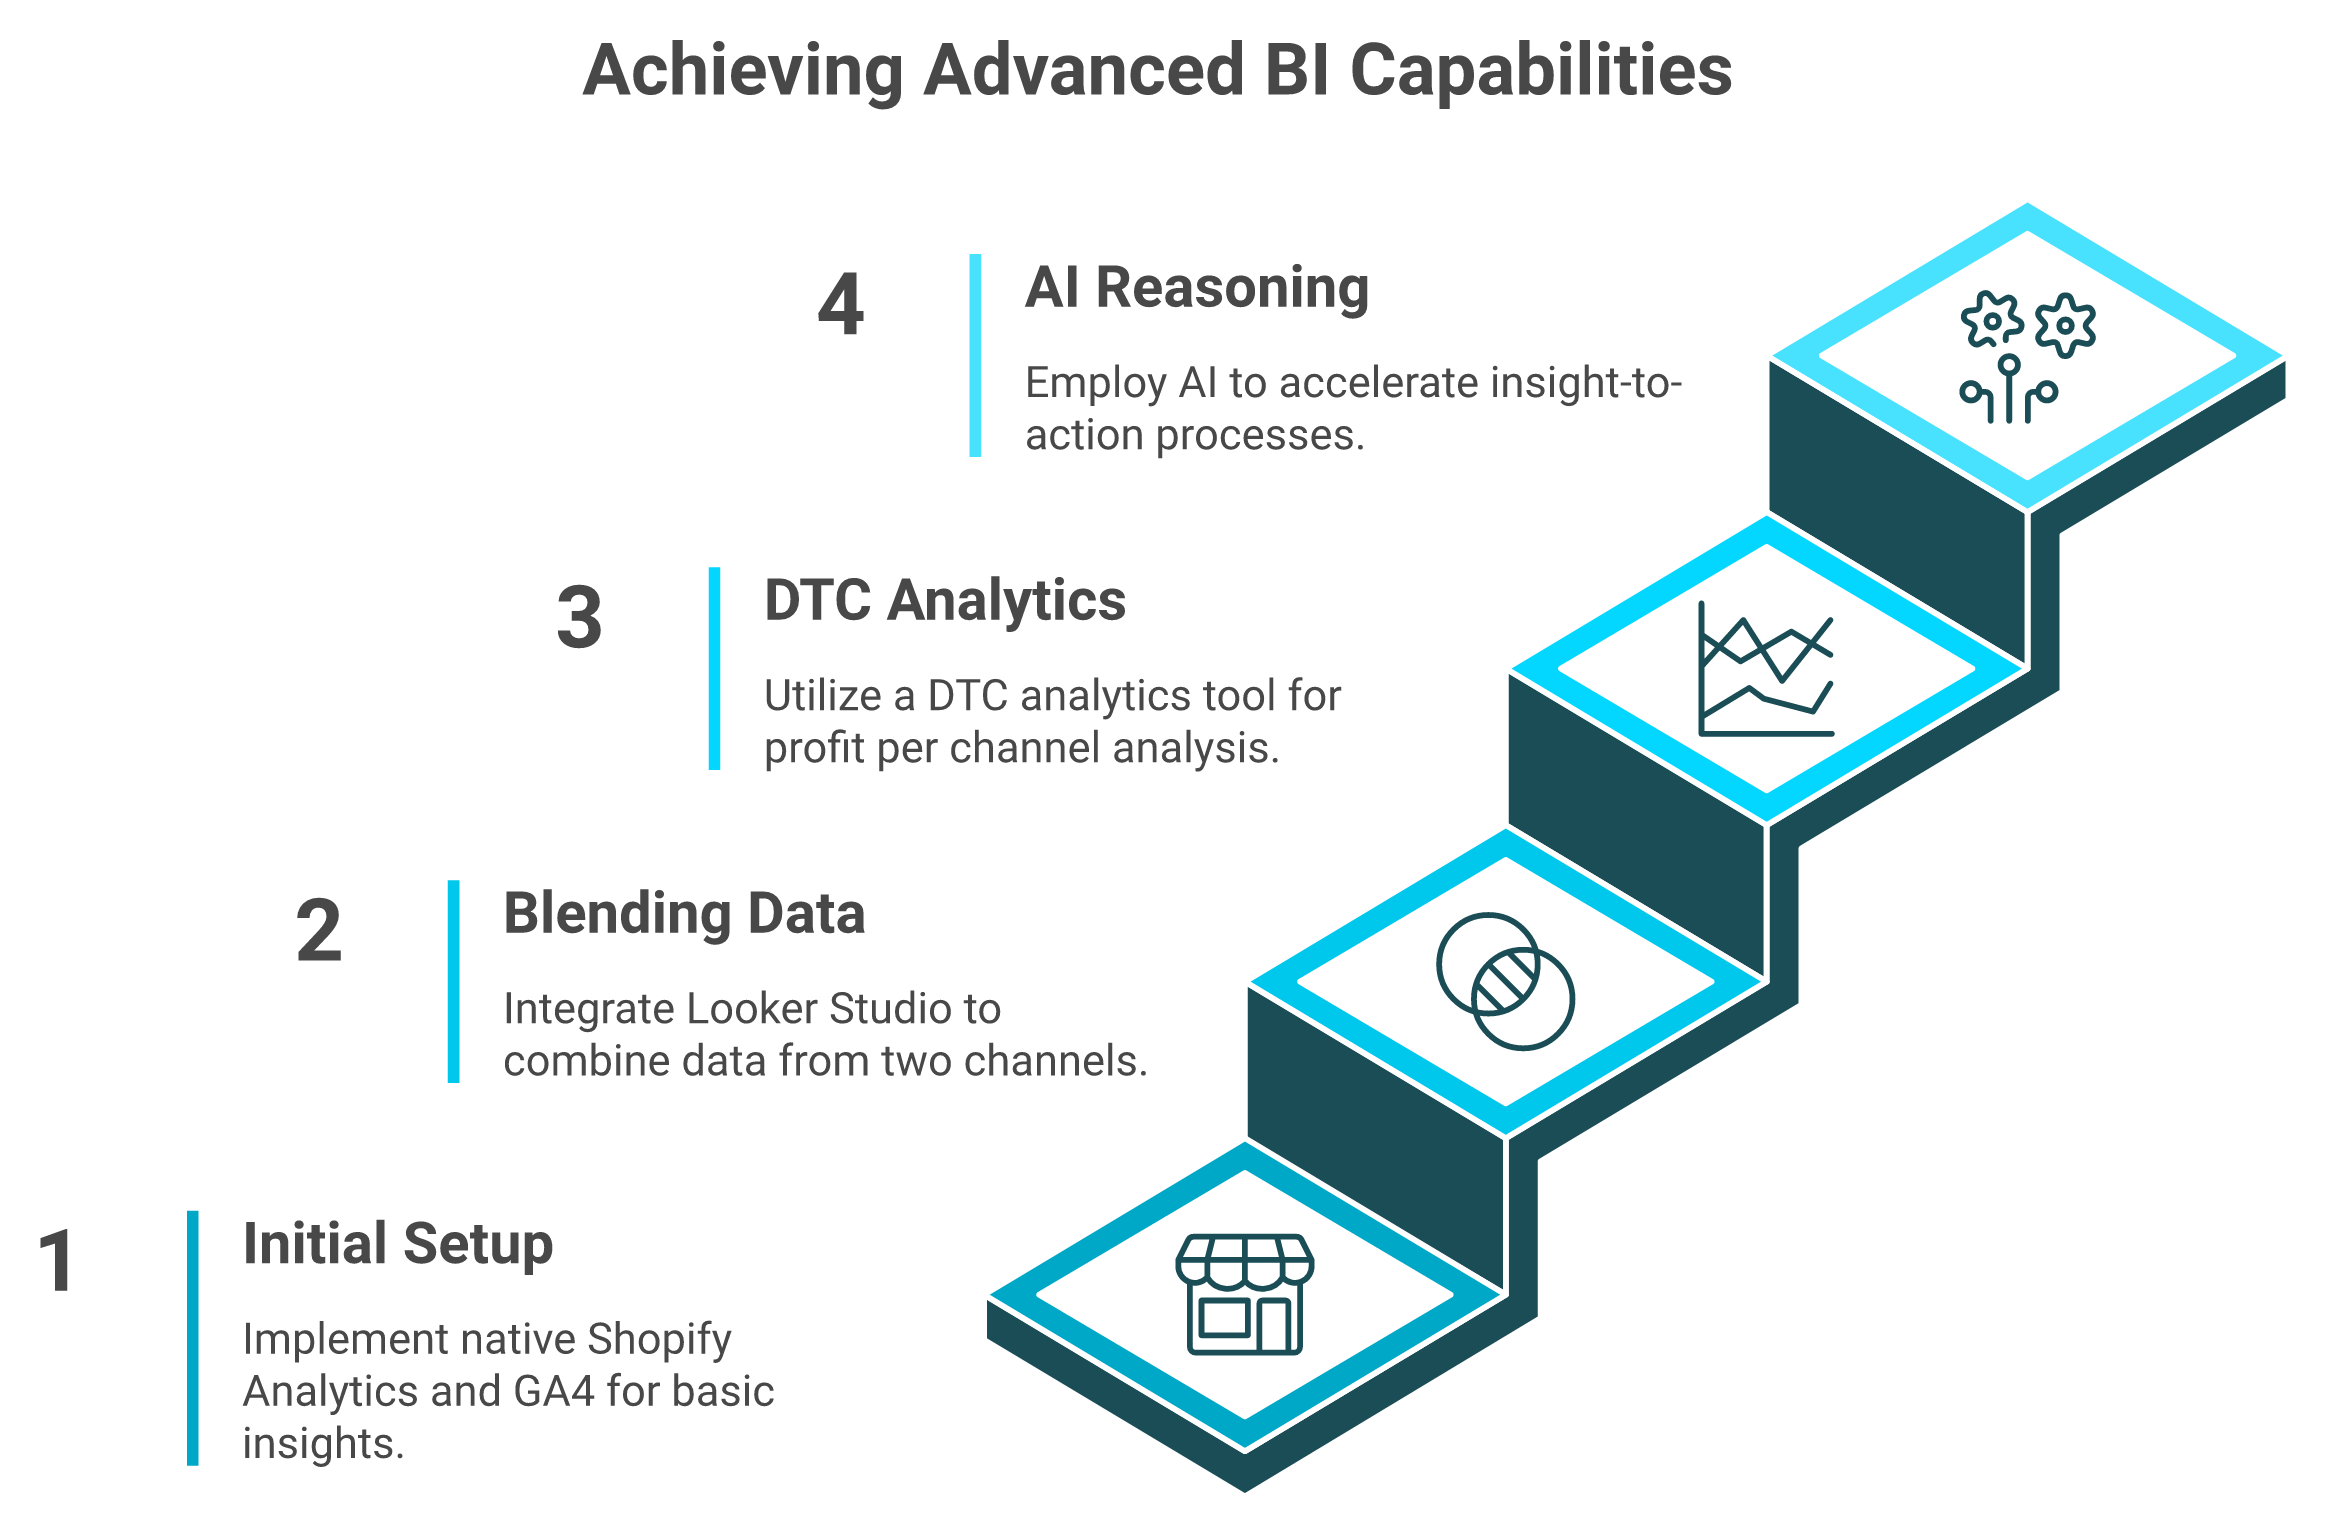
The trigger is always pain, not revenue alone. If your current stack still answers your questions on time, do not touch it. Our roundup of e-commerce analytics platforms can help you match a tool to your stage.
🐿️ The squirrel problem
The biggest mistake I see is buying ahead of the pain. One founder described his feed as 25 people a day selling him "agentic this, agentic that." Squirrel, squirrel, squirrel.
That noise pushes you to overbuy. Another operator paid $99 for a "Business in a Box" that was glorified spreadsheets, and it took 45 minutes to find one document. Wrong tool, wrong stage, real money gone.
💰 Spend where the pain is
Your cash is finite and probably sitting in inventory or ad spend right now. A $1,500-a-month tool you use at 10% is worse than a free Sheet you actually read.
So upgrade against a specific bottleneck. The honest signal for moving to Luca AI is not your revenue. It is when manual reconciliation starts costing you decisions, when you are professionalizing the business and need to bring in specialists rather than do every report yourself. Below that line, hold your cash. I would rather you wait a quarter than buy a layer you are not ready to use. If cash timing is the real constraint, our guide to forecasting cash flow for e-commerce is the better first stop.
Q9. How does intelligence-led capital compare to revenue-based financing? [toc=9. Capital Compared]
Judge any funding option on capital metrics: effective rate, disbursal speed, repayment flexibility, and contract terms. Revenue-based providers like Wayflyer, Clearco, and Uncapped draw operator complaints for last-minute approval reversals, slow or opaque disbursal, and aggressive terms. Intelligence-led capital underwrites faster because it already understands the business, and it competes on rate, speed, and cleaner terms.
💸 You are probably judging capital on the wrong signal
Most founders shop for funding on headline rate alone. That is the wrong read. The metrics that actually decide your outcome are disbursal speed, repayment flexibility, and the fine print in the contract.
Speed matters because cash timing is the real killer. You can be profitable on paper and broke in reality when a Stripe hold hits during a Q4 reorder. The funding has to land before the window closes. We unpack this timing problem in our guide to forecasting cash flow for e-commerce.
⚠️ Where revenue-based financing breaks
Revenue-based financing (capital repaid as a percentage of sales) sounds founder-friendly. The receipts say it breaks at the worst moments. Three patterns repeat across the threads, and our Wayflyer alternatives breakdown covers them in depth.
The quotes are blunt.
"After being offered funding in writing with specific amounts and repayment terms, Wayflyer abruptly reversed their decision at the last minute. This caused significant disruption to our operations and cash flow."
Geoff Brand Wayflyer Trustpilot Verified Review
"We signed a 3M loan deal, only for them to come back two weeks later slashing our funding to 1M. Then, months later, they cut it again to 350K. This bait-and-switch leaves founders stranded during critical growth moments."
Xin Shui Uncapped Trustpilot Verified Review
"They pulled funds far faster than the contract stated, thereby increasing the effective interest rate significantly, and then could never resolve these issues."
Thomas Bishop Clearco Trustpilot Verified Review
✅ What intelligence-led capital changes
Here is the contrast on capital terms, not dashboards. Because Luca AI already understands your numbers, underwriting is faster, so disbursal moves at the speed your cash cycle actually needs. ✅
The repayment terms are transparent, with no surprise acceleration that quietly inflates your effective rate. ✅ Compare that to a siloed financing application that reverses approvals or cuts an offer days before you reorder. ❌ Our Clearco alternatives guide goes deeper on these trade-offs, and our take on funding to scale e-commerce marketing campaigns shows the upside.
I will keep my own uncertainty honest. Below roughly $5M GMV, the "revenue-based financing is founder-friendly" pitch is the one I trust least. My read right now is that capital you can predict beats capital that looks cheap on the headline and then moves the goalposts. This is the heart of the intelligence capital thesis.
Q10. How do you drive team adoption so the BI actually gets used? [toc=10. Driving Adoption]
BI fails on adoption, not features. Personify the AI so staff actually ask it, route repetitive questions to it, and tie one weekly decision to one metric. Keep human empathy where it wins, answering customers with kindness while the reasoning layer handles the data grind. Adoption is a workflow change, not a software install.
👥 The "Harry" trick that beats training
The best adoption tactic I have seen had nothing to do with features. A founder gave his AI a name. He called it Harry and told his team, "We are going to ask Harry."
That one move reframed the tool as a colleague, not software. He said it saved him 100 questions a day from new starters. People who would never open a dashboard will happily ask Harry. We explore this further in how AI can actually help you run your e-commerce business.
❌ Why most BI rollouts become shelfware
The standard rollout fails because it dumps a dashboard on people and hopes. Operators feel it when the tooling adds noise instead of removing it, a gap we covered in our look at Shopify's Winter 26 AI Sidekick.
"We had something that said your sales are down this week, and when I clicked it, it said you had no sales at all last week, which was incorrect. More useless junk on my dashboard."
u/ntn63rj, r/shopify Reddit Thread
The fix is simple. Tie one weekly decision to one metric, and let the tool deliver that one thing reliably. Trust compounds from there.
⚖️ Keep the human where the human wins
Do not automate everything. This is contested ground, and I land on nuance. Human phone answering, with real kindness, is a competitive differentiator that AI cannot yet replicate.
So split the work honestly. Let people own taste, curation, and the customer relationship. Let the machine own the 2am data grind nobody wants. That division is the logic behind our sales performance and marketing analysis and automation use cases.
🔔 Adoption as "open the alert," not "learn the tool"
This is where the Luca AI workflow helps adoption quietly. Instead of asking your team to learn a dashboard, Luca pushes the finding to Slack or email when ROAS dips or inventory runs low. Adoption becomes "read the alert," which everyone already does. You can see how this works in agentic AI for e-commerce founders.
Here is the question I am sitting with heading into 2027. As reasoning layers get better, the constraint stops being data access and becomes founder attention. So what is the one decision you would hand to a system that worked all night, if you trusted it by morning? Tell us what is eating your Mondays, and we will show you what Luca surfaces on real Shopify data.

.webp)
.svg)
.webp)

.png)
