In one-off stores, churn is a judgment, not an event: a customer is churned once they pass their own normal gap between orders, not a fixed 90 days.
Set your churn window from the median days between orders, split by first product, because gaps run from about 71 days in sportswear to 132 days for tea.
Benchmarks are rough: about 30% DTC retention, about 28% repeat purchase rate, and roughly 3 to 4% monthly subscription churn. Compare your own cohorts instead.
Tier customers by gap multiple (Watch 1.5x, At risk 2x, Lapsed 3x) and rank each tier by value at risk: churn probability times expected margin.
Win back by tier: reminders without discounts first, founder emails for high-value at-risk buyers, offers only for lapsed frequent buyers, and suppression for the rest.
Measure saves with a 10 to 20% holdout, and feed churn tiers into revenue, inventory, and cash forecasts so a growing at-risk tier changes next month's plan.
It's Monday morning, and the founder of a Shopify coffee brand opens Klaviyo to a segment called "Lapsed 90 days." It is longer than it was last quarter. Every name on it was reachable a month ago, and the only tool left now is a discount code that teaches the next batch of customers to wait for one.
Customer churn prediction is the work of finding those customers before they land in that segment. You measure each customer's normal gap between orders, watch for the gap stretching, score the risk, and act while a simple reminder still works. It is one of the most practical uses of predictive analytics for e-commerce, and this guide shows how to do it on a real store, without a data team.
What counts as churn when your customers never cancel?
In a subscription store, churn is an event: a cancellation, or a failed payment that never recovers. In a one-off purchase store, nobody cancels, so churn is a judgment. A customer counts as churned once they go well past their normal gap between orders. Customer churn prediction estimates who is on track to cross that gap before they cross it.
⏰ Why a fixed 90-day rule misleads you
Most stores borrow a churn window from a blog post. Ninety days is the usual pick, and it is wrong for most stores. Kunle Campbell cites Rentech Digital data showing the average time between orders runs from 71 days for high-performance sportswear to 132 days for tea. A tea brand on a 90-day rule flags loyal customers who are simply mid-cycle.
The opposite error costs more. A coffee brand with a 30-day bag that waits 90 days has let three reorders slip. By then, the customer has a new habit with someone else.
"By the time you notice someone hasn't reordered, they're already 60-90 days gone." - brett_voyage, Shopify merchant, Shopify Community Thread (Nov 2025)
✅ Event churn versus judgment churn
Subscription churn has a timestamp. The customer clicks cancel, or the card fails and dunning gives up. (Dunning is the automated retry and reminder process for failed payments.) You can count it the day it happens.
One-off purchase churn has no timestamp. Nobody emails you to say they have stopped buying your candles. You decide when silence becomes churn, and that decision drives every number after it: your churn rate, your at-risk list, and your win back budget. If you want the wider diagnostic view, our guide to customer churn analysis covers it.
📏 Set the window from your own orders
Let your customers set the window. Pull every repeat customer's order dates and calculate the median days between orders. Use the median, not the average. As Campbell puts it, the mean "can be heavily influenced by very small or very large values, while the median is not."
Then split it by first product or category. Common Thread Collective compared two bestselling kits at one brand: the sample kit led on repeat rate for the first 30 days, but the full-size kit overtook it before day 75. One window for both would misread one of them. Until your own gaps are ready, the classic RFM recency bands make a fair placeholder. (RFM means recency, frequency, and monetary value, a staple of customer segmentation in e-commerce.) Under 4 months is active, 4 to 12 months is at risk, and over 12 months is churned.
💡 Luca AI's read on the first step
Luca AI's read is that most churn programs fail before any model runs, because the window is wrong. My first move with any store is one table: median days between orders, split by first product. It tells you whether you have a 40-day problem or a 120-day problem.
Luca AI builds that table from connected Shopify data on request. Ask "what is the median gap between orders for customers whose first purchase was the starter kit?" and it answers by product, with no export or pivot table. Because Luca AI normalizes data on ingestion, the gap is calculated on clean order records. You still choose the window; Luca AI supplies the numbers behind it, the way the best conversational analytics tools should.
What is a normal ecommerce churn rate, and how do you calculate yours?
Churn rate is customers lost over customers active at the start, so the window you choose changes the answer.
Ecommerce churn rate is the share of customers you lose in a period: customers lost, divided by customers at the start. Benchmarks are rough. Average DTC retention sits near 30%, the widely cited repeat purchase rate is about 28%, and subscription businesses lose roughly 3 to 4% of subscribers a month. Your own cohorts, compared over time, are the benchmark that matters.
🧮 The formula, and the catch
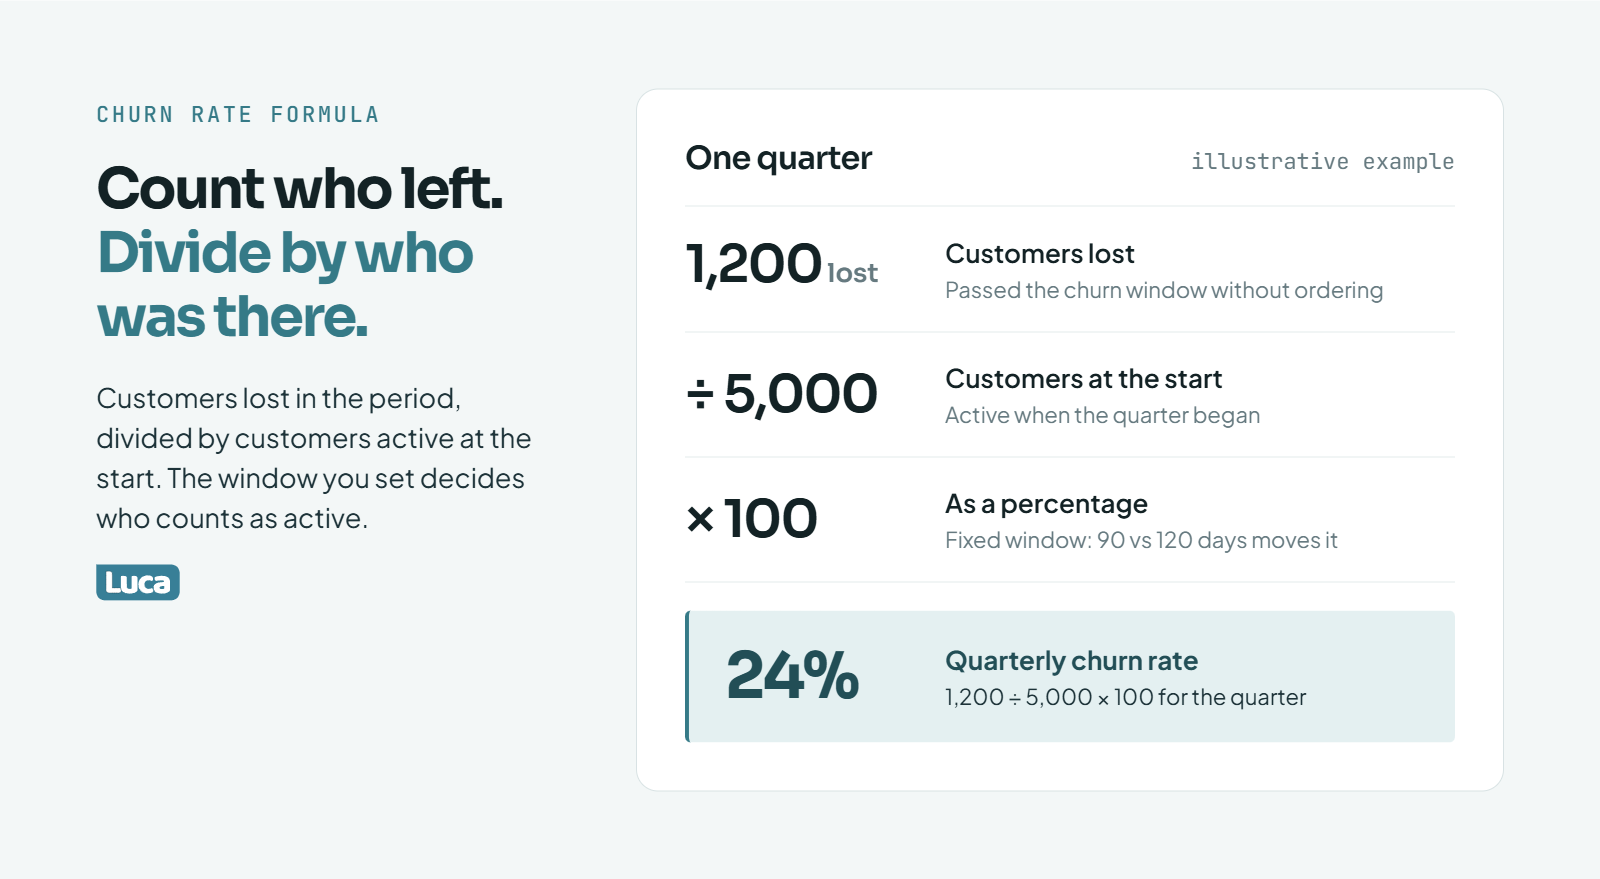
Churn rate = customers lost during the period ÷ customers active at the start × 100.
Here is an illustrative example. You start a quarter with 5,000 active customers. During the quarter, 1,200 of them pass your churn window without ordering. Your churn rate is 1,200 ÷ 5,000 = 24% for the quarter.
The catch is the word "active." In a one-off store, it depends entirely on the window you set in the section above. Move the window from 90 to 120 days and the rate changes, even though no customer behaved differently.
Treat every row as a rough range. These sources use different denominators and time windows, so they will never line up exactly.
⚠️ Voluntary and involuntary churn are different problems
Recurly separates voluntary churn, where the subscriber cancels, from involuntary churn, where a payment fails and is never recovered. The fixes differ. Involuntary churn is a billing problem (card updaters and smarter retries). Voluntary churn is a product or value problem.
Blend the two, and you end up sending a win back email to someone whose card simply expired. Count them separately from day one.
📉 Why your cohorts beat any industry average
A cohort is a group of customers who made their first order in the same month. Track how each cohort's repeat rate decays over time, and compare cohorts against each other. That comparison tells you whether retention is improving, regardless of what a blog says is normal. It is also the honest starting point for any of the customer retention strategies you test later.
It also protects you from bad baselines. The Hammersley Brothers describe how customers recruited during COVID "were decaying completely much faster than normal customers." A forecast built on those cohorts would mislead any store that grew in 2020 and 2021.
Luca AI tracks cohort retention without a cohort dashboard. Ask how this March's 90-day repeat rate compares with last March's, and Luca AI answers from connected Shopify data. Set it as a standing alert, and Luca AI flags when a new cohort decays faster than the ones before it.
Which signals actually predict customer churn?
The strongest churn signal is time since last order, measured against that customer's usual gap between orders. Next come a slowing order frequency, falling email engagement, a deeply discounted first order, a single product category, and recent support complaints. A change in behaviour predicts churn better than the level of behaviour.
🔍 Recency against personal gap comes first
Forty-five days since the last order means nothing on its own. For a customer who reorders every 30 days, it is 1.5 times their gap. For a customer on a 90-day rhythm, it is right on schedule. Operators in one Shopify Community thread landed on the same rule:
"Trigger winback around 1.3x that personal cadence, not a fixed 60 or 90 day bucket." - Adflipr, Shopify app developer, Shopify Community Thread (Nov 2026) "When a customer reaches 1.5× their usual gap for a product, they're flagged as at risk," - Tony_mhzm, app founder, Shopify Community Thread (Oct 2026)
📉 The trend beats the level
Peter Fader and Wendy Moe's research, summarized by Kunle Campbell, found that falling visit frequency predicts lower conversion even among strong customers. In their words, a customer "showing decreasing frequency of site visits is less likely to convert." Apply that to orders. A customer who bought every 30 days and has drifted to 45 is a louder warning than a steady 60-day customer.
🧴 Breadth and the first-order discount
Category breadth is an underused signal. Anthony Mink, CEO of Live Bearded, found that "anybody who buys body care ultimately jumps up about 50 to 100% in LTV." A customer with one category has one reason to return. A customer with three has three.
The first order matters too. Nick Shackelford describes day 1 churners as "the folks who only bought for the discount." A heavily discounted first order with no second order is a weaker relationship than a full-price one.
📋 Where each signal lives
Churn Signals and Where to Find Them
Signal
What it tells you
Where to find it
Days since last order ÷ median gap
How far past normal the customer is
Shopify orders
Change in order interval
Whether the habit is fading
Shopify orders
Email and SMS engagement trend
Whether they still listen
Klaviyo or your email tool
First-order discount depth
Whether they came for the deal
Shopify discount codes
Categories purchased
How many reasons to return
Shopify line items
Recent tickets or returns
Whether something went wrong
Helpdesk and returns app
🆕 The one-time buyer problem
Most customers have only one order, so there is no personal gap to measure. Use the typical reorder window for the product they bought instead. Klaviyo takes a similar approach: for one-time buyers, it estimates the expected date of next order from data across all your customers. Watch their post-purchase email engagement as the second signal.
Luca AI reads these signals across connected sources together. Shopify order gaps, Klaviyo engagement, and support tickets sit in one place, which is the core idea behind e-commerce data integration. A question like "which repeat customers are past 1.5 times their usual gap and stopped opening email?" gets one answer. Set it as a standing alert, and Luca AI pings Slack or email when that group grows.
How do you turn signals into a churn probability and risk tiers?
Rank at-risk customers by churn probability times expected margin, not by churn probability alone.
A churn probability is a 0 to 1 estimate that a customer will not buy again. Klaviyo, for example, reports churn risk on that scale and groups it into low, medium, and high. To act on it, sort customers into four tiers by how far past their usual gap they are. Then rank inside each tier by value at risk: churn probability times expected margin.
🎯 What a churn probability does and doesn't mean
A churn probability of 0.7 means that, of 100 customers who look like this one, about 70 will not order again. That holds only if the model is well calibrated. It does not mean this customer is 70% gone.
Klaviyo's churn risk is based on the number and frequency of a customer's orders. It falls with each new order and rises as time passes between orders. That makes it a sensible starting score, though it knows nothing about your margins.
🪜 Four tiers from gap multiples
Churn Risk Tiers by Gap Multiple
Tier
Days since last order ÷ median gap
What it means
Default move
Healthy
Under 1.5x
Normal variance
Leave alone
Watch
1.5x to 2x
Running late
Timed reminder, no discount
At risk
2x to 3x
Habit is breaking
Start the win back sequence
Lapsed
Over 3x
Probably gone
Win back only if frequent and valuable
These multiples come from operator practice in the Shopify Community thread above, not from a law of nature. Treat them as starting points. Tune them after one full reorder cycle.
💰 Rank by value at risk, not risk alone
Value at risk = churn probability × expected margin from future orders. Expected margin is expected future orders × average order value × contribution margin.
Here is an illustrative example. Customer A has a 0.9 churn probability and one expected future order of $50 at 60% margin, so $30. Their value at risk is 0.9 × $30 = $27. Customer B has a 0.5 probability and four expected orders of $125 at 80% margin, so $400. Their value at risk is 0.5 × $400 = $200. Customer B comes first, even though A is riskier, which is why customer lifetime value belongs in the ranking.
⚠️ Who drops down the list
Value at risk also handles the customers you should leave alone. Campbell warns that groups like "lapsed (not recent) and not frequent" should "generally be avoided" for campaigns. Low frequency means low expected margin, so they sink in the ranking.
Off-the-shelf tools segment well but often stop there. Reviewers say so on both sides:
"It also allows you to segment and export customer data based on purchase frequency, product, and lifetime value." - Verified reviewer (3.5/5), Glew - G2 Verified Review (Sep 2019) "Data was often not accurate and adding new data sources was hard." - Verified reviewer (1.5/5), Glew - G2 Verified Review (Mar 2023)
Luca AI ranks the at-risk list by expected margin from one plain-English question, such as "list customers past 2 times their usual gap, sorted by expected margin." It reads order history, product costs, and engagement from connected sources, so the ranking reflects margin, not revenue. You choose who gets the attention; Luca AI shows who is worth it, much like an AI data analyst for e-commerce would.
How do you build a churn model without a data team?
Start with rules: export orders, calculate each customer's median gap between orders, and flag anyone past 1.5 times it. Move to a platform score, such as Klaviyo's churn risk, once your order history is steady. Train your own machine learning model only when you have tens of thousands of repeat customers and someone to maintain it.
🧾 Level 1: rules in a spreadsheet
A rules model is a set of plain if-then checks. It is less clever than machine learning, and for most stores it is enough. Here is the full method:
Export all orders from Shopify with customer ID, order date, order value, and first product.
For each customer with two or more orders, calculate the median days between orders.
For one-time buyers, use the median gap of the product they bought.
Divide days since last order by that median to get the gap multiple.
Assign tiers (Healthy, Watch, At risk, Lapsed) and sort by value at risk.
Run it every Monday. The rule is crude, but it beats a fixed 90-day bucket because it respects each customer's own rhythm.
📦 Level 2: platform scores
Once you have steady order history, your email platform can do the scoring. Klaviyo's predictive analytics produce churn risk, expected date of next order, and predicted lifetime value per profile. These need enough order history before they appear, and new stores often will not qualify.
The trade-off is visibility. You get a score but not the reasoning behind it, and the score lives only inside the email tool.
🤖 Level 3: a trained model
A trained model learns churn patterns from past customers. Common choices are logistic regression (a model that weighs each signal and outputs a probability) and random forest (many decision trees voting together). Academic work on a public 5,630-customer ecommerce dataset compares these methods and finds that segmenting customers first improves accuracy.
The model is the cheap part. Keeping clean data flowing into it is the expensive part. Ari Tulla, CEO of ELO Health, said his company "spent about $10 million" building a system to turn data into meaning. Luke Bean, CEO of Valente, described migrating from Klaviyo to Bloomreach to get "a sort of single point of truth around the customer."
Three Ways to Build a Churn Model, Plus Luca AI
Approach
Data needed
Effort
Main weakness
Move on when
Spreadsheet rules
Shopify order export
An hour a week
Manual, easy to skip
You stop running it weekly
Klaviyo churn risk
Steady order history in Klaviyo
Low
No margin or reasoning shown
You need margin-ranked lists
Trained model
Tens of thousands of repeat customers
High, ongoing
Needs a data person
Rarely, below $10M revenue
Luca AI
Connected Shopify and Klaviyo data
Low
Not a substitute for your own judgment on offers
Fits from the start
🎯 How accurate is churn prediction, really?
Accuracy is the wrong scorecard. If about 72% of first-time buyers never return, a model that predicts "everyone churns" is 72% accurate and useless. Judge a model by two things instead. Of the customers it flagged, how many actually failed to reorder? And did acting on the flag earn back more margin than it cost?
Builders on G2 describe the same friction with general BI tools, which is why many operators look at self-service BI tools before hiring:
"I don't like its steep learning curve for DAX, the limited data modeling flexibility for very large datasets, and the occasional slow performance with complex reports." - Verified reviewer (4.5/5), Microsoft Power BI - G2 Verified Review (Jan 2026) "Not being able to pull out the daily stats/ metrics to analyse in Excel." - Verified reviewer (4/5), Triple Whale - G2 Verified Review (Apr 2023)
Luca AI replaces the Monday export. It normalizes Shopify and Klaviyo data on ingestion, so the median-gap rule runs on clean records whenever you ask. Luca AI's view is that most stores under $10M never need a custom model. They need the simple rule run every week, with margin attached. Our roundup of predictive analytics tools for e-commerce compares the options in more depth.
How is subscription churn prediction different?
Subscription churn clusters at predictable moments: right after the first discounted order, around the first renewal charge, and a few weeks after the second renewal. Predicting it means watching those windows by cohort, plus failed payments. Failed payments are a separate kind of churn, and usually the easiest to fix.
🍯 Danger zone 1: the day 1 churner
Nick Shackelford, writing about the beverage brand Brez, calls these the honeymoon customers. "Day 1 churn are the folks who only bought for the discount," he says. "These are the people who would marry you for the honeymoon suite and file for divorce the next morning."
Prediction here is simple. Customers who subscribed at the deepest discount and never engaged after the first box are your highest-risk group. Brez's counter was to announce upfront that a real bonus gift arrives in month two, giving the subscriber a reason to stay past the first charge.
💳 Danger zone 2: the first renewal charge
The first billing reminder is the second spike. Shackelford notes that "the moment the first renewal email lands, customers start to second-guess." Brez answered with plain-text founder emails, customer reviews, and "what to expect" guides sent before the charge. One of those simple emails made the brand $40K.
🎁 Danger zone 3: after the second renewal
A few weeks after the second renewal, churn climbs again. Brez ran a giveaway: stay subscribed past day 27, and you could win 5 free cases. Shackelford reports that this move took Brez's churn from 24% to 17%.
Subscription Churn Danger Zones
Danger zone
What predicts it
Intervention Brez used
Day 1
Deep first discount, no engagement
Announce a month-two bonus gift
First renewal
Billing reminder sent, no opens
Plain-text founder email before the charge
After second renewal
Cohort drop-off a few weeks later
Day 27 subscriber giveaway
⚠️ Failed payments and product problems
Involuntary churn deserves its own line in your report. Recurly tracks it separately from cancellations. A subscriber whose card expired did not decide to leave, so a win back email is the wrong tool. Card updaters, retry timing, and a reminder before the card expires do more.
Some churn is a product problem that no email will fix. Moiz Ali, founder of Native deodorant, saw a "pretty mediocre repurchase rate," about 20%, at launch. Customers said the application was the issue. Native spent a year fixing it, reviews rose from 4 to 4.7 stars, and repeat purchases doubled.
📈 Setting the target
Ari Tulla, CEO of ELO Health, framed his goal plainly: "we've been working really hard to get from like you know 13 to 10... I want to get to eight." That is the right shape for a subscription target: a number, a direction, and a next step.
Luca AI watches renewal cohorts from connected subscription and Shopify data. Set a goal such as "first-renewal churn under 10%," and Luca AI reports what is blocking it and alerts you when a cohort leaves its usual range. The decision on gifts, emails, or product fixes stays with you, which is how agentic BI should work.
Can you rely on GA4 churn probability or Klaviyo churn risk?
GA4 churn probability is the chance that a user active in the last 7 days will not be active in the next 7 days. It needs at least 1,000 returning users who met the condition and 1,000 who did not, within a 7-day period in the last 28 days. Klaviyo churn risk estimates whether a customer will purchase again, from order count and frequency. Both are useful starting points, and neither knows your margins.
🔎 What GA4 actually measures
GA4's churn probability is about visits, not purchases. It powers the "Likely 7-day churning users" audience, which includes users above the 80th percentile of churn probability. You can push that audience to Google Ads for retargeting.
The 7-day horizon is the problem for most stores. If your customers reorder every 60 days, a shopper who skips a week of visits is completely normal. GA4 also needs a purchase event with value and currency, plus the user thresholds above. Many smaller stores never qualify, a common gap covered in our guide to Google Analytics for e-commerce.
📧 What Klaviyo actually measures
Klaviyo's churn risk is purchase-based, which fits ecommerce better. It sits next to the expected date of next order and predicted lifetime value on each profile. For one-time buyers, Klaviyo estimates the next order date from data across all your customers.
Its limit is scope. Klaviyo sees orders and engagement, not product margins, ad costs, inventory, or support tickets. A high-risk customer who only ever bought your lowest-margin item looks the same as one who bought your best one.
GA4, Klaviyo, Rules, and Luca AI Compared
Score
Predicts
Horizon
Best use
Blind spot
GA4 churn probability
No site visit
Next 7 days
Short-cycle retargeting
Visits, not purchases
Klaviyo churn risk
No future purchase
Open-ended
Email and SMS segments
Margin, costs, support
Gap-multiple rule
Late versus personal rhythm
Per customer
Weekly at-risk list
Manual upkeep
Luca AI
Late versus rhythm, with margin
Per customer
Margin-ranked list across sources
Needs connected data first
⚖️ Use them with caution
Treat any built-in score as a good estimate, not a verdict. A Mixpanel reviewer put the right attitude well:
"We use the data with caution but it's a good estimate." - Verified reviewer (3/5), Mixpanel - G2 Verified Review (Jun 2016)
Luca AI combines purchase-based risk with the context these scores lack: product margin, inventory, and support history from connected sources. Ask which high-risk customers bought your highest-margin products, and Luca AI answers in one step. For stores outgrowing GA4, our list of Google Analytics alternatives for e-commerce goes further.
What win back campaign should each risk tier get?
Match the effort to the value at risk. Watch-tier customers get a reminder timed to their own gap, with no discount. At-risk, high-value customers get a founder email, reviews, and a reason to return. Lapsed but frequent buyers get the real offer. Lapsed, low-frequency buyers get suppressed, not spammed.
✅ Watch tier: a nudge, not a deal
These customers are 1.5 to 2 times past their usual gap. Most are simply busy. A reminder that lands right on their personal cadence ("your last bag was 45 days ago") often does the job. A discount here teaches loyal customers to wait for codes.
💌 At-risk tier: give them a reason
At 2 to 3 times their gap, the habit is breaking. Lead with the highest value at risk. Shopify's own winback guidance says to start with high average order value customers who have not bought for a while. Send a plain-text founder note, recent reviews, and a usage tip, which is the same kit Brez used before renewals.
For your very top customers, consider a human touch. Kendra Reichenau of Heartland America argues that live phone support still drives retention with older customers that automated flows miss.
💸 Lapsed but frequent: now make the offer
Customers past 3 times their gap who used to buy often are worth a real incentive. They have proven they like the product. Campbell recommends focusing win back here, on lapsed buyers with a strong purchase history. Keep the offer time-boxed and single-use.
❌ Lapsed and infrequent: suppress them
Campbell is direct: groups like "lapsed (not recent) and not frequent" should "generally be avoided" for campaigns. Mailing them drags down open rates and hurts deliverability for everyone else. Suppress them, or send one last "should we keep emailing you?" message.
Win Back Campaign by Risk Tier
Tier
Who
Play
Discount
Watch
1.5x to 2x past gap
Reminder timed to cadence
None
At risk
2x to 3x, high value at risk
Founder email, reviews, usage tips
None, or a gift
Lapsed, frequent
Over 3x, strong history
Time-boxed offer
Yes, capped
Lapsed, infrequent
Over 3x, weak history
Suppress or final check-in
No
🗣️ Ask why before you discount
Native found its churn cause by asking customers why they did not reorder. Add one question to your at-risk email: "What stopped you?" The answers tell you whether you have a timing problem, a price problem, or a product problem.
Be careful how you score the results. Attributed revenue is slippery, as one Triple Whale reviewer found:
"Triple Whale will attribute more revenue to the email that was sent out, but the platform will attribute more revenue to the SMS that was sent out." - Verified reviewer (4/5), Triple Whale - G2 Verified Review (Apr 2023)
Luca AI pushes the tiered list to Slack or email every week and flags when a tier suddenly grows, the same way automated e-commerce reporting should. You run the campaign in Klaviyo as usual. Luca AI's job is to make sure the right customers are on the right list before Monday's send, using the e-commerce customer segmentation you already trust.
How do you know the customers you saved were really saved?
Only the margin the treated group earns above a random holdout counts as revenue the win back really saved.
Hold back a random 10 to 20% of each at-risk tier from the win back campaign. After one reorder cycle, compare the reorder rate and the margin between the two groups. Only the difference counts as saved revenue. Everything else would have come back without the email or the discount.
⚠️ Why attributed win back revenue overstates the result
Your email tool credits every order placed after a win back email to that email. Many of those customers were coming back anyway. Watch-tier customers are, by definition, only a little late. Some of them were always going to order this week.
That is how a win back flow can look like a hit in the dashboard while it quietly gives discounts to people who did not need them. Retention is worth the effort. Campbell cites Reichheld and Schefter's finding that "just a 5 per cent increase in retention can yield a 25 to 95 per cent increase in profits." That only holds if the retention is real.
🧪 How to run a holdout
Take one tier, for example the at-risk tier.
Randomly hold back 10 to 20% of it. Splitting by the last digit of the customer ID works.
Send the campaign to everyone else, at the same time.
Wait one median reorder gap.
Compare reorder rate and contribution margin after discount costs.
Keep the holdout in place for every send. Rotating it each month keeps any one customer from being ignored for long.
🧮 An illustrative example
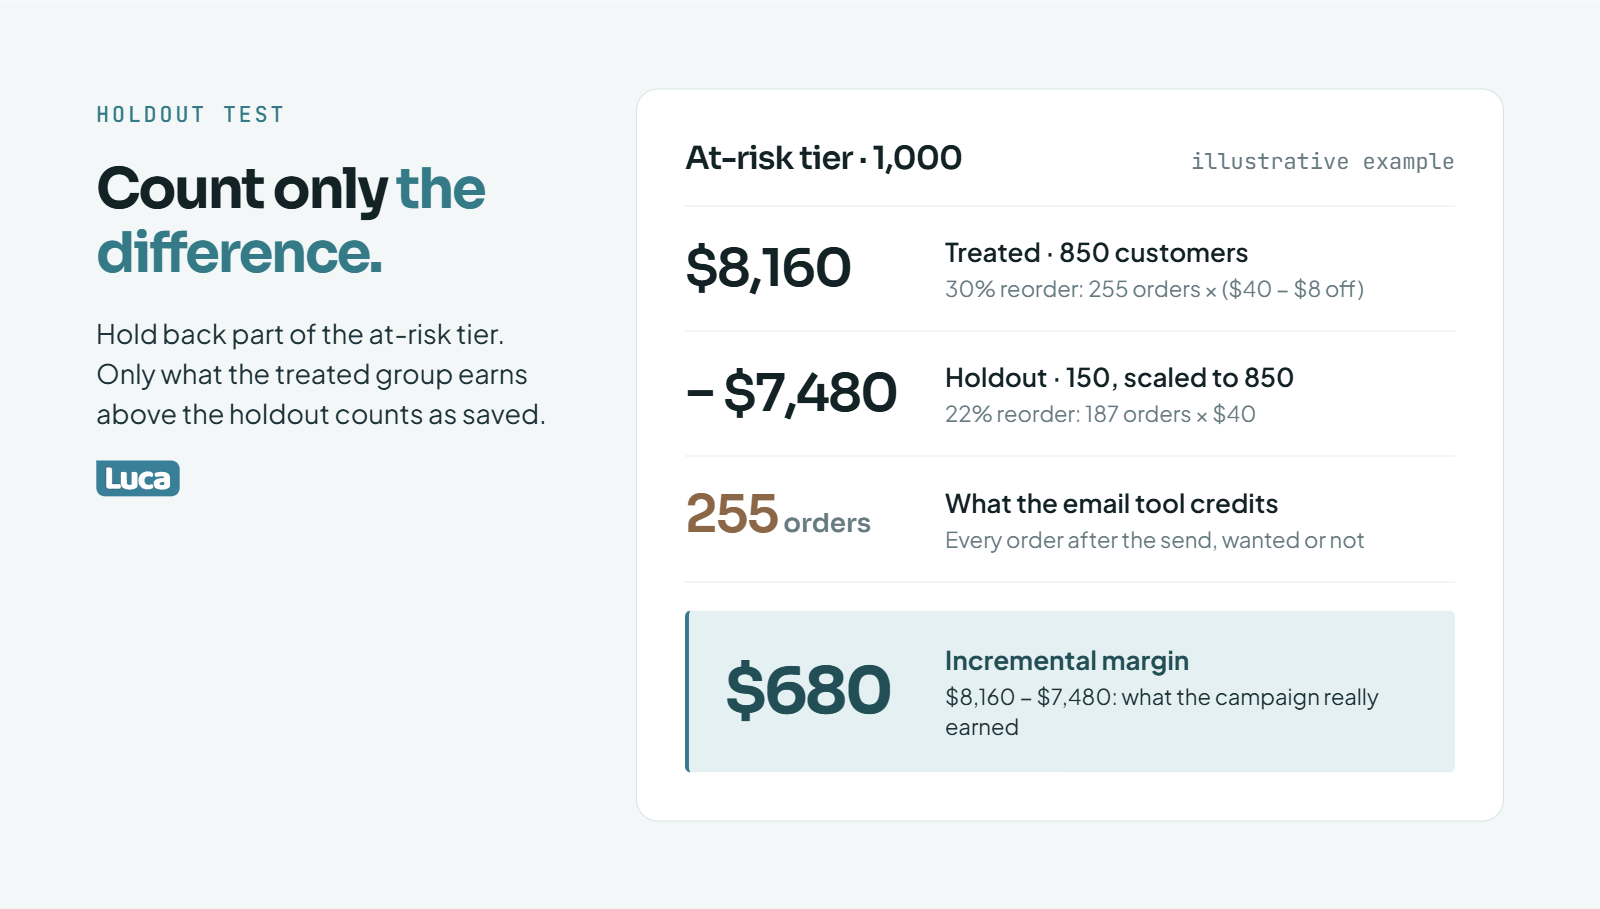
Say the at-risk tier has 1,000 customers. You treat 850 and hold back 150. The offer is $8 off, and each reorder earns $40 of contribution margin before the discount.
Treated: 30% reorder, so 255 orders × ($40 − $8) = $8,160 of margin.
Holdout: 22% reorder. Scaled to 850 customers, that is 187 orders × $40 = $7,480.
Incremental margin: $8,160 − $7,480 = $680.
Your email tool would credit all 255 orders to the campaign. The holdout shows the campaign earned $680. That is still positive, but it is a very different decision about how deep the next discount should be. It is the same discipline that underpins any honest customer profitability analysis.
Luca AI compares holdout and treated groups on reorder rate and contribution margin on request. Tag the holdout in Klaviyo, then ask Luca AI how the two groups differed after 32 days. It answers from connected Shopify and Klaviyo data, with discount cost included.
What does churn prediction look like for one Shopify store?
A 32-day median gap sets the tiers, and a no-discount email to the at-risk tier saved 51 customers in one cycle.
Take an illustrative coffee brand with 4,000 repeat customers and a 32-day median gap between orders. It flags customers at 48 days, acts at 64, and treats 96 days as lapsed. It ranks each tier by value at risk, runs a tiered win back with a holdout, and reads the difference after one cycle.
☕ The store and its window
The example brand sells a 12oz bag for $36, with a 50% contribution margin, so $18 per order. The median gap between orders is 32 days. That sets the tiers: Watch at 48 days (1.5x), At risk at 64 days (2x), and Lapsed at 96 days (3x).
On the Monday run, the 4,000 repeat customers split like this:
Illustrative Coffee Brand: Customers by Tier
Tier
Customers
Play
Healthy
2,600
Nothing
Watch
600
Reminder at day 48, no discount
At risk
500
Founder email, reviews, brew tips
Lapsed
300
Offer to 120 frequent buyers, suppress 180
The four tiers add up to 4,000.
📋 Ranking and the campaign
Inside the at-risk tier, customers are sorted by value at risk. A customer with eight past orders sits above a customer with two, even at the same gap. The top of the list gets the founder email first.
The brand holds back 15% of the at-risk tier: 75 customers. The other 425 get the email sequence. No discount goes to the at-risk tier. Only the 120 lapsed, frequent buyers get a single-use offer.
📈 The result after one cycle
After 32 days, the brand reads the at-risk numbers:
Treated: 425 customers, 32% reordered, so 136 orders.
Holdout: 75 customers, 20% reordered, so 15 orders.
Fifty-one saved customers × $18 is $918 of margin in the first cycle, with no discount spent. Suppose only 25 of them keep their 32-day rhythm for the rest of the year, about 11 more orders each. That adds 25 × 11 × $18 = $4,950 of margin from one Monday list, which is why Shopify LTV is the number to watch, not the first reorder.
💡 What the example teaches
The big number is not the first cycle. It is the rhythm you protect. The holdout also tells the brand something useful: a no-discount email moved this tier, so a discount here would have been wasted margin that hurts your e-commerce profit margins.
Luca AI runs this whole loop from connected data: median gap, tier counts, value at risk ranking, and the holdout read. You still write the email and choose the offer.
How should churn prediction change your revenue and cash forecast?
Luca AI treats churn prediction as a forecast input, not just a marketing list. Most stores keep churn scores in the email tool and the revenue forecast in a spreadsheet, so a growing at-risk tier never reaches the inventory order or the cash plan. Luca AI connects Shopify, Klaviyo, and accounting data, so repeat revenue at risk shows up in next month's forecast before the shortfall lands.
📅 The forecast that assumes nothing changes
Picture the founder of a $2M-a-year store building next month's plan. New customer revenue comes from the ad budget. Repeat revenue gets last quarter's number, copied forward. The coffee order to the roaster is sized on trailing 30-day sales.
Meanwhile, the at-risk tier in Klaviyo grew by 200 customers this month. Nobody connected the two, because they live in different tools owned by different people.
🧾 What the old way costs
Here is what that gap costs, using the illustrative coffee brand from above. Say 200 extra customers moved from Healthy to At risk. A healthy customer has roughly a 90% chance of ordering next month; an at-risk customer, roughly 40%. That is 200 × (0.9 − 0.4) = 100 fewer orders, or 100 × $36 = $3,600 of revenue and 100 fewer bags.
The forecast misses the $3,600. The roaster order is 100 bags too big, and that cash sits on a shelf, a classic e-commerce inventory management problem. Dashboards show both numbers, but someone has to stitch them together by hand.
🔄 What changed
Analytics tools used to show data and stop there. The shift is that AI can now reason across sources: it can read the churn tiers, apply them to expected orders, and carry the result into revenue and inventory in one pass. The output is no longer a chart. It is the next step, which is the idea behind AI demand forecasting for e-commerce.
🧠 How Luca AI handles it
Luca AI is an AI operating system for e-commerce brands. Its data layer connects Shopify, Klaviyo, Meta, Google, and accounting tools, and normalizes the data on ingestion. Its intelligence layer forecasts repeat revenue from how each cohort is actually decaying, not from last quarter's average.
You can ask Luca AI in plain English: "How much repeat revenue is at risk next month, and how should that change the roaster order?" Or set a weekly report, and Luca AI sends the at-risk revenue, the tier changes, and the reasoning to Slack or email. Luca AI does the analysis and lays out the steps. You decide the order size and the campaign.
💰 Why this matters for your bank account
Churn is not only a marketing number. It is next month's revenue, this month's inventory order, and the cash in between. Luca AI's view is that the stores that win on retention are the ones whose cash flow forecast moves the day their at-risk tier moves.
What is your median gap between orders today, and when did you last check it? Tell us, and we'll show you what your at-risk tier says about next month.
FAQ's
How far in advance can you predict customer churn?
In practice, you can predict churn about one reorder cycle ahead. The earliest reliable warning comes when a customer passes about 1.5 times their own median gap between orders. Before that point, a late order is usually normal variance, not a lost customer.
How early that is in calendar days depends on your product:
A coffee or supplement brand with a 30-day cycle gets a warning around day 45.
A tea brand with a gap near 130 days gets it closer to day 195.
Subscription brands get earlier warnings, because churn clusters around the first discounted order and the first renewal charge.
Earlier signals exist, but they are weaker on their own. A falling email open rate, a slowing order rhythm, or a recent support ticket can raise risk before the gap is crossed. Combining them is what moves the warning forward.
Luca AI watches those signals together across Shopify, Klaviyo, and support data, and sends an alert when a group of customers starts drifting past their usual rhythm. We built it that way because a single signal fires too late or too often. You can see how that works in our guide to predictive analytics for e-commerce.
Do I need a minimum number of customers to predict churn?
It depends on the method. A simple rules model has almost no minimum. If you have repeat customers with two or more orders, you can calculate their median gap between orders and flag anyone running late. Small stores often get the most value here, because one table changes how they run win back.
Built-in machine learning scores are different:
GA4 churn probability needs at least 1,000 returning users who met the churn condition and 1,000 who did not, within a 7-day period in the last 28 days.
Klaviyo churn risk needs enough order history in the account before predictions appear, so new stores often will not see it.
A custom model realistically needs tens of thousands of repeat customers and someone to maintain it.
Our view is that most stores below $10M in revenue do not need a custom model at all. They need the simple rule run every week, with margin attached. Luca AI runs that rule on connected Shopify and Klaviyo data whenever you ask, so you do not need a data team or a minimum list size to start. Our breakdown of an AI data analyst for e-commerce explains the trade-offs.
What is the difference between churn prediction and churn analysis?
Churn analysis looks backward. It explains who already left, when, and why, usually by cohort, product, or acquisition channel. Churn prediction looks forward. It estimates which current customers are likely to leave next, so you can act before they do.
The two feed each other:
Analysis tells you your normal reorder gaps, which products hold customers, and which first orders lead to quick churn.
Prediction uses those patterns to score today's customers and sort them into tiers such as Watch, At risk, and Lapsed.
After a win back campaign, analysis with a holdout group tells you whether the prediction and the campaign actually saved anyone.
Most stores do the analysis once, in a spreadsheet, and never connect it to a weekly at-risk list. That is where the value leaks out.
Luca AI handles both sides from the same connected data. You can ask why last quarter's cohort decayed faster, then ask which current customers match that pattern, in plain English and in one conversation. We cover the backward-looking side in depth in our guide to customer churn analysis.
How often should you re-score customers for churn risk?
Weekly is the right default for most e-commerce stores. A customer's risk changes every day they do not order, so a monthly score lets people slide from Watch to Lapsed between runs. Daily scoring is rarely worth it unless your reorder cycle is very short.
A simple cadence that works:
Every Monday: recalculate days since last order against each customer's median gap and update the tiers.
Every reorder cycle: read the holdout results from the last win back send and adjust the offers.
Every quarter: recheck the tier thresholds (1.5x, 2x, and 3x) against what actually happened, and retune them.
The weak point is never the math. It is that the Monday export gets skipped during a busy launch or a Q4 rush, and the at-risk list goes stale exactly when it matters most.
Luca AI removes that step. It keeps the tiers current from connected Shopify and Klaviyo data and can send the updated list to Slack or email every week, with a flag when a tier grows faster than usual. We see this as the difference between a churn model and a churn habit. Our guide to automated e-commerce reporting shows how scheduled reports fit in.
Can churn prediction work for a store with mostly one-time buyers?
Yes, but you predict the second order, not the next one. Roughly 7 in 10 first-time buyers never return, so most stores have far more one-time buyers than repeat customers. These buyers have no personal gap between orders, so you borrow one.
Here is how we approach it:
Use the typical reorder window for the product they bought. A 30-day bag of coffee and a 120-day candle get different windows.
Look at your second-order curve: the point by which most customers who ever reorder have done so. Past that point, the odds drop sharply.
Add post-purchase engagement. A buyer who opens the welcome flow and clicks a usage tip is a better bet than one who never opens anything.
Note the first-order discount. Customers who came for a deep discount churn faster.
Klaviyo takes a similar approach for one-time buyers, estimating their expected next order date from data across all customers. Luca AI goes a step further by splitting that window by first product and adding margin, so you focus win back on the one-time buyers who are worth the effort. Our guide to customer retention strategies for e-commerce covers what to send them.
Enjoyed the read? Join our team for a quick 15-minute chat — no pitch, just a real conversation on how we’re rethinking Ecommerce with AI - Luca
Loading Schedule...
Your AI Co-Founder is here.
Here’s why:
Shopify, Meta, Xero - one brain.
"Should I scale?" Answered with real data.
Growth capital. No applications. One click.
Thank you! Your submission has been received! Please book a time slot for the Meeting
Oops! Something went wrong while submitting the form.