How AI Agents Forecast SKU Demand and Prevent Stockouts
12
mins read
TL;DR
Most AI forecasting tools ship only the chat layer, skipping data infrastructure and modeling, so they report what sold but never predict what will sell.
Spreadsheet forecasting costs real cash: stockouts mid-campaign, dead inventory, and clearance discounts that were really ordering mistakes made months earlier.
AI forecasting pays off above roughly 100 SKUs with 12 months of clean history; below 50 SKUs a spreadsheet still wins.
Real forecasting needs time series decomposition, feature engineering, multi-SKU dependencies, external signals, and continuous retraining, not API retrieval.
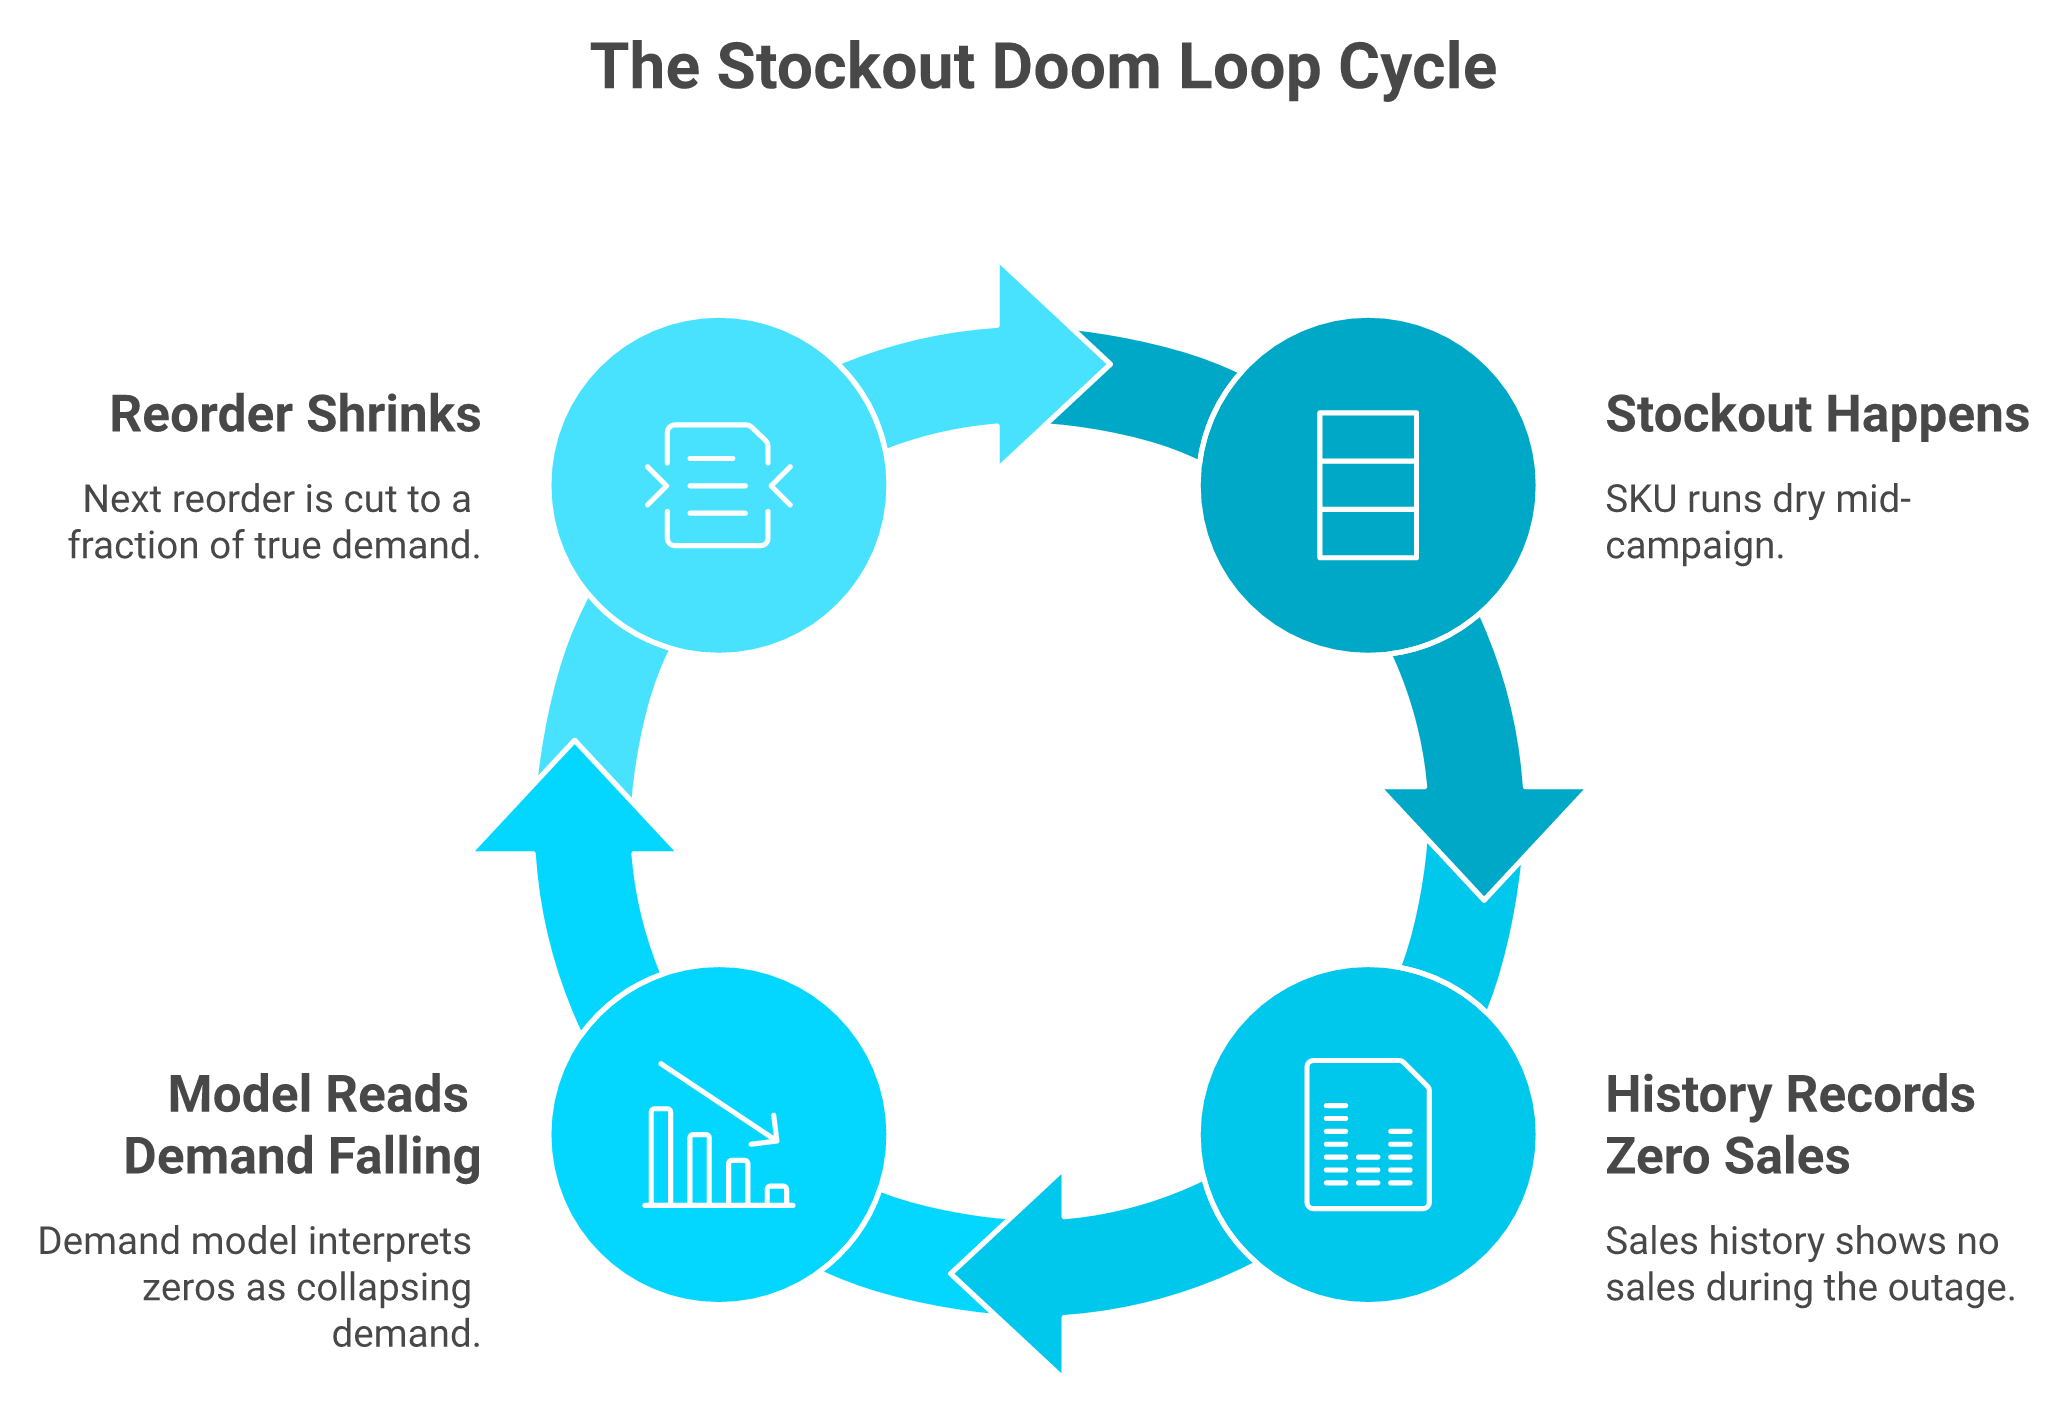
Stockout-censored demand is the hidden failure: zero sales during an outage teaches naive models that demand fell, causing the next stockout.
Prove accuracy against a naive baseline using MAPE, bias, and forecast value added, then expand autonomy only after the agent earns it.
Q1. Why can't most "AI-powered" ecommerce tools forecast demand at all? [toc=1. Why Most AI Fails]
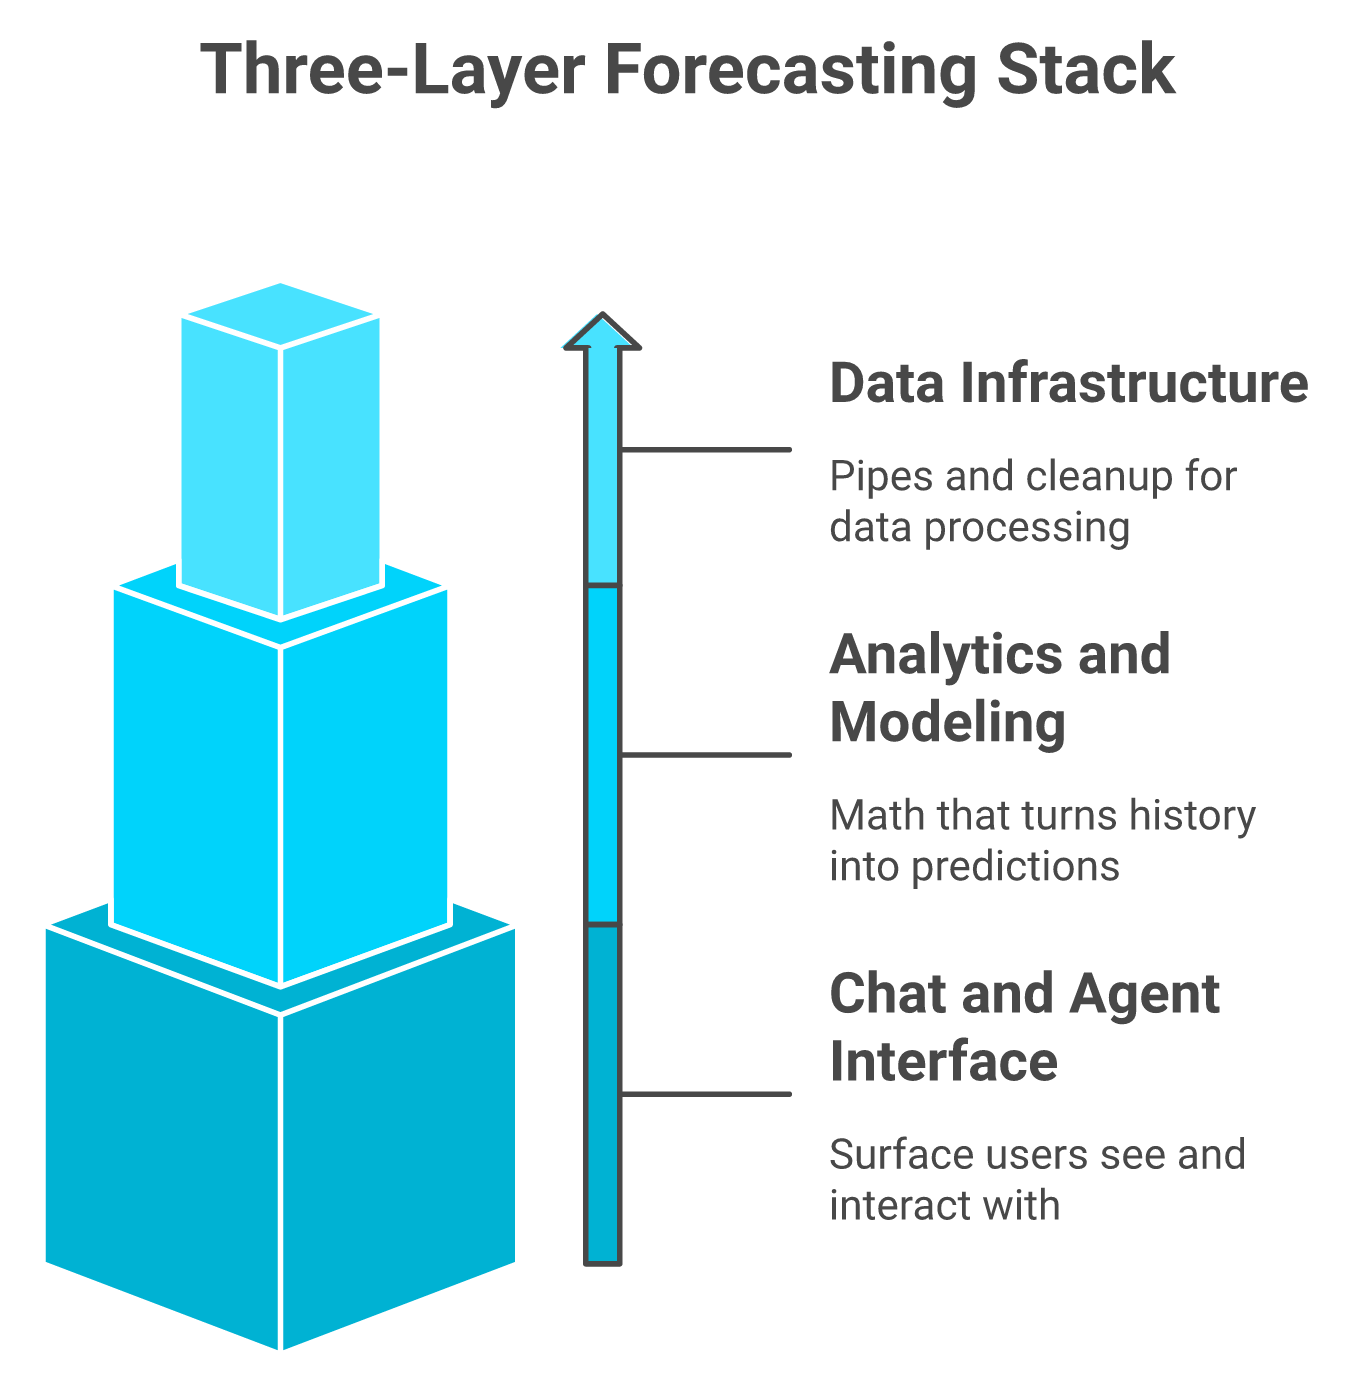
Most AI ecommerce tools are chat interfaces sitting on top of API calls. Real forecasting needs three layers: data infrastructure, analytics and modeling, then the agent. Most vendors build only the third layer and call it AI-powered. That is why they get cloned in weeks, and why the tool can tell you what sold but never what will sell.
An operations director I spoke with last quarter had already run this experiment. Her inventory system shipped a native AI forecasting module. She gave it six months of real purchase orders before she pulled the plug.
Her verdict was blunt. "It was rubbish. We couldn't rely on it." She went back to exporting data and running the analysis in a general-purpose assistant instead.
⚠️ The three layers, and the one nobody builds
Real forecasting lives in the bottom two layers. Most tools ship only the third and call it AI-powered.
Think of any forecasting product as a stack. Layer 1 is data infrastructure, meaning the pipes and the cleanup. Layer 2 is analytics and modeling, meaning the math that turns history into a prediction. Layer 3 is the chat or agent surface you actually see.
Most vendors build Layer 3 only. It demos beautifully. It also explains why a competitor can rebuild the whole thing in a fortnight.
Luca AI normalizes and standardizes data on ingestion across 200+ native connectors, which is Layer 1 ecommerce data integration work that never appears in a product screenshot.
❌ Why a demo hides the missing layers
In a demo you ask questions about last month. Layer 3 answers those fine, because the answer already exists in your order history. The gap only shows up when you ask about next month.
Data quality problems hide the same way. Reviewers of connector tools keep reporting it:
"We are a startup company and mainly use Supermetrics for Shopify API. Data is inaccurate when it comes to Daily Total Sales and Returning Orders figures." — Verified reviewer, Supermetrics - G2 Verified Review
"Some data we still notice discrepancies between platforms, for example, tracking ads, and differences in the reported metrics like revenue." — Verified reviewer, Triple Whale - G2 Verified Review
Neither reviewer is complaining about the chat box. Both are describing Layer 1 failing quietly underneath.
✅ The one question to ask any vendor
Ask this: "Show me your model, not your chat." Then ask what it was trained on, how often it retrains, and what happens to a SKU with four months of history.
A Layer 3 wrapper cannot answer those questions. A real forecasting system answers them in a paragraph.
The timing matters right now. Shopify's Stocky app retires after August 31, 2026, and merchants are actively picking replacements in public. One wrote that they "moved over to SupplyWatch a while back" because it covered "the POs, stock counts, and forecasting we were using in Stocky."
My read is that this migration window is where most stores will accidentally buy a wrapper. The pressure to replace something fast beats the patience to check what is underneath.
Luca AI is an ecommerce business intelligence layer built on a normalized data warehouse rather than a chat shell, so the reasoning still holds when it meets a messy 900-SKU catalogue.
Q2. What is spreadsheet-and-gut forecasting actually costing you? [toc=2. Hidden Cost of Guessing]
The bill arrives three ways: stocking out of your best seller mid-campaign, ten thousand dollars frozen in slow movers, and 30 percent discounts to clear what you over-ordered. Counted in cash rather than units, moving days inventory outstanding to top-tier frees 30 to 70 days of working capital. That is why the loss never shows up as a line item.
Picture the Monday routine. Export orders from Shopify. Export returns. Paste both into the sheet that has been limping along since 2023.
One operator described that era of his business to me with a wince. "It makes me shudder now, because on a Monday you do your standard ecommerce reports." The reports were the job. The decisions came later, if at all.
💸 Three silent profit killers
None of these look like a failure. They look like a normal quarter.
Stockout during a campaign. You paid for the traffic. The traffic converted somewhere else, or nowhere.
Dead cash. Ten thousand dollars sitting in a slow mover is ten thousand dollars not buying your winner.
Clearance discounting. A 30 percent markdown to fix an ordering mistake is a margin decision made three months earlier.
Luca AI connects Shopify, payments, marketing, accounting, and operations data into one model, so the reorder question and the cash flow forecasting question stop living in separate tabs.
💰 Count stockouts in cash days, not lost revenue
Lost revenue is a guess. Cash days are measurable. EightX's 2026 DTC cash flow work found that moving days inventory outstanding to the top tier frees 30 to 70 days of cash, worth roughly $300K to $500K on a $6M brand.
That reframe changes the argument with your finance lead. You are not asking for better forecasts. You are asking to unlock working capital that is currently sitting on a shelf.
⏰ The manual method has a hard ceiling
Operators say this out loud constantly. On r/shopify, the standard advice for small catalogues is still "review your sales figures from the last few months" and extrapolate. It works, right up until it does not.
"If you run a small business or have a limited range of SKUs, the easiest method is to review your sales figures from the last few months." — Commenter, r/shopify Reddit Thread
Even connector tools that automate the export step get judged on manual overhead:
"Much of my time spent within Supermetrics is spent manually finding and fixing errors from expired auth tokens or date formats changing randomly." — Verified reviewer, Supermetrics - G2 Verified Review
That second quote is the real cost. You did not buy a tool; you hired yourself a maintenance job.
A buyer at an apparel brand put the stakes in plain numbers for me. "You pick up one style of denim, that's a $6,000 commitment." Get four of those wrong in a season and the sheet has cost you a hire.
Luca AI replaces the Monday export ritual with one queryable layer, so the hours move from assembling data to deciding what to reorder, which is the practical shift behind better ecommerce inventory management.
Q3. Do you have enough data and enough SKUs for AI forecasting to beat your spreadsheet? [toc=3. Data Readiness Threshold]
Plan on 6 to 12 months of clean sales history before machine learning reliably beats a moving average, and 12 to 24 months before seasonal patterns are trustworthy. Below roughly 50 SKUs, a spreadsheet still wins. Luca AI monitors every SKU continuously and pushes reorder alerts, which starts paying off once weekly decisions outnumber what one person can judge.
Here is the honest version. AI forecasting is not always the upgrade. Sometimes it is an expensive way to formalize a guess.
⭐ The two numbers that decide it
Two thresholds do most of the work.
Data readiness thresholds for AI demand forecasting
Signal
Below the bar
Above the bar
Sales history
Under 6 months, use a moving average
12 to 24 months, seasonality becomes learnable
Active SKUs
Under 50, the sheet is fine
Over 100, per-SKU judgement breaks down
Industry guidance lands in the same place: 6 to 12 months minimum for a model to beat naive methods, with 12 months plus long lead times as the point where the investment pays.
Luca AI studies performance across months and years, which is exactly why thin history limits what any predictive analytics for ecommerce model can honestly claim.
✅ Why the ceiling is arithmetic, not discipline
Past 100 SKUs, the problem is not that you are lazy. It is that the number of weekly reorder judgements exceeds what one brain can hold.
A retail operator described handing a year of product-level sales to an assistant to plan warehouse shelf placement. "If I was to sit there with 500 skews and try and work that out, that would be months work. And it did it in moments."
Large retailers solved this years ago by hiring data science teams. Most stores doing $1M to $5M never could.
⚠️ Thin data plus a complex tool equals confusion
This is where analytics buyers get burned. Powerful tooling with sparse data produces reports nobody trusts. Reviewers say it directly:
"It can be VERY hard to decipher what I am seeing. You really need your web programming team to be fully invested and to help you deep dive into some of the metrics." — Verified reviewer, Google Analytics - G2 Verified Review
"It requires a lot of setup and manual work to get what you really need... It has pretty substantial limitations for ecommerce tracking." — Verified reviewer, Google Analytics - G2 Verified Review
Merchants at the other extreme have the opposite problem. One Shopify Community poster running over 1,000 SKUs asked for forecasting and dead-stock detection in a single app, because best sellers are obvious and everything else is fog.
⏰ A two-line self-test
Count your active SKUs. Count months of clean order history. If it is 100 plus and 12 plus, you are past the manual ceiling and the model has something to learn from.
Luca AI carries the per-SKU judgement no operator repeats 500 times a week, watching every SKU rather than the handful you remember to check, which is the same discipline behind useful ecommerce reporting.
Q4. What actually separates a chatbot from an AI forecasting agent? [toc=4. Chatbot vs Agent]
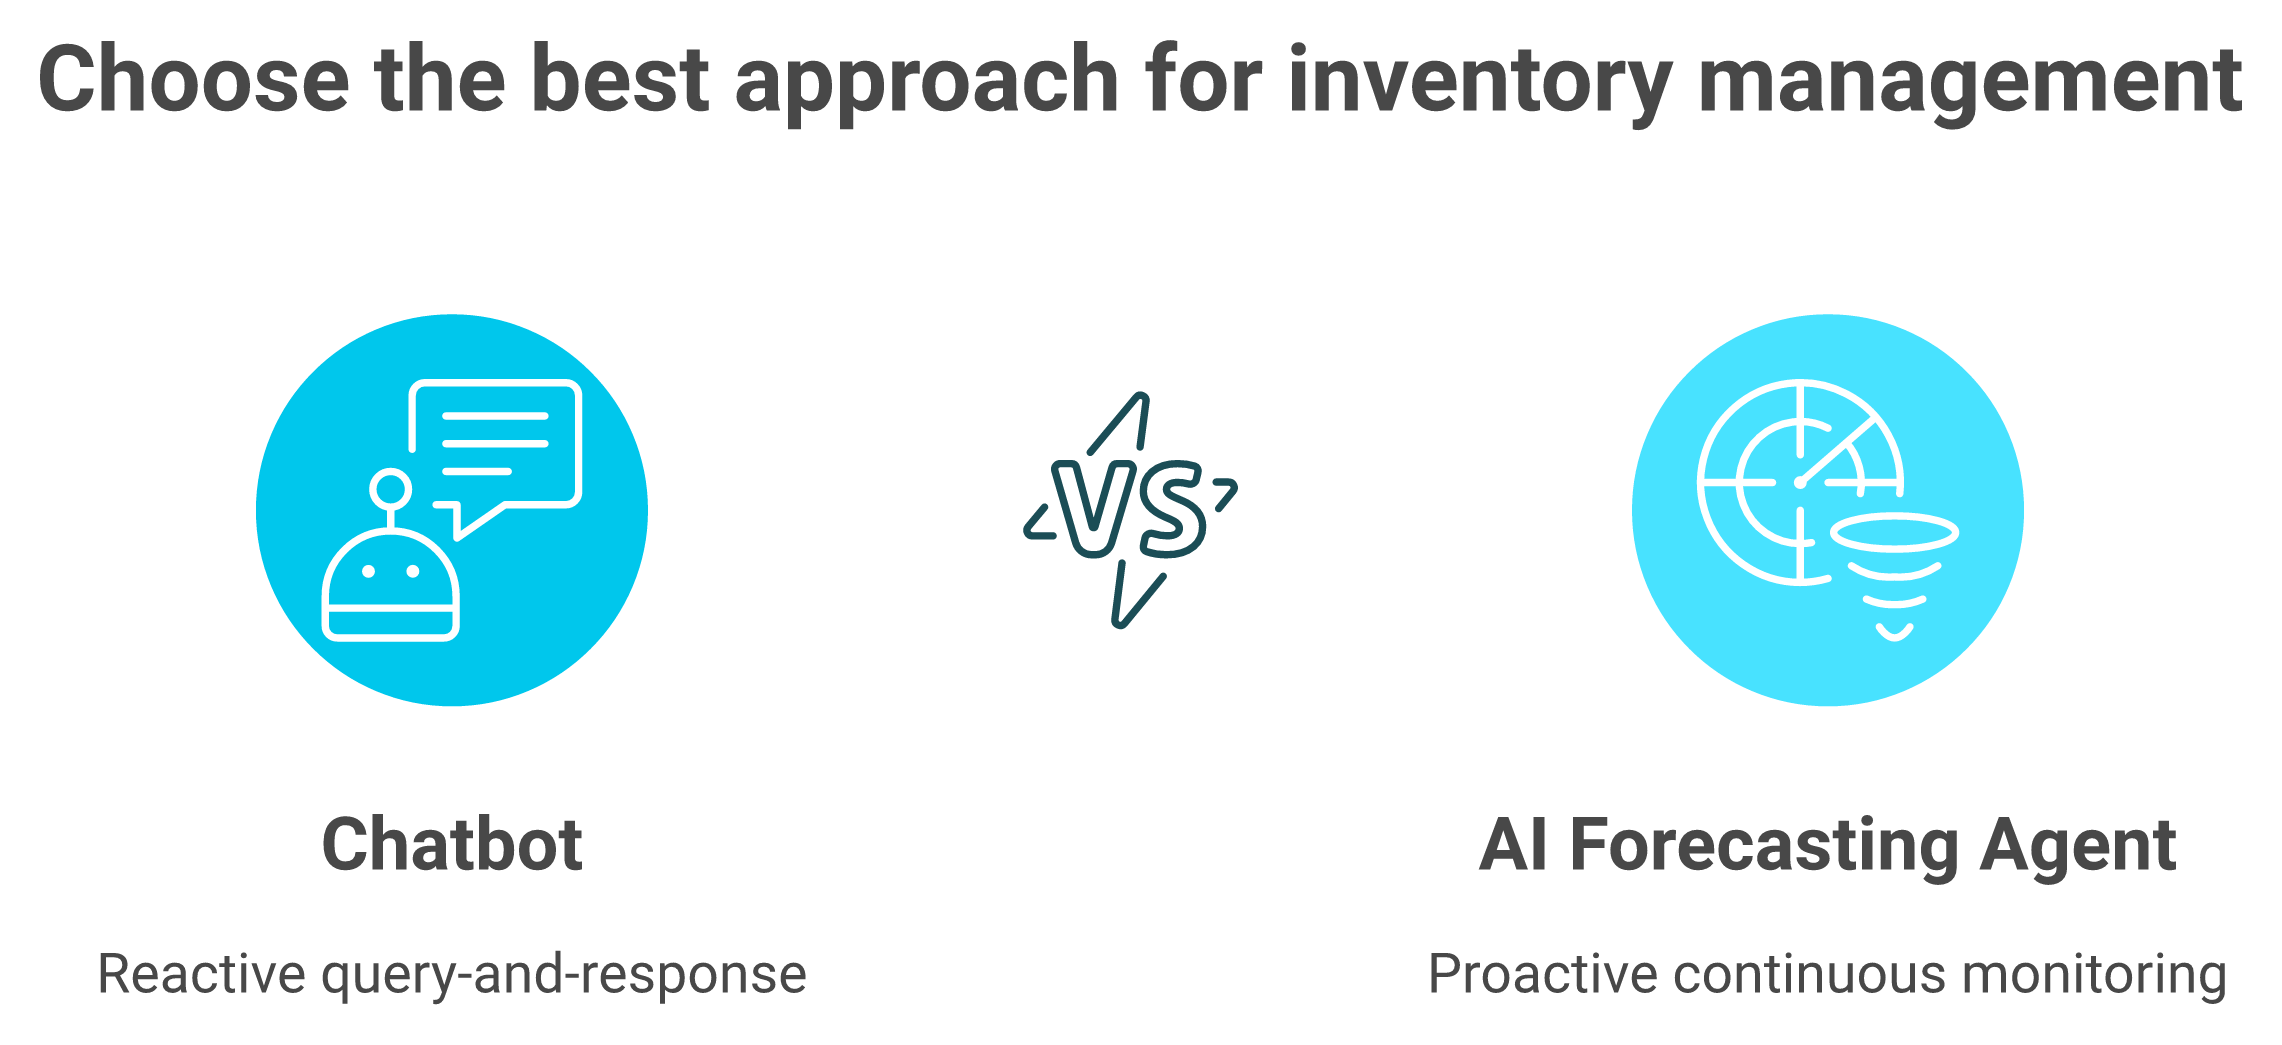
A chatbot is reactive. You ask about blue t-shirts, it pulls a trend line, then waits. An agent is proactive, and Luca AI works this way: it scans store data continuously and pushes alerts to Slack, email, or app when a SKU crosses a threshold. The shift is from query-and-response to continuous monitoring.
The uncomfortable part of the chatbot model is that it puts the burden on you. You have to already suspect a problem to ask about it.
The difference is not the interface. One waits for your question; the other tells you which SKU is about to run out.
❌ You should not need to know the right question
Nobody wakes up thinking "I should check blue t-shirt, size M." That SKU stocks out precisely because it was not on your list.
One operator built his whole reporting philosophy around this. "The data is for the LLM. The LLM digests it, draws conclusions, and tells me what matters. The human readable visualizations are a courtesy, not the substance."
I think that is directionally right, though I would keep the charts. Charts are how you audit the conclusion.
⭐ The behavioural difference, side by side
Chatbot versus forecasting agent behaviour
Behaviour
Chatbot
Forecasting agent
Trigger
You ask
Runs on a schedule
Output
Historical answer
Predicted stockout date plus quantity
Coverage
The SKU you named
Every SKU
Failure mode
Silence
Alert fatigue if thresholds are lazy
Luca AI
Answers plain-English questions
Also pushes periodic reports and outlier alerts
Ask Luca AI to send a weekly reorder report with reasoning and charts, and it arrives without anyone opening a dashboard, which is what conversational analytics for ecommerce looks like in practice.
✅ What a real alert looks like
Descriptive is not the same as prescriptive. One analytics leader framed the shift as moving "from monitoring to recommending," adding, "give me more prescriptive analytics."
An agent alert reads like this: blue t-shirt size M stocks out in 4 days, order 40 units today. Three elements, always. The SKU, the days remaining, the quantity.
Operators are explicit that threshold quality is the whole game.
"You likely need two layers: inventory forecasting/alerts and a more efficient way to address customer inquiries when items are out of stock." — Commenter, r/shopify_growth Reddit Thread
And there is a trap in the data itself, which teaches a naive model that demand fell.
During any free trial, do not ask the tool a question for a full week. Just watch what it tells you unprompted.
If it surfaced a SKU you had not thought about, it is an agent. If your inbox stayed empty, you bought a search box with better manners. This is the single cleanest way to separate real agents for ecommerce from chat wrappers.
Luca AI scans your data 24/7 and pings you when inventory falls below threshold or a metric breaks its usual pattern, rather than waiting to be asked. If you are still shortlisting, the wider field of AI tools for Shopify owners is worth reviewing against that same test.
Q5. What does real SKU-level forecasting require under the hood? [toc=5. Five Modeling Requirements]
Five things: time series decomposition into trend, seasonality, and noise; feature engineering with rolling averages, lags, day-of-week, and promo flags; multi-SKU dependencies for substitution and basket effects; external signals from Instagram, Meta, and search; and continuous retraining as preferences drift. Luca AI's intelligence layer produces 6 to 12 month sales forecasts and scenario simulations from connected store data. A Shopify API call returns history, never a prediction.
Treat this as your vendor checklist. Ask about all five. Watch which one makes the sales engineer change the subject.
⭐ Requirement 1: time series decomposition
Decomposition means splitting sales into three parts. Trend is the slow direction. Seasonality is the repeating shape. Noise is everything else.
Take a candle brand. November is not a trend; it is seasonality. A model that cannot tell them apart will order November volumes in February.
Luca AI studies performance across months and years, which is how a repeating shape gets separated from a real shift in your ecommerce data analytics.
✅ Requirement 2: feature engineering
Features are the inputs you build from raw sales. Rolling averages smooth the line. Lag variables carry last week forward. Promo flags mark the days you discounted.
Without promo flags, your model learns that demand tripled on its own. Next month it orders for a spike that only existed because you ran 25 percent off.
Ask Luca AI why a SKU spiked, and the promotional period gets separated from organic demand.
⚠️ Requirement 3: multi-SKU dependencies
Products do not sell alone. Phone cases pull screen protectors. When blue tees run out, some buyers switch to black and some leave.
This is modeled from transaction patterns, not assumed from a category tree. Guessing the substitution rate is how brands double-order two colors of the same shirt.
Luca AI draws relationships between metrics across sources, which is what surfaces a substitution pattern hiding inside a category total.
💰 Requirement 4: external signals
Instagram engagement, Meta ad delivery, and search interest move before sales do. They give you days of warning, sometimes weeks.
The catch is synchronization. Signals arrive on different clocks and different scales, so they need normalizing before they mean anything, which is the unglamorous half of ecommerce data integration.
One operator I trust put the data-quality point bluntly. "It's no wonder it comes out with stuff that isn't quite right, because we're prompting it on horrendous data sets sometimes." That is the honest failure mode of most forecasting attempts.
⏰ Requirement 5: continuous retraining
Markets move. A model trained on last spring is a museum piece by autumn.
Retraining should be automatic, with drift detection that notices when accuracy slips. Manual retraining never happens, because nobody schedules it.
Shopify's 2026 research found that modeled forecasts cut safety stock by 19.4 percent and stockouts by 28.6 percent against traditional time-series methods. Luca AI measures forecast inputs across the connected sources rather than a single channel export, which is the same reason those gains hold.
❌ Retrieval is not prediction
A chatbot querying Shopify returns 47 units sold and 12 in stock. Correct, historical, and useless for next month.
My read is that this is the single clearest test of a forecasting product. If the number changes when you refresh, it was retrieved, not predicted.
Luca AI is trained on the relationships between ecommerce variables, so it predicts, simulates, and traces root cause instead of formatting an API response. That is the practical line between reporting tools and real predictive analytics for ecommerce.
Q6. Why do naive forecasts recreate the stockout they just predicted? [toc=6. Stockout-Censored Demand]
Because a stockout writes zero sales into your history, and a naive model reads that zero as falling demand, shrinking the next reorder. True demand has to be reconstructed before seasonality is applied. Luca AI runs anomaly detection and root-cause analysis across connected sources, which is how a zero caused by an outage gets separated from a real decline.
This is the failure nobody selling forecasting software mentions. It is also the most common one.
❌ The doom loop, in numbers
Zero sales during an outage is not falling demand. Uncorrected, it is the reason the same SKU runs out again.
Say a SKU sells 40 units a week. It stocks out on a Tuesday and stays out for three weeks.
Your history now shows 40, then 12, then 0, then 0. A moving average reads that as collapsing demand. Your next order is for 15 units, and you stock out again in five days.
Operators catch this before vendors admit it:
"I would also suggest adding another item to your checklist: correction for stockouts. When a popular item goes out of stock, the sales history records 0 sales." — Commenter, r/InventoryManagement Reddit Thread
Luca AI surfaces outliers by analyzing metrics that directly and indirectly affect the pattern, so an outage period reads as an anomaly rather than a trend.
⚠️ Reconstruct first, forecast second
The correct order matters. Flag the out-of-stock window. Estimate what would have sold using comparable weeks. Then apply seasonality to the corrected series.
Skip that sequence and every downstream number inherits the error. Safety stock, reorder point, and the purchase order all shrink together, which quietly distorts your whole ecommerce inventory management plan.
I would also stop trusting any tool that cannot show you which weeks it corrected.
⭐ Not every SKU wants the same model
The gurus make forecasting sound like one clean equation. One operator described that pitch well, saying they "make it sound so simple," as if there were a one-size-fits-all approach.
Seasonal SKUs. Need a seasonal index and multiple years.
Intermittent movers. Sporadic demand needs intermittent-demand methods, not averages.
New SKUs. No history, so forecast from attributes of similar products.
💸 The collapse that hides in a total
A merchant told me about a category that did 20,000 units one year and five the next. Nobody noticed, because another category grew and masked it in the blended total.
That is why data trust breaks. Reviewers of analytics platforms describe the same erosion:
"To make decisions based on grounded data, it is really difficult to trust it 100% and it complicates decision-making." — Verified User in Retail, Google Analytics - G2 Verified Review
"The syncing of data is not very reliable. Even though its the same format but a different date." — Verified reviewer, Supermetrics - G2 Verified Review
Send your vendor one written question: how do you reconstruct demand during out-of-stock windows? Vague answers are the answer.
Luca AI finds the influencing components behind a demand shift, so a category collapse masked by another category's growth surfaces as a root cause instead of a rounding error. Operators comparing options often start with Supermetrics alternatives for ecommerce for exactly this reason.
Q7. What reorder math is the agent actually automating? [toc=7. Reorder Point Math]
Three formulas. Safety Stock equals Z times demand standard deviation times the square root of lead time. Reorder Point equals average daily demand times lead time, plus safety stock. Days Remaining equals on-hand plus inbound, divided by average daily sales. The stockout date is what turns those numbers into an alert.
You do not need to love math. You do need to be able to audit an alert that tells you to spend $8,000.
💰 The three formulas, plainly
Jargon first. Z is a service-level multiplier. Sigma is how much daily demand bounces around. Lead time is days from order to receipt.
Core reorder formulas an AI forecasting agent automates
What you want
How it is calculated
Safety stock
Z x sigma of daily demand x square root of lead time
Reorder point
(Average daily demand x lead time) + safety stock
Days remaining
(On hand + inbound) divided by average daily sales
Date to reorder
Today + (days remaining minus lead time)
That last line is how Jungle Scout's Inventory Manager frames the reorder date for sellers, and it is the cleanest version I have seen.
Ask Luca AI for the days-of-cover position across your catalogue, and the numbers arrive without anyone rebuilding a sheet or a Shopify reporting dashboard.
⚠️ A worked SKU
Take a hoodie selling 20 units a day, with a 30-day lead time. Lead-time demand is 600 units.
Daily demand swings by about 6 units. At a 95 percent service level, Z is 1.65, so safety stock is roughly 1.65 x 6 x 5.48, or about 54 units.
Reorder point lands at 654 units. If you hold 700 with none inbound, you have 35 days of cover and five days of slack.
✅ Fix lead time before anything else
Most bad reorder math is not a model problem. It is a lead-time problem.
Safety stock scales with the square root of lead time. Understate lead time by a week and every buffer in your catalogue is too thin.
Luca AI presents the components behind a specific number, so the recommendation can be checked against your actual supplier history.
⭐ Service level is your decision
The Z-score is not a technical default. It is you deciding how often you accept a stockout.
At 95 percent service level, you plan to run out roughly one cycle in twenty. At 99 percent, you hold far more cash in inventory for a small reliability gain.
My view is that most brands should set service level per SKU, not globally. Your hero product and your slow-moving accessory do not deserve the same buffer.
⏰ What to check this week
Pull your top twenty SKUs by revenue. Fill in actual lead times from the last three purchase orders, not the vendor's quoted number.
Recalculate reorder points with those real numbers. In my experience, that single correction moves more money than switching tools does, and it shows up directly in your ecommerce profit margins.
Luca AI shows the reasoning and the components behind each reorder number, so you can audit the recommendation instead of trusting an output.
Q8. What does the agent's daily run loop look like, and what has to run underneath it? [toc=8. Daily Run Loop]
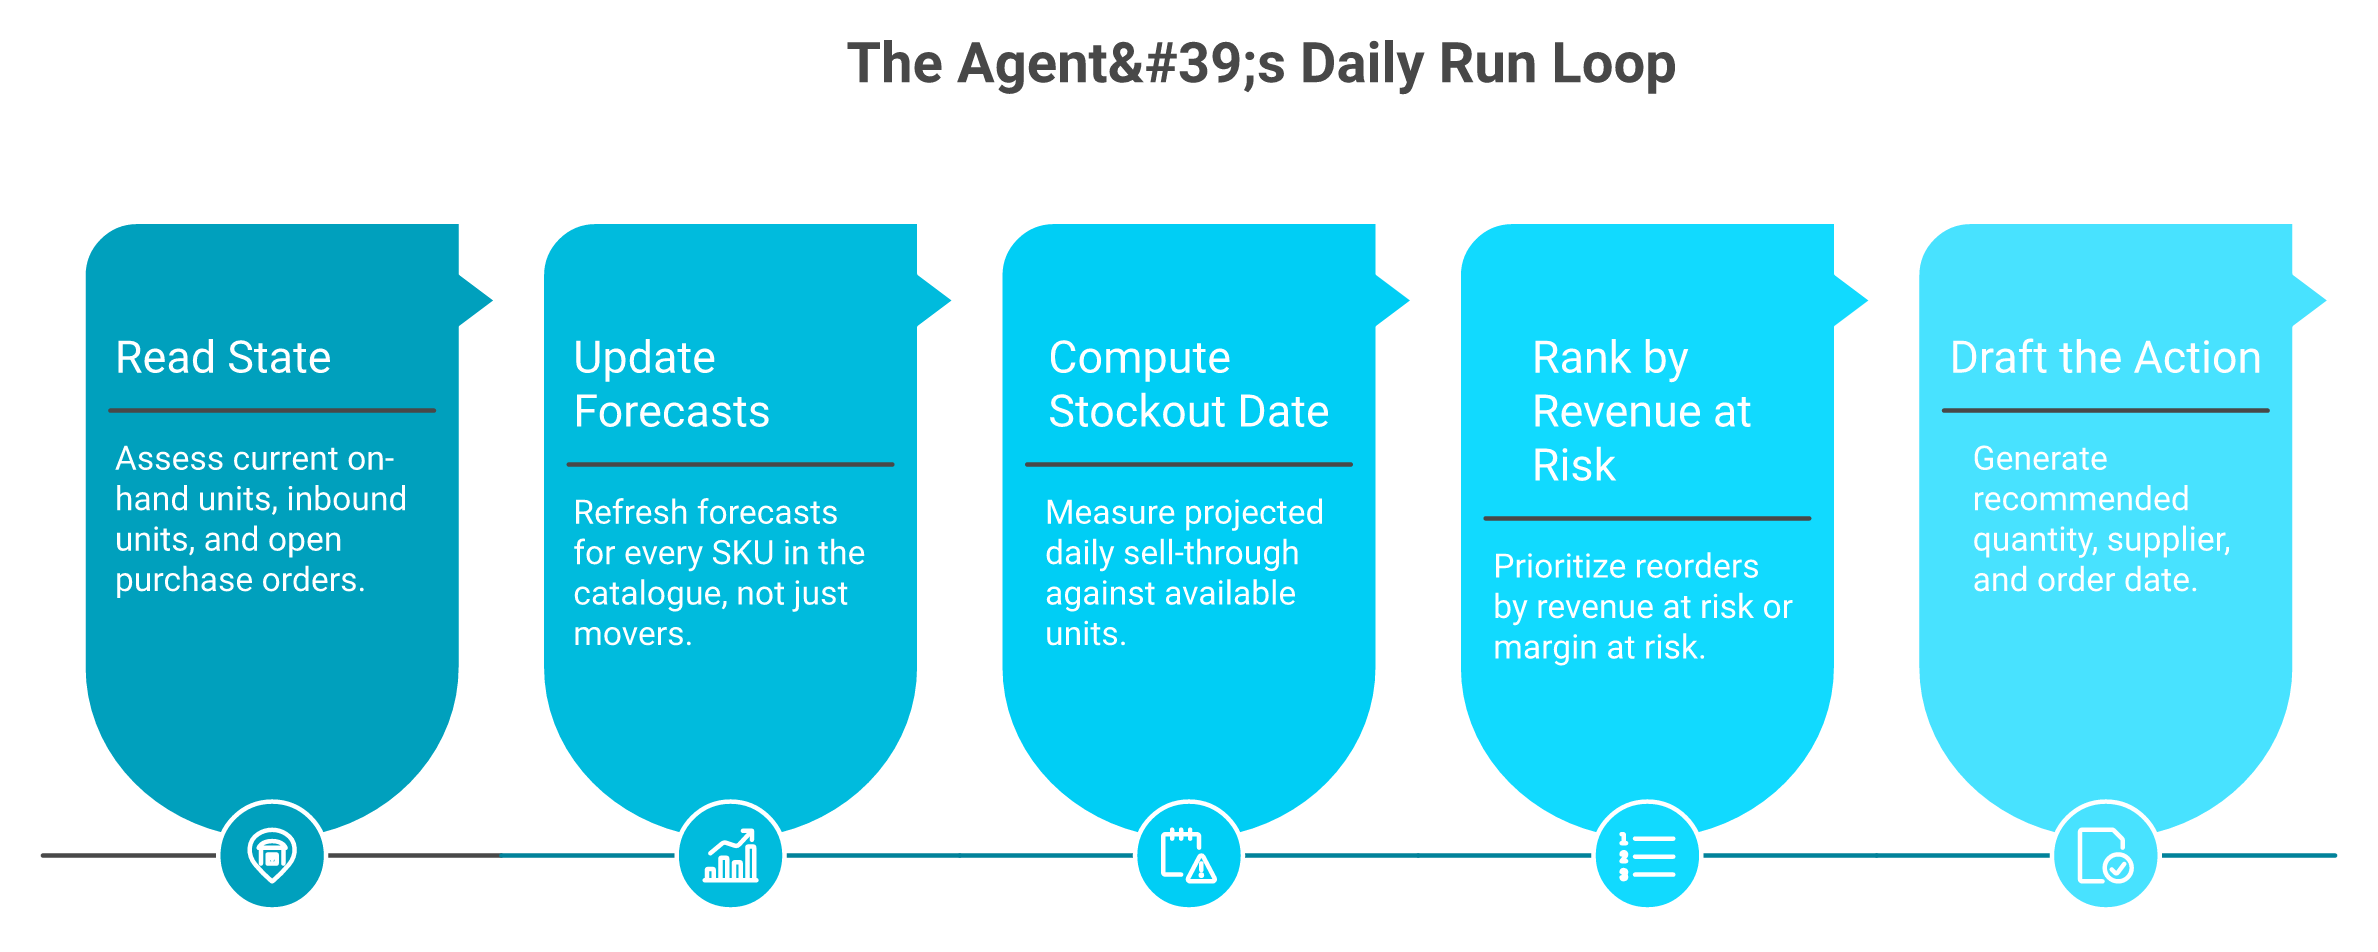
Each morning the agent reads current inventory and inbound units, updates each SKU's forecast, computes a stockout date, ranks SKUs by revenue at risk, and drafts the reorder. Luca AI runs scheduled workflows and pushes insights without being prompted, which is the agentic version of that loop. Underneath sit real-time pipelines, always-on models, per-SKU state, alert logic, and learning from outcomes.
The interface tells you nothing about any of this. Two products can look identical and behave completely differently at 7am.
⏰ The five-step loop, in order
The loop that runs before you open your laptop: read, forecast, project the stockout date, rank by revenue at risk, then draft the order.
Read state. Current on-hand, inbound units, open purchase orders.
Update forecasts. Every SKU, not just the ones that moved.
Compute stockout date. Projected sell-through against available units.
Rank by revenue at risk. A $40 SKU selling 200 a week outranks a $200 SKU selling two.
Draft the action. Quantity, supplier, and the date to place it.
Commercial agents already run this shape. One Shopify-focused agent reads current inventory each morning, predicts when each SKU will stock out, and drafts purchase orders to suppliers.
Luca AI can be given standing tasks, like a weekly reorder report with charts, reasoning, and recommendations, which is what agentic AI for ecommerce founders looks like day to day.
⚠️ Ranking is the step everyone skips
A list of 60 at-risk SKUs is not a decision. It is homework.
Revenue at risk is what makes the list usable. It answers which three reorders matter before Friday.
I would push further and rank by margin at risk where you have clean cost data. Revenue flatters your cheap SKUs.
✅ The infrastructure underneath
Each component has a visible absence symptom.
Agent infrastructure components and their failure symptoms
Component
Symptom when missing
Real-time pipelines
Yesterday's inventory, today's decision
Continuous models
Forecasts only when you ask
Per-SKU state
Repeated alerts for the same SKU
Alert logic
Sixty flags, no priority
Outcome learning
Same wrong recommendation next month
Luca AI normalizes and standardizes data on ingestion across 200+ native connectors, which is what removes the cleanup year before any of this runs.
💸 Why the silos are the hard part
An operator I spoke with described the real blocker clearly. "These systems don't all talk to each other," and going across the silos is "where the real magic starts to happen."
He is right, and it is also why this is expensive to build. Inventory sits in one system, spend in another, and costs in a third, which is the whole argument for consolidating your ecommerce tech stack.
Luca AI maintains business memory across sources, so a forecast reflects what your store did last season rather than what loaded this morning.
❌ The honest part
Building this properly is hard. That is the actual reason most tools are chatbots.
Pipelines break. Connectors change. Alert thresholds need tuning for months before they stop crying wolf.
Shopify App Store listings now describe agents that monitor inventory and generate purchase orders on a set schedule. I think the category is real, though I would not trust any of them unsupervised in month one.
Luca AI runs a persistent context layer with continuous scanning, so forecasts update in the background and alerts arrive in Slack, email, or the app when a threshold breaks. If you are still mapping vendors, the wider set of AI solutions for ecommerce is worth auditing against this same loop.
Q9. Which operator rules should the agent be constrained by? [toc=9. Operator Guardrails]
Forecast at SKU level, never parent level. Hold 90 to 120 days of inventory with turnover between four and six. Discount trend-driven SKUs by roughly 20 percent year on year. Under-forecast seasonal SKUs so they sell out just after peak week. Luca AI supports user-defined alerts on any metric, threshold, or standard-deviation move, which is where those rules get encoded.
An agent optimizes exactly what you tell it to optimize. Give it no rules, and it will happily order 400 units of a dying trend.
⭐ Rule 1: SKU level, never parent level
Parent-level forecasting is the most expensive shortcut in ecommerce. It orders the average and starves the sizes that actually sell.
Josh Hadley, who works with eight-figure sellers, is direct about it: forecast at the child SKU, hold 90 to 120 days on hand, and target inventory turnover between four and six.
Ask Luca AI for product-level performance by variant, and the size curve stops hiding inside a parent total. That level of ecommerce product data management is where most buying errors start.
⚠️ Rule 2: haircut the trend SKUs
Trend products lie to you. Last year's volume is not next year's demand.
Plan trend-driven SKUs at roughly 20 percent below last year. If you are wrong, you reorder. Being wrong the other way means a markdown in March.
✅ Rule 3: aim to sell out just after peak
Perfect seasonal coverage is a trap. Full shelves in January mean cash locked in Christmas stock.
Under-forecast seasonal items slightly so they run dry a week after peak. That sacrifice is smaller than the clearance discount.
Luca AI studies performance across months and years, which is what makes a seasonal index worth trusting inside your ecommerce inventory management plan.
💸 Rule 4: never scale ads into a stockout
This is the highest-leverage guardrail, and almost nobody automates it. Ad spend and inventory should read the same file.
Jungle Scout's 2025 survey of over 1,000 sellers found rising costs and supply pressure dominating seller concerns, with Q4 stockouts costing ranking and wasted spend. Paying for traffic to an out-of-stock page is the purest form of setting money on fire.
Luca AI scans connected data 24/7 and pings you when inventory falls below a threshold or spend efficiency shifts, which is the practical version of AI marketing analytics for ecommerce.
❌ Rule 5: keep a human on QA
One operator watched a major bike brand publish a product image with the rear derailleur mounted on the front wheel. His conclusion stuck with me. "Don't remove the QA. Don't let the AI be the QA."
Buyers disagree on how far this goes. Some argue human feel is irreducible. Others argue machines handle changing SKU volume more reliably than any consultant.
My read is that both are right at different SKU counts. Configuration friction is real, and reviewers of analytics tools name it constantly:
"Some standard reports that were easily accessible in Universal Analytics now require extra configuration." — Aman S., Performance Marketing Head, Google Analytics - G2 Verified Review
"Triple Whale is very user-friendly and easy to navigate to find the data you need across multiple channels." — Verified reviewer, Triple Whale - G2 Verified Review
Ease of navigation is not the same as encoded buying rules. Merchants asking for replenishment tools want the tool to recommend which products to reorder and how much, which is why so many end up scanning Triple Whale alternatives.
Luca AI lets you define the thresholds it watches and the reports it pushes, so your buying rules become the constraints the agent operates inside.
Q10. How do you prove the forecast is actually accurate? [toc=10. Measuring Forecast Accuracy]
Run your agent against a naive baseline, usually last month repeated or last year plus growth, on the same SKUs and the same weeks. Track MAPE for error size, bias for systematic over or under-ordering, and forecast value added for whether the model beat the baseline at all. If it cannot beat the baseline, it is not forecasting.
Vendor accuracy claims are unverifiable by design. You never see the SKUs, the period, or the baseline.
⭐ The three metrics that matter
Jargon defined once, then used.
Forecast accuracy metrics and what each one catches
Metric
What it means
What it catches
MAPE
Mean absolute percentage error
How wrong, on average
Bias
Average signed error
Always over or always under
Forecast value added
Model error versus naive error
Whether the model earns its price
Bias is the one operators skip and pay for. A model with 15 percent MAPE that always under-forecasts will stock you out politely, forever.
Luca AI reports the reasoning alongside each forecast number, which is what makes a like-for-like comparison possible against your existing ecommerce KPIs.
⏰ How to run the test in an afternoon
You do not need a data team for this.
Export 18 months of order history by SKU and week.
Hide the last 12 weeks from yourself.
Build the naive forecast for those weeks (last year plus your growth rate).
Get the tool's forecast for the same weeks.
Compare both against what actually happened.
Do it on your top 30 SKUs by revenue. That is where the money is anyway.
⚠️ Trust breaks when the numbers do not reconcile
This is not a theoretical concern. Analytics buyers describe discovering measurement gaps the hard way:
"When we switched to an enterprise web analytics solution that does no sampling, we found that Google Analytics was telling us we had twice as much traffic as we actually do." — Gitai B., Marketing, Web Analytics, and Testing Lead, Google Analytics - G2 Verified Review
"Sometimes the database pulls incorrect data and I have to keep updating it so that it pulls correctly." — Verified reviewer, Supermetrics - G2 Verified Review
If a tool cannot match your own order export, its forecast is not the problem. Its inputs are, which is an argument for tighter ecommerce data management before you shop for models.
💰 Baseline your stockouts before you switch anything
Write down two numbers today. How many stockout days you had last quarter, and how much cash sits in items with over 180 days of cover.
Those are your before numbers. Without them, any improvement claim in six months is a story.
Shopify's 2026 research reported modeled forecasts cutting safety stock 19.4 percent and stockouts 28.6 percent versus traditional methods. I would treat that as a reasonable target range, not a promise, until your own backtest agrees.
✅ Judgment still gets a vote
Matthew Kidman, who built House of Joppa without debt, put it plainly on the Ecommerce Finance Podcast: forecasting tools help, but judgment still matters.
The measurement step is how judgment gets a number attached to it. You stop arguing about whether the tool is good and start reading the error.
Luca AI's forecasts are auditable because the influencing components are surfaced with the output, so a backtest against your own history is a report, not a research project.
Q11. How much autonomy should the agent get, and in what order? [toc=11. Path to Autonomy]
Three stages. Stage 1 is proactive alerts with confidence levels that you review and execute. Stage 2 is selective autonomy, where it acts above 85 percent confidence and under 500 dollars order value, reviewed after the fact. Stage 3 is expanded autonomy on routine reordering with weekly review. Luca AI runs a progressive autonomy model set by you per action type.
Nobody hands purchase-order authority to software in week one. Nor should they.
⏰ Stage 1: proactive alerts
The agent monitors everything and flags what matters. Each alert carries a recommendation and a confidence level.
You execute manually. Both sides learn. You learn which alerts are real, and it learns which recommendations you accept.
Luca AI pushes periodic reports and outlier alerts to Slack, email, or the app, which is exactly this stage in practice, and the reason ecommerce monitoring tools earn their keep before any automation does.
✅ Stage 2: selective autonomy
Now you pick a lane where mistakes are cheap. Something like this: act automatically if confidence exceeds 85 percent and order value stays under 500 dollars.
You review after the fact, weekly. Your attention moves to the exceptions and the low-confidence calls.
Autonomy stages, decision ownership, and review cadence
Stage
Who decides
Review cadence
1
You, every time
Daily alerts
2
Agent, inside limits
Weekly, after the fact
3
Agent, routine reorders
Weekly performance review
Luca AI
You, per action type
Configurable, insight through approval-gated action
⚠️ Stage 3, and the disagreement worth knowing about
Stage 3 means routine reordering runs itself while you handle strategy and odd situations.
Operators split hard here. One leader I spoke with insists on human review before anything ships. Another argues you cannot keep tight guardrails while you are still learning what the tools can do.
Luca AI's autonomy levels are set per action type, which lets both philosophies coexist inside one store. It is the same staging logic behind sensible agentic AI for ecommerce founders.
❌ Nothing here is set-and-forget
Buyers of data tooling say this better than any vendor:
"This can absolutely get you what you need for your data, but know it is not a 'set it and forget it' platform." — Verified reviewer, Supermetrics - G2 Verified Review
"The tool promises a robust series of direct connectors; however, the connectors rarely update without breaking." — Verified reviewer, Supermetrics - G2 Verified Review
Merchants stage their trials for this reason. On the Stocky migration threads, operators describe moving one workflow at a time and reporting back on what held.
💰 Trust is earned by catches, not claims
You will know it is working when it flags a SKU that was not on your radar. That moment is worth more than any accuracy percentage.
Ask Luca AI to study a pattern and warn you when it breaks, and the catches start arriving without you opening anything.
What I think shifts by 2027 is the default. Reordering becomes something you supervise rather than something you do, and the operator's job becomes writing better rules for your ecommerce growth strategy.
I am still unsure where the line lands for seasonal buys, where one bad call costs a quarter. If you have run an agent through a full peak season, I would genuinely like to hear what broke.
Luca AI runs from insight-only through approval-gated action, so the agent earns each increment of authority against your own review record.
FAQ's
Can AI actually predict stockouts before they happen?
Yes, and the mechanism is simpler than most vendors make it sound. An agent projects each SKU's daily sell-through against on-hand plus inbound units, computes a stockout date, and flags any SKU whose stockout date falls inside supplier lead time plus a safety buffer.
The output should read like an instruction, not a chart. Three elements, always:
The SKU, at variant level rather than parent level.
Days remaining, based on current velocity and inbound stock.
The quantity and date to place the order.
What separates a working system from a demo is coverage. A chatbot answers about the SKU you thought to ask about. An agent watches all of them, which matters because the SKU that stocks out is almost always the one that was not on your list.
Luca AI scans connected store data 24/7 and pushes alerts to Slack, email, or the app when inventory falls below a threshold or a metric breaks its usual pattern. We treat that as the baseline behaviour, not a premium feature. If you want the fuller mechanics of how proactive agents differ from query tools, our breakdown of agents for ecommerce walks through the run loop step by step.
How much sales history do we need before AI demand forecasting beats a spreadsheet?
Plan on 6 to 12 months of clean order history before machine learning reliably beats a simple moving average, and 12 to 24 months before seasonal patterns become trustworthy. Seasonality needs at least two comparable cycles to separate a repeating shape from a real trend.
SKU count matters just as much as history length:
Under 50 active SKUs. A spreadsheet still wins. Modeling adds cost, not accuracy.
50 to 100 SKUs. The grey zone, where long lead times tip the decision.
Over 100 SKUs. Weekly reorder judgements exceed what one operator can hold, and accuracy collapses without automation.
New SKUs are the honest exception. With no history at all, no model can forecast them from sales data, so they need attribute-based estimates from comparable products plus a deliberately conservative first order.
Luca AI studies performance across months and years, which is precisely why thin history limits what any forecast can honestly claim. We would rather tell an operator to wait a quarter than sell a confident number built on four months of noise. If you are still assembling that history across sources, our guide to ecommerce data integration covers what to connect first.
Why does our forecast keep shrinking after a stockout?
Because a stockout writes zero sales into your history, and a naive model reads that zero as falling demand. The next reorder shrinks, and you stock out again faster than before.
Here is the loop in numbers. A SKU sells 40 units a week, stocks out on a Tuesday, and stays out for three weeks. Your history now reads 40, 12, 0, 0. A moving average sees collapsing demand and recommends 15 units. Five days later you are out again.
The fix is sequencing, and it happens before any seasonality is applied:
Flag the out-of-stock window explicitly.
Reconstruct what would have sold using comparable weeks.
Then apply trend and seasonal adjustment to the corrected series.
Skip that order and every downstream number inherits the error. Safety stock, reorder point, and the purchase order all shrink together.
Luca AI runs anomaly detection and root-cause analysis across connected sources, which is how a zero caused by an outage gets separated from a real decline. We think this is the single best written question to send any vendor before you sign. For the wider set of patterns worth auditing, see our notes on predictive analytics for ecommerce.
What reorder math should an AI forecasting agent show us?
Three formulas, and you should be able to see all of them behind any alert that tells you to spend money.
Safety stock equals Z (your service-level multiplier) times the standard deviation of daily demand, times the square root of lead time.
Reorder point equals average daily demand times lead time, plus safety stock.
Days remaining equals on-hand plus inbound, divided by average daily sales.
A worked example makes it concrete. A hoodie sells 20 units a day with a 30-day lead time, so lead-time demand is 600 units. Daily demand swings by about 6 units. At a 95 percent service level, Z is 1.65, giving roughly 54 units of safety stock and a reorder point near 654 units.
Two inputs cause most bad recommendations. Lead time is usually understated, and safety stock scales with its square root, so a one-week error thins every buffer in the catalogue. Service level is the second: it is a business decision per SKU, not a model default.
Luca AI presents the components behind each reorder number, so the recommendation can be checked against your actual supplier history rather than accepted on faith. Our wider view on ecommerce inventory management covers where those inputs usually break.
How much autonomy should we give an inventory agent, and how do we prove it works first?
Stage it, and make the agent earn each increment. Three stages work well:
Stage 1, proactive alerts. It flags issues with confidence levels; you review and execute every time.
Stage 2, selective autonomy. It acts only inside limits you set, for example above 85 percent confidence and under 500 dollars order value, reviewed weekly after the fact.
Stage 3, expanded autonomy. Routine reordering runs itself while you handle seasonal buys and exceptions.
Proof comes before authority. Export 18 months of history, hide the last 12 weeks from yourself, build a naive forecast for those weeks, then compare both against what actually happened on your top 30 SKUs by revenue. Track MAPE for error size, bias for systematic over or under-ordering, and forecast value added to see whether the model beat the baseline at all.
Also record two before numbers: stockout days last quarter, and cash sitting in items with more than 180 days of cover. Without them, any improvement claim six months later is a story.
Luca AI runs a progressive autonomy model from insight-only through approval-gated action, configured per action type. Our approach to agentic AI for ecommerce founders explains why we start there deliberately.
Enjoyed the read? Join our team for a quick 15-minute chat — no pitch, just a real conversation on how we’re rethinking Ecommerce with AI - Luca
Loading Schedule...
Your AI Co-Founder is here.
Here’s why:
Shopify, Meta, Xero - one brain.
"Should I scale?" Answered with real data.
Growth capital. No applications. One click.
Thank you! Your submission has been received! Please book a time slot for the Meeting
Oops! Something went wrong while submitting the form.