.svg)
.svg)

Q1. Why does growing your ecommerce store make everything feel worse, not better? [toc=1. The Scaling Trap]
Because topline growth multiplies every hidden problem instead of solving it. More orders mean more cash trapped in inventory, more returns eating margin, and more dashboards to reconcile at 11pm. Growth without a profit and cash lens just makes you a busier version of broke. This article fixes that with three sequenced moves: convert more of the traffic you already pay for, retain more of the customers you already won, and expand margin before you spend another dollar on acquisition.
📉 The revenue chart goes up, so why does the bank account go sideways?
I have watched a founder doing $400K a month pull up a revenue chart that only goes up and to the right. Then she opened her bank balance, and her face changed. Sales had doubled. Her cash had not moved.
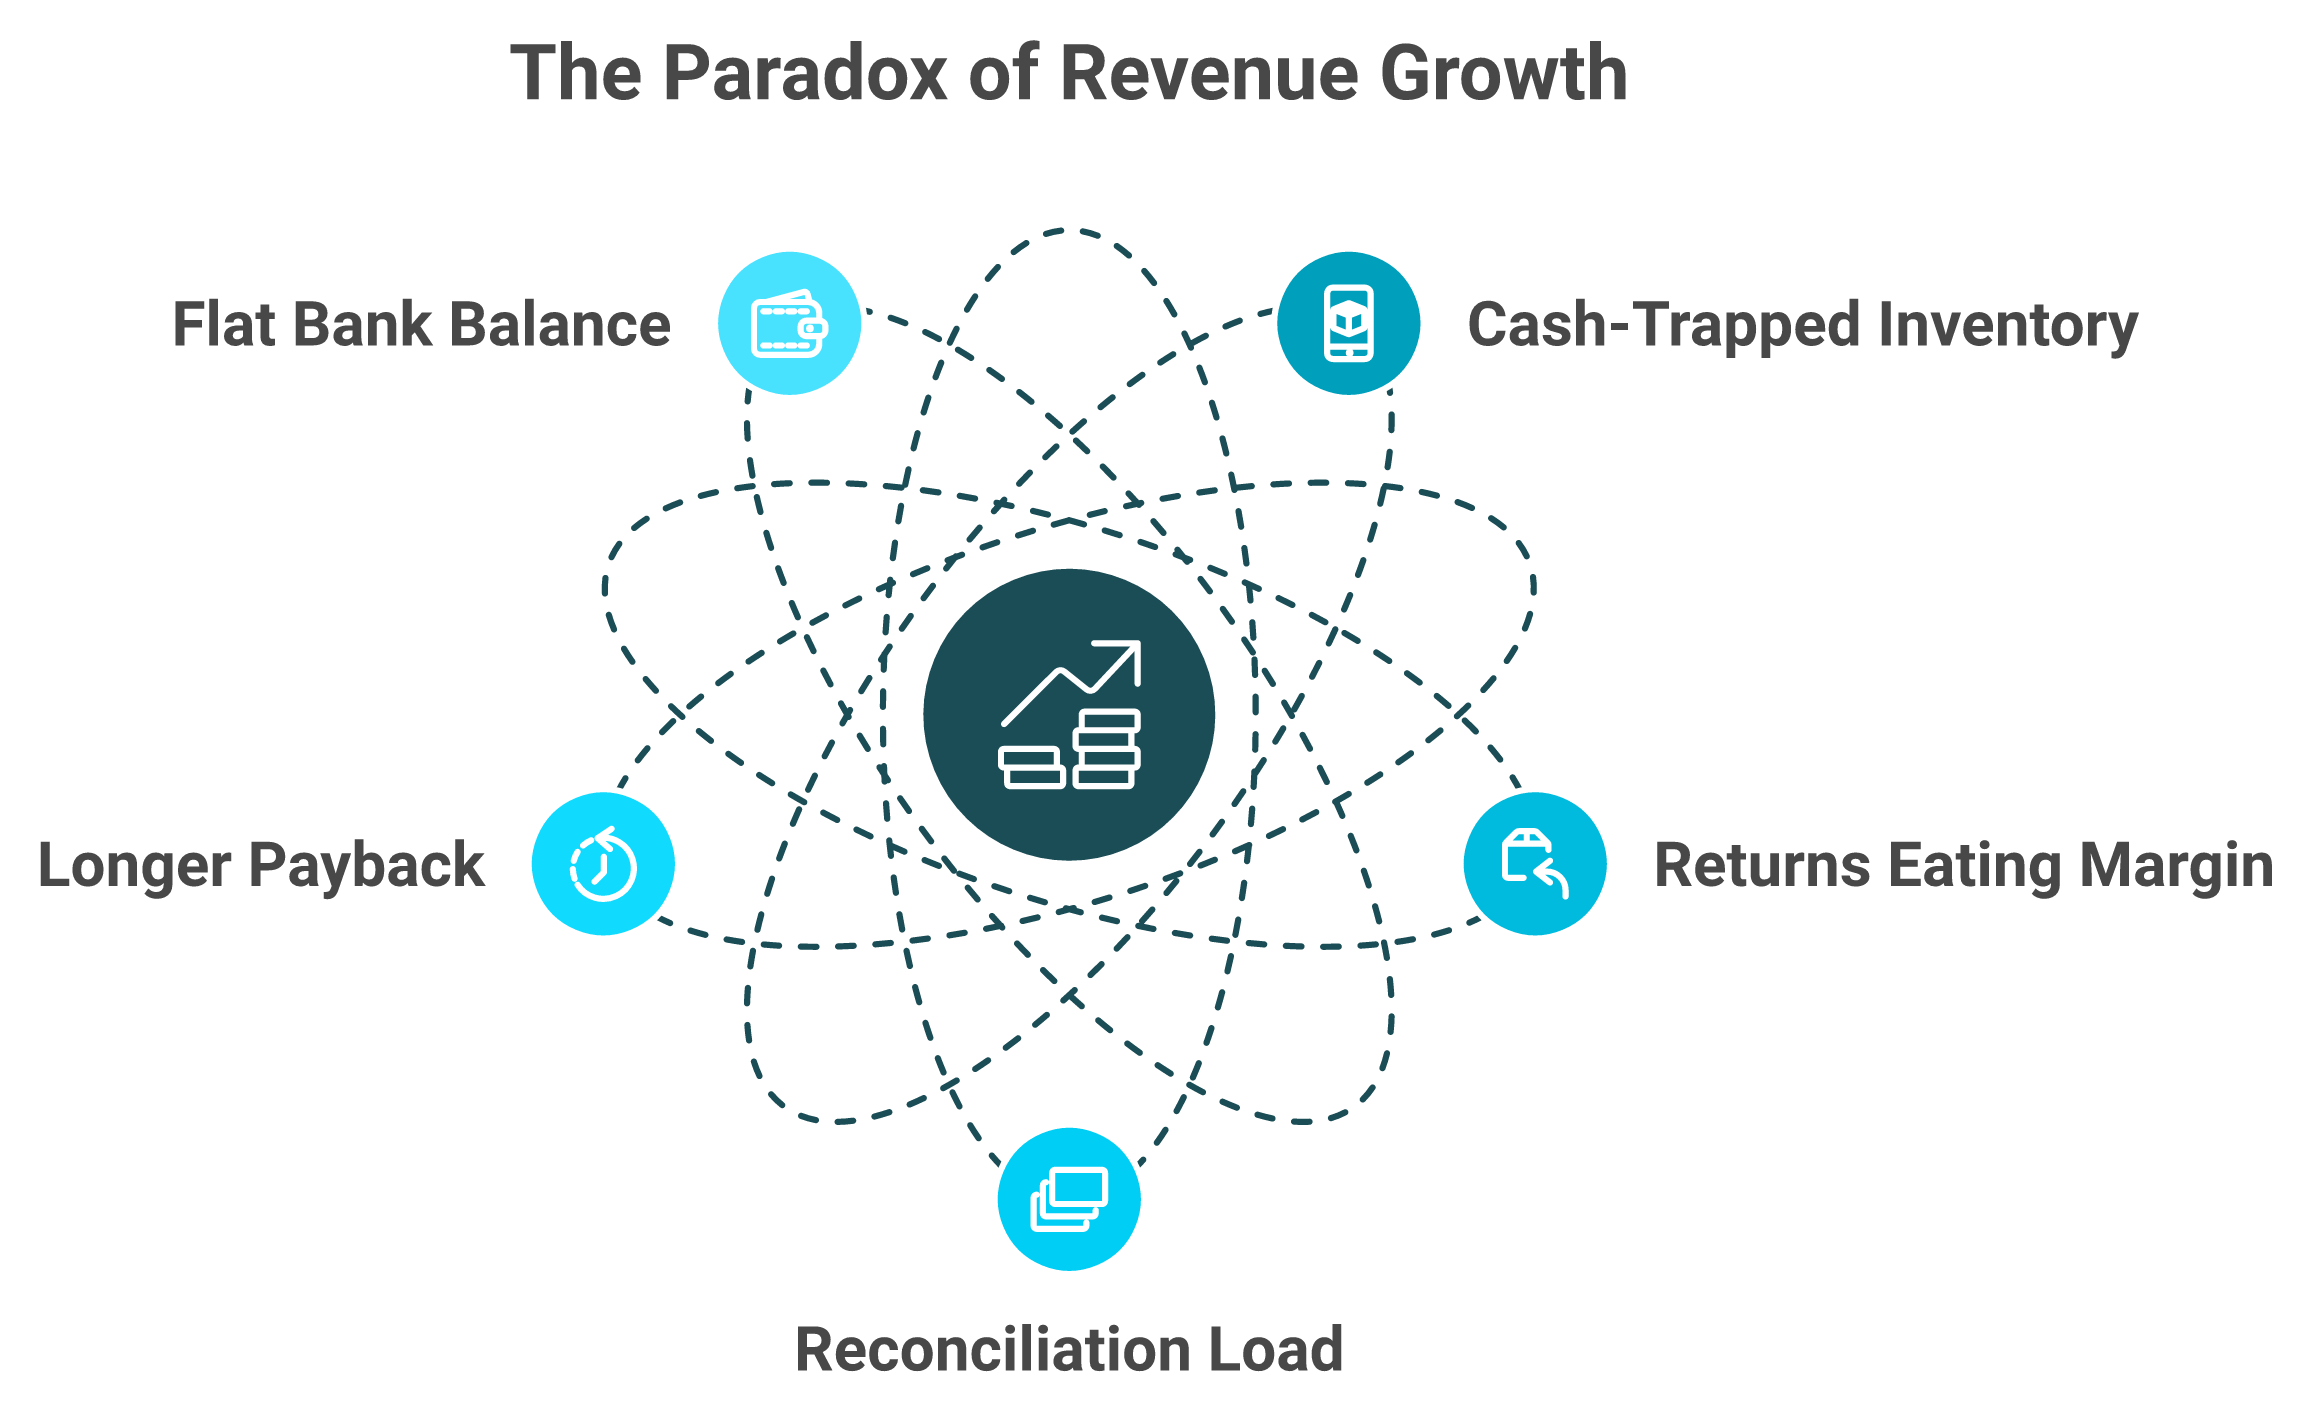
That gap is the whole story of scaling. You feel the orders. You feel the Slack pings. You do not feel richer. Most founders I sit with call this "busy," when the honest word is "trapped." Topline growth is masking the problem, not fixing it. This is exactly the trap we unpack in why e-commerce founders are drowning in data.
⏰ The Monday-morning grind nobody warns you about
Here is the scene I see most. On a Monday, you pull your standard ecommerce reports. Exports from Shopify. Exports from your returns system. Exports from Meta. You stitch them by hand. By the time the numbers agree, half the day is gone.
That ritual feels like control. It is the opposite. You are reporting on the past while cash quietly leaks in the present. The average ecommerce business takes about 12 months to break even on a new customer, so a "good growth month" can mean you just signed up for a year of carrying cost. A unified cash flow forecast for e-commerce changes how that month reads.
🎨 You are reading a Van Gogh through a magnifying glass
A growth consultant I respect, Kunle Campbell, once helped a top-20 UK pure-play brand double its traffic in 12 months. The commercial payoff was only a 30% revenue uplift. Double the traffic, a third of the lift. That gap is what zooming in on one metric does to you.
He described ecommerce growth as beautifully cross-functional, like looking at a Van Gogh through a magnifying glass fixed on one square inch. Stare at traffic alone and you miss the synchronicities, the way conversion, retention, and margin move together. My read, and I could be off in your specific case, is that almost every "we grew but it hurts" story traces back to this single-lens habit.
So this article is not another tactic dump. It is three sequenced levers, in order. Convert more of the traffic you already pay for. Retain more of the customers you already won. Then expand real margin before you spend another dollar acquiring strangers. Pull them in that order, and growth starts feeling like profit instead of pressure.
Q2. What actually counts as an ecommerce growth strategy (and what's just a tactic)? [toc=2. Strategy vs Tactic]
An ecommerce growth strategy is a sequenced system for compounding profit across three levers: converting the traffic you already pay for, retaining the customers you already won, and expanding margin on every unit you sell. A tactic is a single move ("run a giveaway," "add an upsell"). A strategy knows which lever to pull, in what order, at your stage, and what number proves it worked. Product validation, content, and search are inputs that feed these three levers, not separate strategies.
🧩 A tactic is a move. A strategy is the order you make them in.
Most "growth strategy" posts are tactic piles. Seventeen ideas, no sequence. That is like handing someone a toolbox and calling it a house.
A tactic is "run a giveaway." A strategy is knowing that the giveaway only matters after your checkout converts and your margin survives the discount. The difference is order and proof, not effort.
🚂 The two-train-tracks test
Picture your business as two train tracks. One track is inventory. The other is cash. They have to run in parallel. The moment they diverge, you derail, you are either out of stock on winners or out of cash on losers.
A real strategy keeps both tracks in view at once. That is why I anchor everything to three levers that each touch cash and customer together:
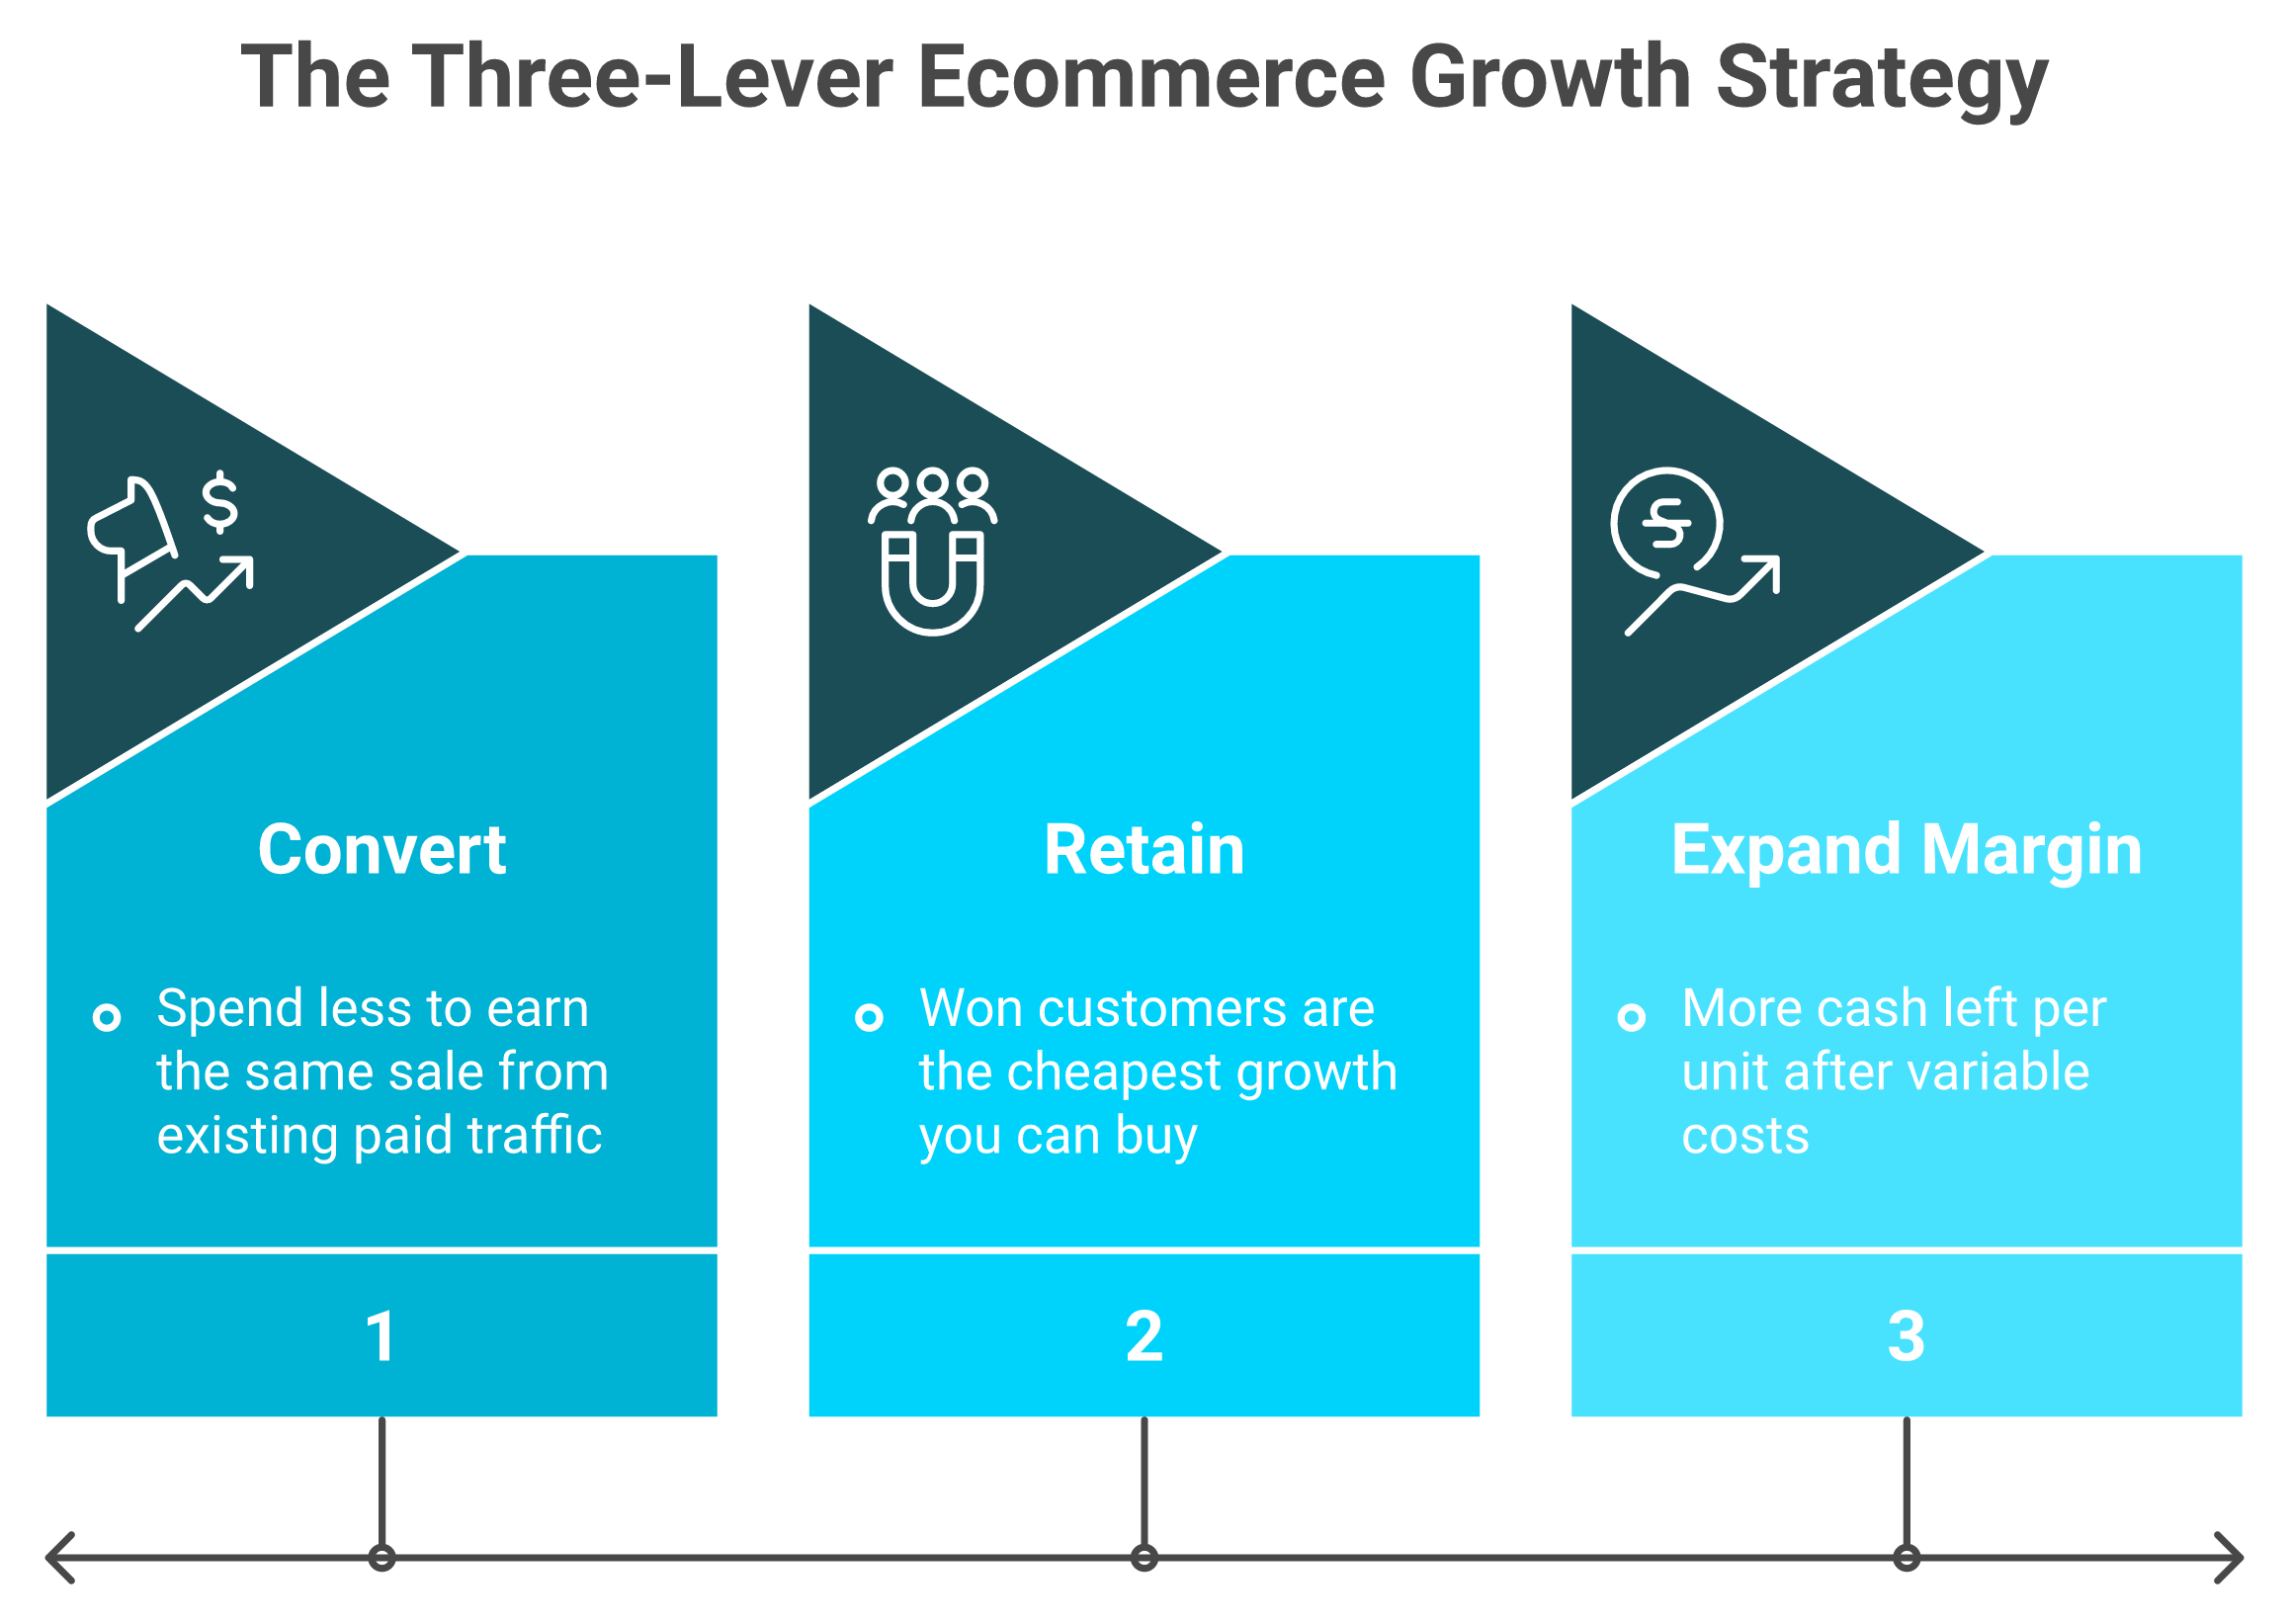
- Convert more of the paid traffic already hitting your site, so you spend less to earn the same sale.
- Retain more of the customers you already won, because they cost nothing new to acquire.
- Expand margin per unit, so every sale leaves more cash on the track.
🔍 Where do product, content, and SEO fit?
Here is where I take a position the listicles avoid. Product validation, storytelling, and paid plus organic search are not separate strategies. They are inputs that feed the three levers.
Good content and search feed the convert lever by sending warmer traffic. A sharp offer feeds retain by giving people a reason to come back. None of them is a growth strategy on its own. They are fuel, and fuel only matters once you know which engine you are pouring it into.
📐 The one-line stage rule
So which lever leads? It depends on your stage, and the rule is simple. Under roughly $500K, lead with convert and margin, because you cannot afford waste. Between $500K and $5M, retention and margin compound fastest.
The catch is visibility. To know which lever is actually moving, you need marketing, finance, and inventory numbers in one place, not in eight tabs you reconcile by hand. That cross-functional view is exactly the gap most stores never close, and it is the thing a tool like Luca is built to collapse into a single question, the way we describe across our use cases.
Q3. Strategy 1: How do you convert more of the traffic you already pay for? [toc=3. Convert More Traffic]
Before buying more traffic, squeeze the traffic you have. A 1-second page-load delay cuts conversions by about 7%, and roughly 70% of carts get abandoned when checkout feels long. Fix speed, make navigation findable in under 30 seconds, add dynamic homepage content that adapts to behavior, and align your search traffic to the right landing pages. Then run a cheap smoke-test before you scale any new idea, the most overlooked system on a Shopify store.
💸 You are already paying for the fix
Most founders react to flat sales by buying more traffic. That is the expensive door. The cheap door is the traffic already landing on your site and bouncing.
A founder told me last week he was about to triple his Meta budget. His product page took four seconds to load. He was paying to send people to a door that sticks.
⏱️ Speed and friction are conversion taxes
The math here is not soft. A one-second delay in page load can slash conversions by about 7%. At eBay's scale, every 100 milliseconds of speed improvement lifted "Add to Cart" by 0.5%.
Checkout is the other leak. Roughly 70% of carts get abandoned, and a big chunk of that is a checkout that feels too long. Your navigation should be so intuitive that a first-time visitor finds what they want in under 30 seconds. These are not branding choices. They are taxes on every dollar of traffic you already bought. Reading them well starts with proper ecommerce website analytics.
🎯 Match the message, then personalize the page
Dan Turner, who helped scale MX Store past $100M, drove roughly 10x return on ad spend (ROAS, revenue divided by ad spend) with one discipline: the keyword, the ad, and the landing page all said the same thing. Misaligned search traffic is just expensive bouncing. That is the same logic behind marketing analysis and automation.
The last upgrade is dynamic content. Your homepage can change based on visitor behavior, giving a returning buyer a near one-on-one experience instead of a generic shelf. Small lift, compounding return.
🧪 The smoke test, the cheapest system you are not running
Here is the move I would run this week. Before you scale any new idea, a product, an offer, a landing page, prove it the cheapest way possible first. Run a small "smoke test," a tiny live test that measures real intent before you commit inventory or budget.
It is one of the simplest and most overlooked systems for a Shopify brand. But a smoke test only tells the truth if you read the full result, not just the conversion bump. A page can convert better and still lose money once returns and repeat behavior come in. Reading that true result across margin and repeat purchase is exactly where an analytics layer like true profitability instead of platform ROAS earns its keep, it ties the test to contribution, not just clicks.
Operators are blunt about why they stopped trusting their dashboards for this:
"Daily revenue totals are wrong, entire order blocks are missing... Triple Whale shows orders from external marketplaces as if they were real conversions even though these orders never go through our Shopify store. Completely fake data."
— XTRA FUEL Triple Whale Trustpilot Verified Review
"It has been unable to deliver on the promise to provide any insights or accurate data to our business, and we end up reverting back to direct data sources like Meta, Shopify, Recharge, etc."
— Matt Huttner Triple Whale Trustpilot Verified Review
When your conversion data is wrong, every scaling decision built on it is wrong too. A reliable Shopify analytics dashboard is the foundation.
Q4. Strategy 2: How do you retain more of the customers you already won? [toc=4. Retain More Customers]
Retention beats acquisition because the customer already trusts you. Top brands pull 30-50% of revenue from email and SMS, yet most operators keep chasing new buyers. The highest-leverage retention move is often counterintuitive: getting a customer to buy a second product category can lift their lifetime value 50-100%. Reduce churn with "give them more of what they already subscribe for" offers, the way Brez cut churn from 24% to 17%.
🔁 The acquisition treadmill is the most expensive habit in ecommerce
Rising costs to acquire a customer (CAC, your total acquisition spend divided by new customers) is the quiet killer. I have watched blended CAC climb from the low $20s into the $40s in a single year for clean DTC brands. The treadmill speeds up and the cash gets thinner.
The customer you already won is the cheapest growth you will ever buy. They trust you. They have your card on file. Yet most stores spend 90% of their energy chasing strangers.
📧 Email and SMS are a revenue engine, not a newsletter
Top brands pull 30-50% of revenue from email and SMS. That is not a nice-to-have channel. That is a third to half the business.
A Shopify email consultant I trust put it simply: a small, engaged list converts at 8-15%, and a tight three-email flow often beats a bloated ten-email one. Engagement beats volume. You do not need a bigger list, you need a list that opens. Tracking that lift well calls for the right Shopify analytics apps.
🧠 The LTV mirage: it is not what you think
Here is the contrarian piece. I would have bet that lifetime value (LTV, total profit a customer brings over their relationship with you) climbs by getting people to buy more often. From what surfaces when you actually run the cohort numbers, that is backwards.
One brand found that product category diversity was the leading LTV driver. Anybody who bought body care jumped 50-100% in LTV. The standard read, "increase purchase frequency," missed it entirely. Spotting a pattern like that means analyzing cohorts across categories, the kind of cross-cut most operators cannot run without a data analyst. This is the exact job data analysis and deep industry research does as an AI layer over your data: it finds the influencing variable, surfaces the root cause, and pings you proactively instead of waiting for you to think to ask.
🎁 The Brez churn fix: give them more of what they bought
Brez, a fast-growing beverage brand, had a subscription churn rate sitting at 24%. They cut it to 17% with one move: stay subscribed past day 27, and you could win five free cases.
Read what they did. They did not bribe people with discounts that wreck margin. They gave more of the exact product the customer already subscribed to get. The retention play that works is rarely a coupon. It is removing the reason to leave.
The Monday move: build a three-email post-purchase flow, then test one cross-category offer. Watch your 30-day repeat-purchase rate. If it clears the low 20s as a percentage, retention is pulling its weight, and you have earned the right to scale acquisition again. Knowing your real numbers depends on the best way to track e-commerce unit economics.
Operators describe what happens when the data they retain on is not trustworthy:
"I moved my content_for_header without being fully aware what it does, and it broke my analytics. It's been moved back but my analytics haven't turned back on... Support is directing me to utilize an expert."
— Anonymous, r/shopify Reddit Thread
"I run a small ecommerce store and I'm trying to improve conversions. I've been looking at analytics... Reviews are mixed and sometimes feel fake."
— Anonymous, r/ShopifyeCommerce Reddit Thread
Retention strategy is only as good as the cohort data underneath it.
Q5. Strategy 3: Why is your gross margin lying to you, and how do you expand real margin? [toc=5. Expand Real Margin]
Gross margin is a lie because it only tells you what the product costs to make, not what it costs to sell. The "best seller" at 72% gross margin can collapse to 8% contribution margin once you load shipping, returns, and acquisition. Returns alone can cost about $6.20 per unit sold once spread across the catalog. Expand real margin by pricing for the "sting," cutting unprofitable SKUs, and counting CAC as the variable cost it actually is.
💸 The number on your P&L is hiding the truth
Most founders make decisions on gross margin. Gross margin only tells you what it costs to make the thing. It tells you nothing about what it costs to sell it.
That gap is where stores quietly bleed. Shipping, returns, processing, and acquisition all hit after the "make" cost. Contribution margin (what is left from a sale after every variable cost of selling it) is the number that actually pays your rent. Getting it right is the core of the best way to track e-commerce unit economics.
😢 The invoice that made a founder cry
I sat with a founder who slid an invoice across the table. "This is our best seller," she said. "72% gross margin." She was proud, and she had every right to be on paper.
Twenty minutes later, she was crying. We calculated her actual contribution margin line by line, cost by cost. The "72%" product was running at 8%. The hero SKU was barely paying for itself.
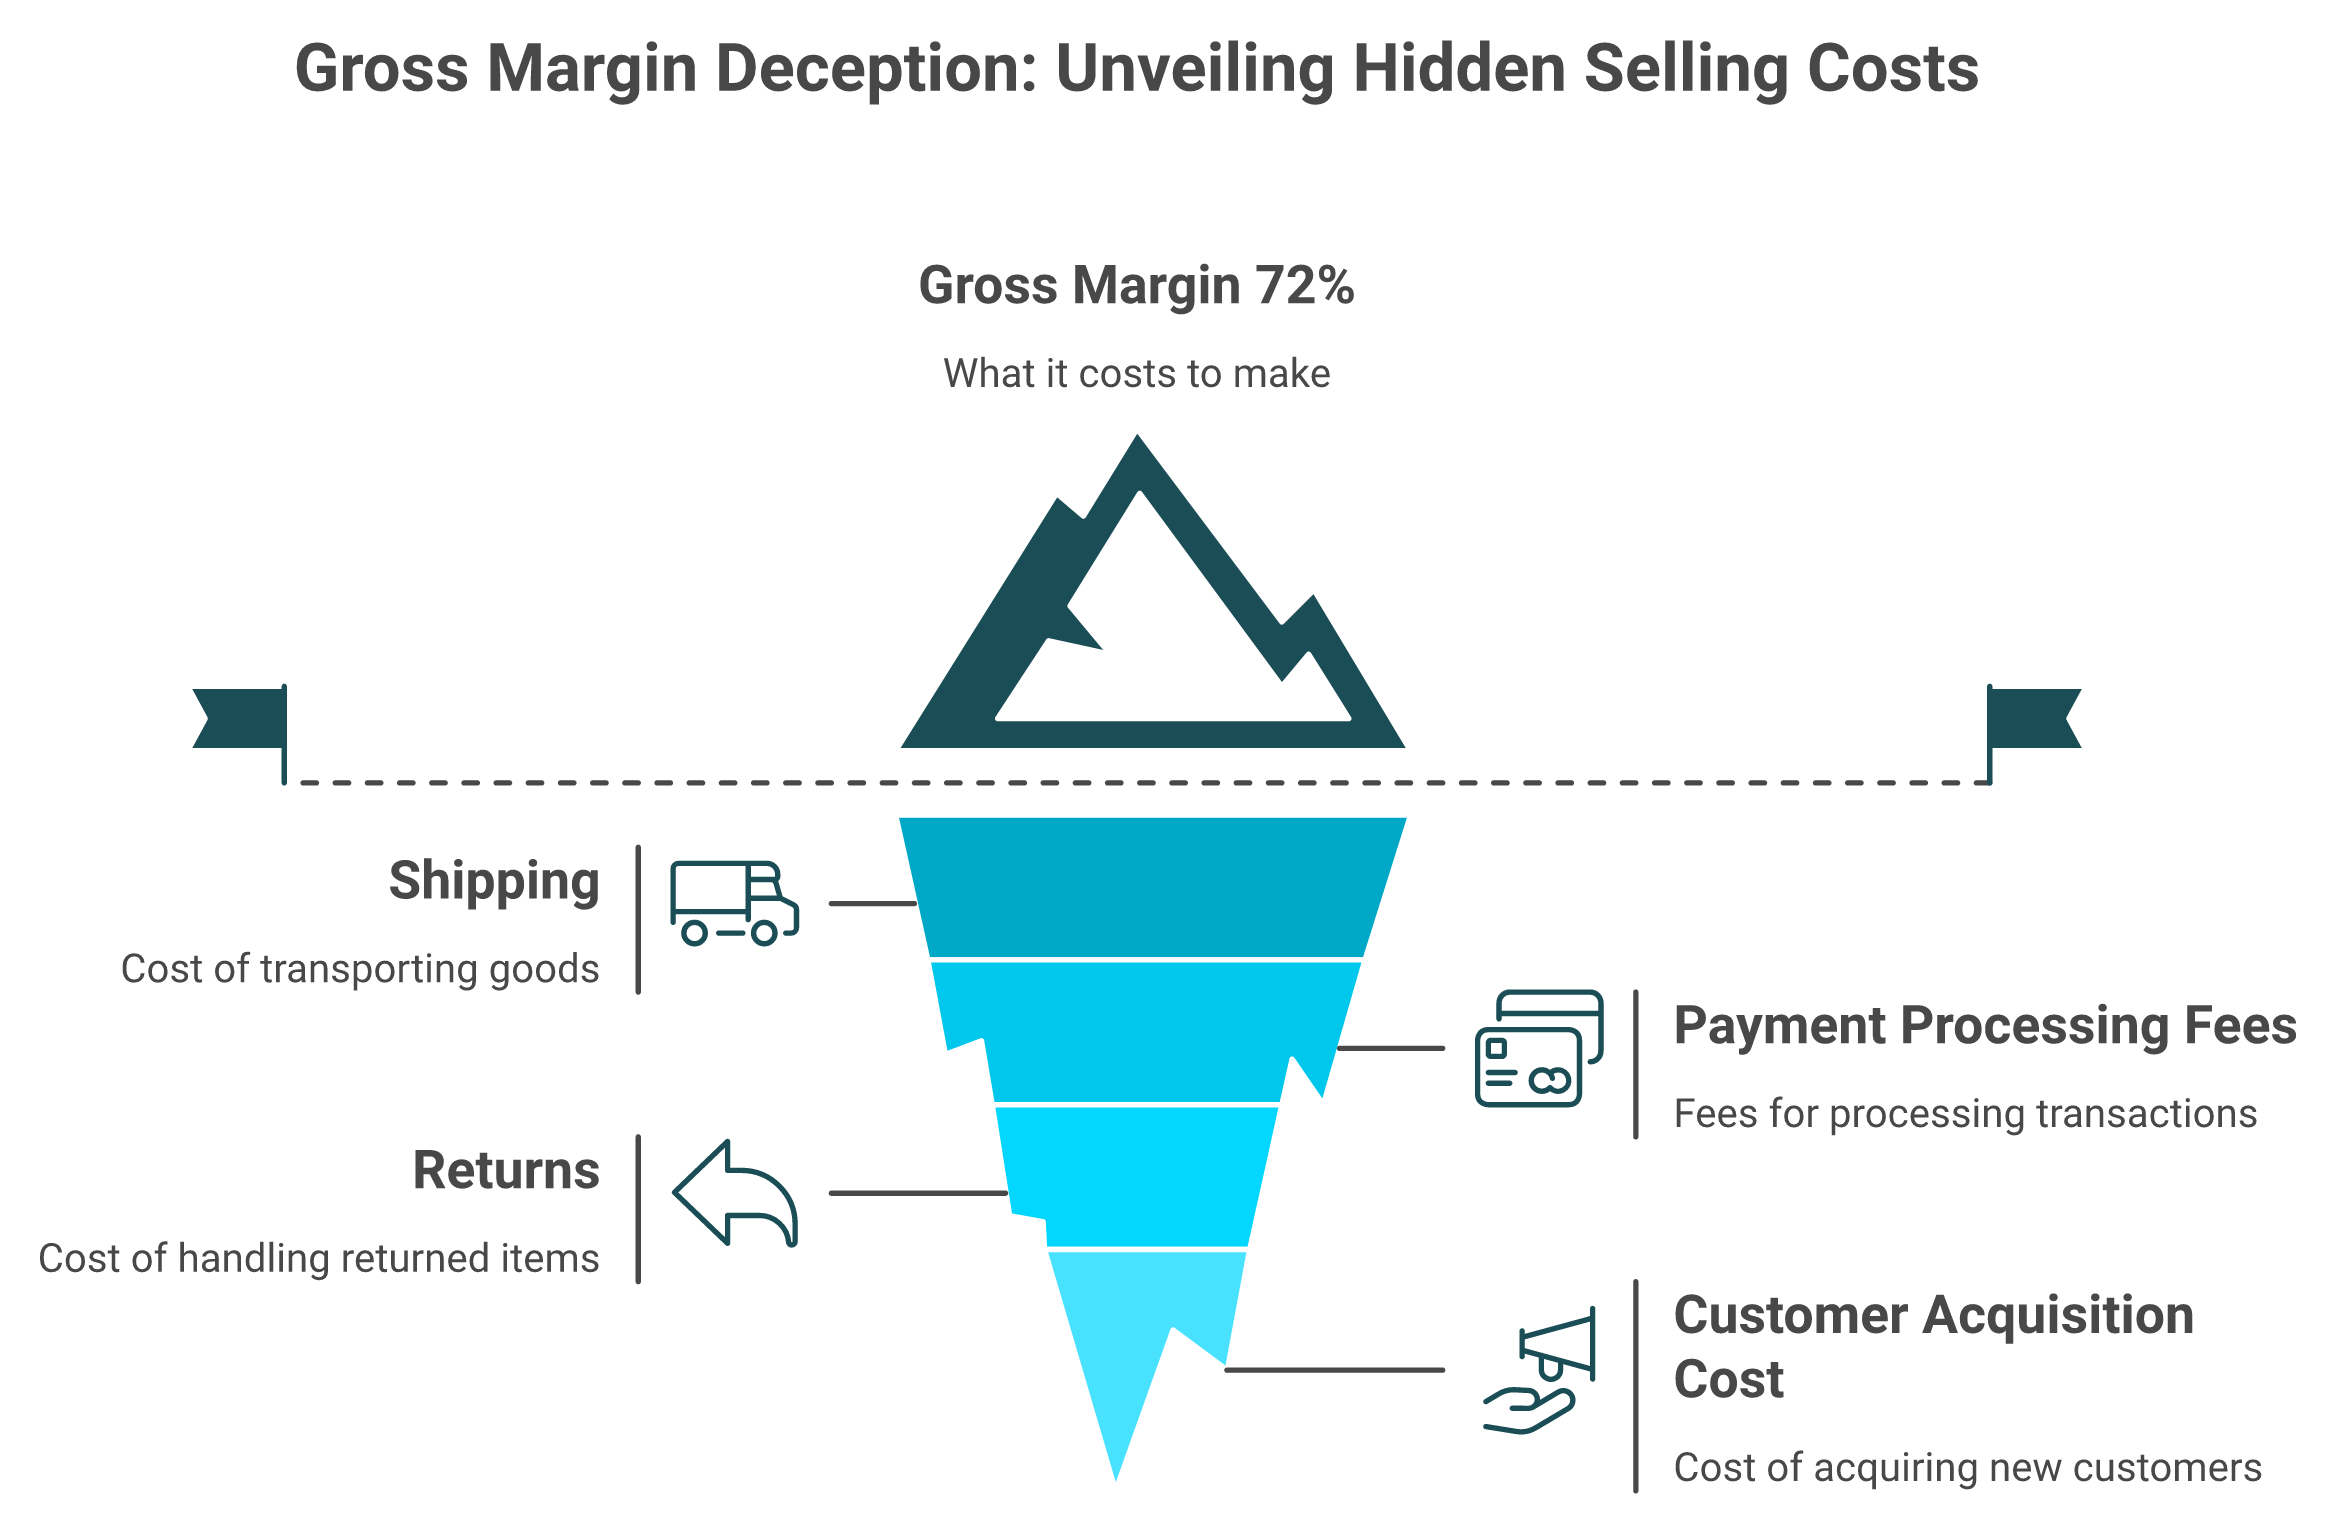
Returns were a big piece. When 18% of units come back, and each return costs about $34 in lost product, shipping, and processing, you spread that across everything you sell. That worked out to roughly $6.20 of return cost baked into every single unit, winners included. Surfacing that kind of leak is exactly what financial management is built for.
⚠️ The CAC debate, and where I land
Here is where I take a side the category dodges. Some people argue your cost to acquire a customer (CAC) does not belong in unit economics. They call it a marketing cost, not a product cost.
I think that read gets it backwards. If you have to spend money to acquire a customer to sell that unit, it is a variable cost of that sale. Leave it out, and your "profitable" SKU is fiction. And please, retire the "we are just reinvesting our profits" line. That is usually an excuse to avoid tracking whether profit exists at all.
✅ The Monday move: rebuild your top three SKUs
This week, take your three best-selling products. For each one, subtract every variable cost from the sale price: product, shipping, payment fees, the per-unit return cost, and CAC. What is left is your real contribution margin.
The hard part is data. Those costs live in Shopify, your ad accounts, your shipping app, and your returns system, four places that do not talk. We built Luca as an AI layer over your unified data so it pulls all of that into one view and answers "what is my true contribution margin on this SKU" in plain English. It does the line-by-line math, and the root-cause work behind it, without you exporting a thing.
Operators are clear about what happens when the underlying numbers cannot be trusted:
"Daily revenue totals are wrong, entire order blocks are missing... orders from external marketplaces show as if they were real conversions even though they never went through Shopify."
— XTRA FUEL Triple Whale Trustpilot Verified Review
"It has been unable to deliver on the promise to provide any insights or accurate data... we end up reverting back to direct data sources like Meta, Shopify, Recharge."
— Matt Huttner Triple Whale Trustpilot Verified Review
If the data is wrong, your margin math is wrong, and so is every cut-or-keep call you make.
Q6. Which numbers tell you each strategy is actually working? [toc=6. Metrics That Matter]
Each lever has one number that proves it. Conversion rate and cart abandonment (benchmark ~70%) measure converting; AOV, repeat-purchase rate, and LTV measure retaining; true contribution margin and return rate (often ~18%, ~$6.20/unit) measure margin. CAC ties them together, and the gate to keep scaling is LTV well above CAC with email near 30% of revenue. Track the median, not the mean, so outliers don't lie to you.
📊 One number per lever, not a dashboard of fifty
You do not need fifty metrics. You need one honest number per lever, plus the one that ties them together.
A quick warning before the table. Focus on the median, not the mean. The median strips out freak outliers that wreck the picture, the way a median supplier lead time exposes the unreliable vendors a simple average would hide. Pulling these cleanly is what the right ecommerce analytics platforms make possible.
🎯 The benchmark scorecard
Here is the scorecard I would tape to the wall. The benchmarks are reference points, not laws, your category will shift them.
🔗 Why CAC is the metric that connects everything
CAC is the thread. A great conversion rate means nothing if CAC outruns LTV. Strong retention is what makes a high CAC survivable.
So the gate to keep scaling acquisition is simple. LTV should sit well above CAC, and email should be pulling near 30% of revenue. Until then, you are funding growth that has not earned it. Poor inventory accuracy alone distorts revenue badly enough that retailers lose over $1 trillion a year to it, so trustworthy numbers are not optional.
The catch is that these six metrics live in six different tools. Pulling them by hand on Monday is how the week disappears. We built Luca to extract the relevant slice on demand and push a weekly scorecard, with graphs and reasoning, straight to your Slack or inbox, so the numbers find you instead of the other way around. That proactive push is the heart of sales performance monitoring.
Q7. In what order should you run these strategies at your revenue stage? [toc=7. Stage-Based Sequencing]
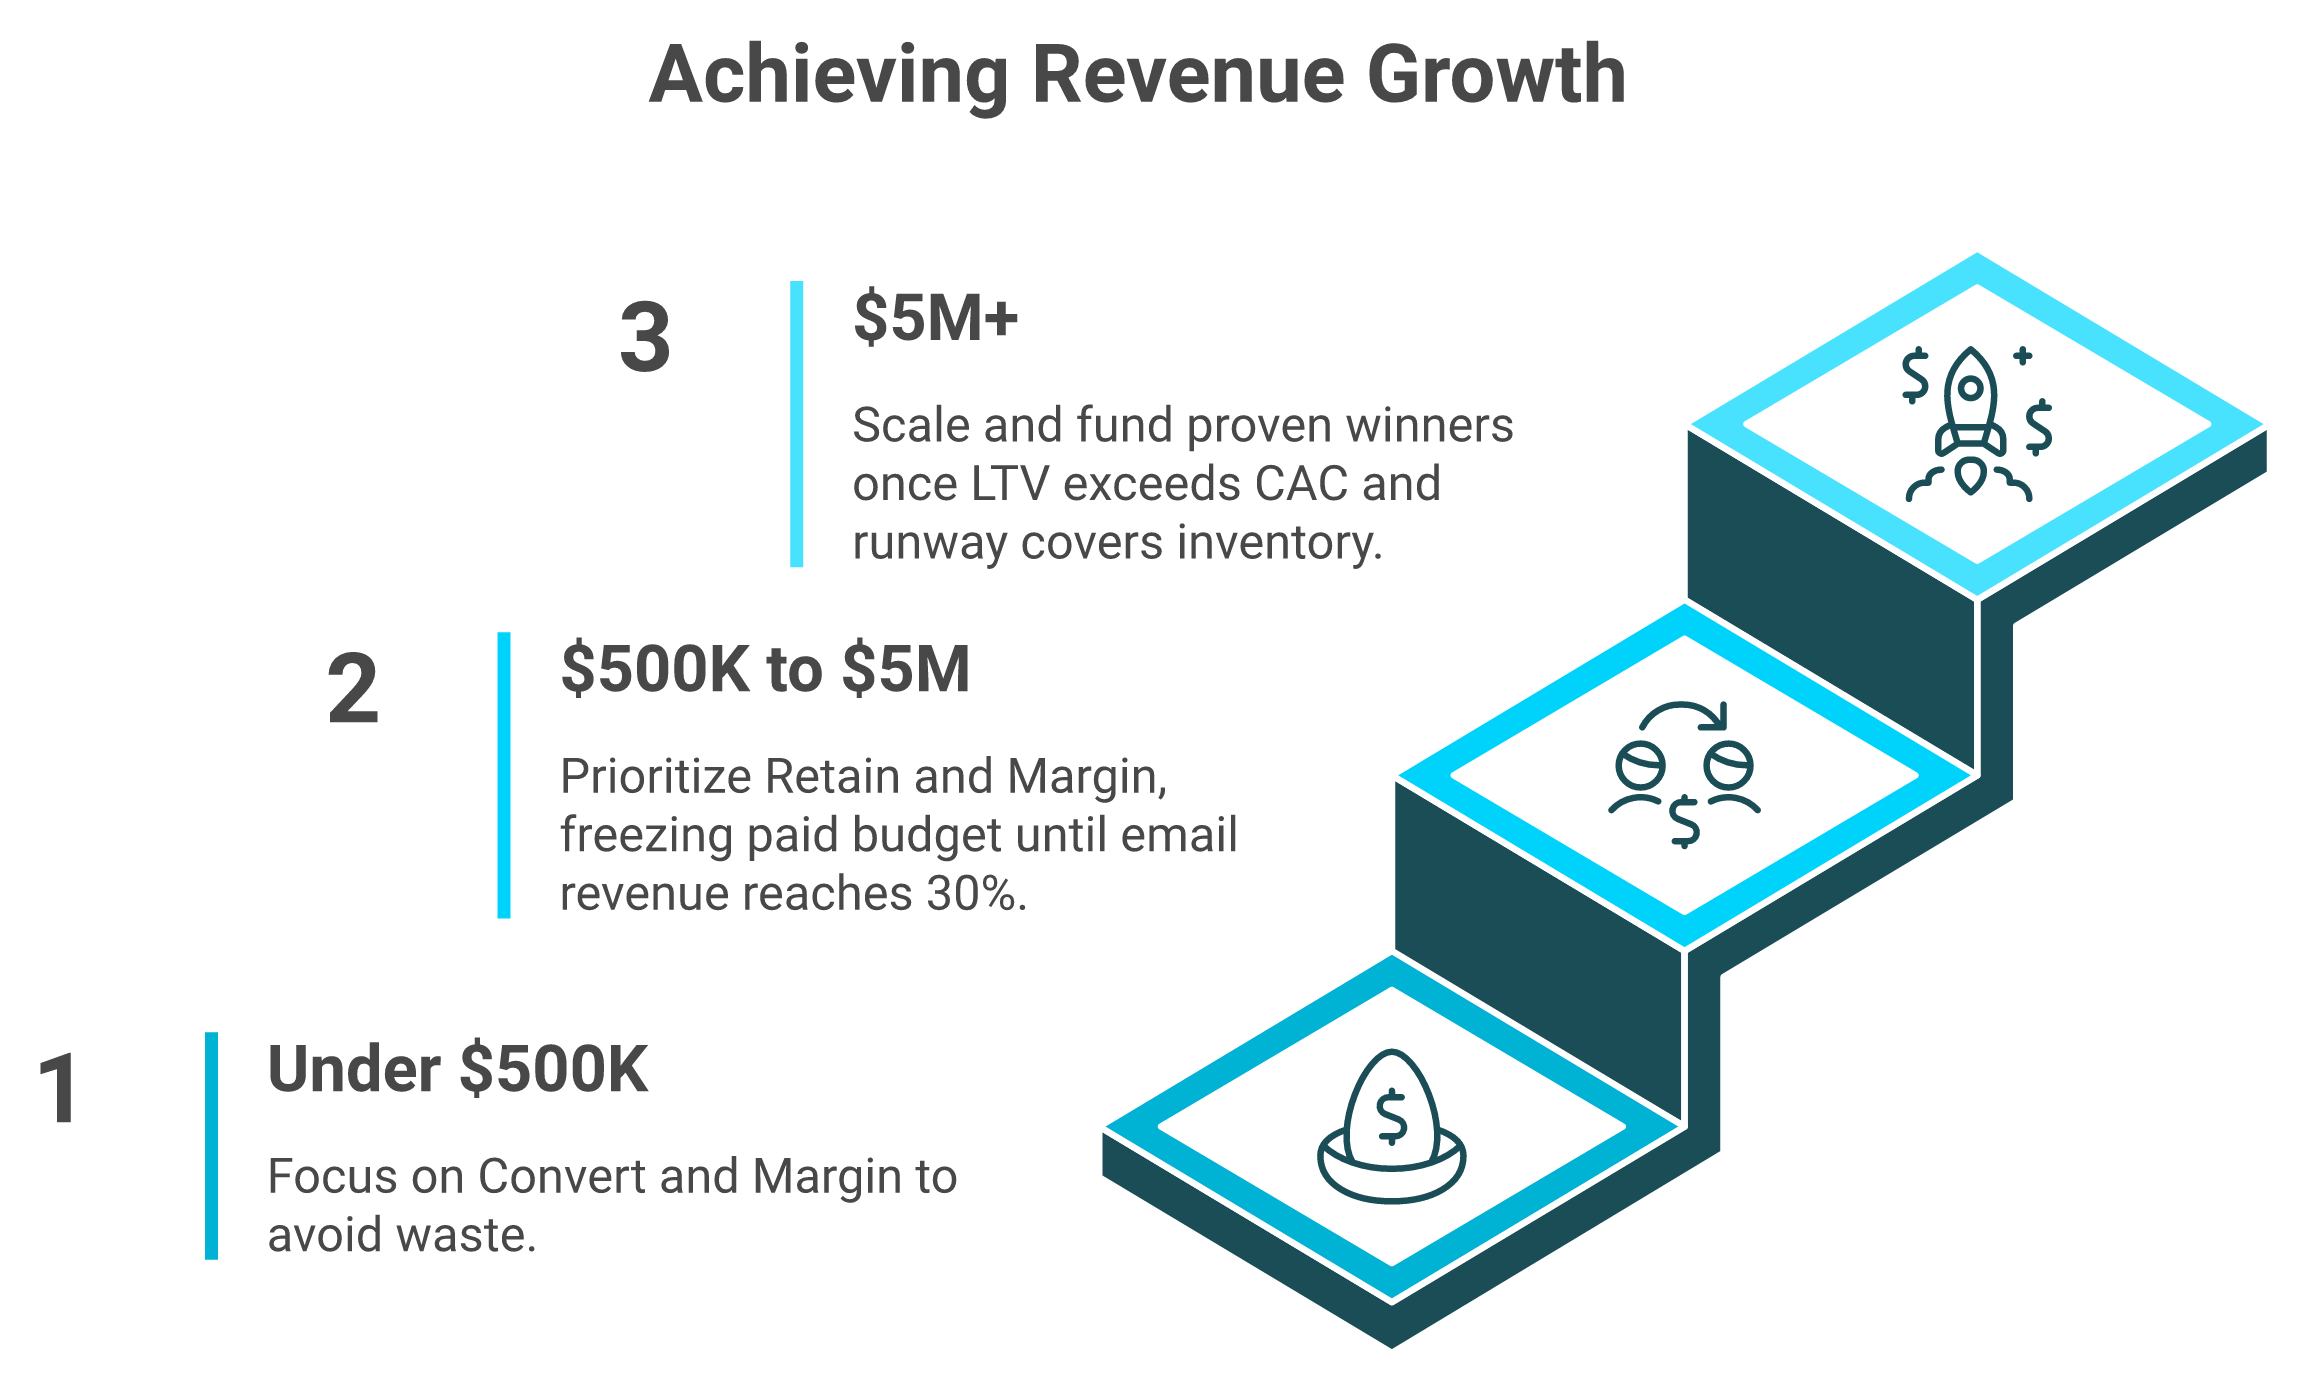
Run them in profit-first order, not all at once. Under $500K, fix conversion and margin before investing in retention infrastructure. At $500K-$5M, retention and margin compound fastest, so freeze net-new paid budget until email clears 30% of revenue and contribution margin is positive per SKU. Above $5M, layer in capital to fund proven winners. The gate between each stage is a number, not a feeling.
🚂 Order matters because cash is finite
You cannot run all three levers at full force at once. Your cash will not allow it. Picture the two train tracks again: inventory on one side, cash on the other, and they have to move in parallel.
Sequence is how you keep them aligned. Pull the wrong lever for your stage, and one track races ahead of the other. That is how stores end up overstocked and broke at the same time. Reading your runway in real time is what cash flow forecasting for e-commerce solves.
🪜 The stage matrix
The gates are numbers, not feelings. At $500K-$5M specifically, I would freeze net-new paid budget until email clears 30% of revenue, and every core SKU shows positive contribution. Push average order value first, a $39 hero into a $58 bundle does more than another cold audience.
⚠️ The mistake that slows good stores to a crawl
Here is the warning I wish more founders heard. Roughly 90% of ecommerce businesses fail within their first four months, often tied to capital and pricing or costing problems. Sequencing protects you from exactly that.
The other trap is premature "professionalization." I have watched stores waste money bringing in expensive executives touting old-school marketing before the unit economics were sound. The business slowed to a crawl. The gates only work if you can read them continuously, true CAC, repeat rate, contribution margin, and cash runway, not from a spreadsheet you rebuild every Sunday. That live monitoring is the simulate-and-track job we built Luca to run as agentic AI for ecommerce founders, so you know which stage gate you have actually cleared.
Q8. Why do most analytics dashboards fail scaling operators, and what does an AI analytics layer do differently? [toc=8. Beyond Dashboards]
Most dashboards fail because each one sees a fragment, and none reasons across them. You spend Monday mornings exporting from five systems to triangulate one answer, and optimizing to the algorithm alone becomes whack-a-mole that ignores the customer. An AI layer over your data warehouse does the opposite: it extracts the relevant slice in plain English, finds root causes, simulates "what if," flags outliers, and pushes a weekly report to Slack so you stop building dashboards.
⏰ The Monday-morning export grind
Here is the scene almost every scaling operator knows. On Monday, you run your standard reports. Exports from Shopify. Exports from the returns system. Exports from Meta. Most of the week's first hours get tied up reconciling manual tools.
That grind feels like diligence. It is mostly friction. Each tool sees one fragment, and you become the human glue, triangulating numbers that should already agree. It is the same pain we cover in why e-commerce founders are drowning in data.
❌ Where siloed dashboards break
To be fair, the incumbents do real things well. ✅ A tool like Triple Whale built strong first-party tracking and unified marketing and commerce data. ✅ It automates marketing analysis better than a spreadsheet ever could.
❌ But it sees marketing, not cash flow, so it cannot tell you if you can afford to scale the campaign it recommends. ❌ And optimizing to the algorithm alone turns into whack-a-mole, fill this inventory, sell this product, while the customer drops out of the picture entirely. The architectural limit is that these tools were built to solve isolated problems, so they cannot reason across functions. We map this out in detail across the Triple Whale alternatives.
Operators say it plainly:
"It has been unable to deliver on the promise to provide any insights or accurate data to our business, and we end up reverting back to direct data sources like Meta, Shopify, Recharge."
— Matt Huttner Triple Whale Trustpilot Verified Review
"Daily revenue totals are wrong, entire order blocks are missing... Completely fake data."
— XTRA FUEL Triple Whale Trustpilot Verified Review
✅ What an AI analytics layer does instead
An AI layer over your data warehouse flips the model. ✅ You ask in plain English, no SQL, no analyst, no dashboard-building. ✅ It connects every source into one place, finds the root cause behind an outlier, and simulates "what if I raise prices 10%."
This is the difference between most tools that bolted AI onto a dashboard and a system that is AI from the ground up. As one operator-investor, Ari Tulla of ELO Health, put it, his team spent about $10 million building a system to turn data into meaning, and then "LLMs come and they are 10 times better." We built Luca on that premise, the kind of data analysis and deep industry research engine that scans your data 24/7, pings you when ROAS dips or CAC spikes, and pushes a weekly report with graphs and reasoning. It replaces the junior data analyst you cannot yet afford, not your judgment. The human still reads the room, AI just removes the Monday grind.
Q9. How do you put the three strategies into motion this week without hiring an analyst or a CFO? [toc=9. Fund Winners & Act]
Pick one lever and run one move this week. Convert: run a one-week smoke-test on your highest-traffic page. Retain: build a three-email post-purchase flow and one category cross-sell. Margin: calculate true contribution margin on your top three SKUs, loading shipping, returns, and CAC. You don't need a $120K analyst or fractional CFO to start. You need one number per lever and the discipline to act on it.
✅ Your Monday checklist: one move per lever
Do not try to fix everything at once. Pick the lever your stage calls for, and run a single move this week.
- Convert: Run a one-week smoke-test on your highest-traffic page. Change one thing, measure real intent, decide.
- Retain: Build a three-email post-purchase flow, then test one cross-category offer. Watch your 30-day repeat-purchase rate.
- Margin: Rebuild true contribution margin on your top three SKUs, loading shipping, returns, and CAC. Cut or reprice whatever runs thin.
One move, run honestly, beats ten ideas sitting in a Notion doc. Alex Hormozi frames value as the dream outcome and the odds of hitting it, divided by time delay and effort. A small proven move wins because it shrinks both the delay and the effort. Tracking that move against real numbers is the job of the best way to track e-commerce unit economics.
💰 When you find a winner, fund it on the right terms
Once a move proves out, the bottleneck shifts from ideas to cash. Here is where I get blunt about financing. Judge any capital offer on the numbers that matter, not the friendly sales call.
- Effective rate, not the headline fee. A "6% for four months" deal with weekly repayment can pencil out near 36% annualized.
- Disbursal time. Promised 24 hours, delivered in 12 days, is a real pattern operators report.
- Sizing. Take what the opportunity needs, not what the rep pushes. Lenders make more on bigger advances, so the incentive runs against you.
Knowing exactly how much you need starts with calculating working capital for ecommerce business needs. Founders describe the gap between pitch and reality plainly:
"Company loves to lie. They gave our firm a $90,000 loan... at the 50%, 75%, and 90% marks, they kept making excuses and lies. Very predatory."
— Adam Zackman Wayflyer Trustpilot Verified Review
"Sales team was great, Ops team was terrible. They pulled funds far faster than the contract stated, thereby increasing the effective interest rate significantly."
— Thomas Bishop Wayflyer Trustpilot Verified Review
That speed-and-sizing problem is the gap we built Luca to close: capital priced on your real-time health, sized to the proven opportunity, without the application loop or the incentive to oversize. We unpack the trade-offs further in the Wayflyer alternatives.
🤝 The co-founder you can't afford to hire
A great operational co-founder reads the whole business, spots the lever, and helps fund it. Most founders cannot hire that person. A senior analyst plus a fractional CFO runs well past $120K a year.
That is the role we built Luca to fill, around $200 a month, reading your numbers and acting on them, the way we describe in what is an AI co-founder for e-commerce. To be fair, it is not for everyone. If you are sub-$10K monthly revenue, pure B2B, or marketplace-only, you do not have enough connected data yet for it to earn its keep.
So here is the question I am sitting with as the AI Co-Founder model heads into 2027. If you could ask one honest question about your store in plain English, and get the cross-functional answer, plus the capital to act on it, what would you ask first? Tell us what you're scaling, and we'll show you the real number behind it. You can see how the model reasons in the intelligence capital thesis, or just start the conversation.

.webp)
.svg)
.webp)

.png)
