How to Conduct a Campaign Performance Analysis:Steps, KPIs, & Frameworks
mins read
TL;DR
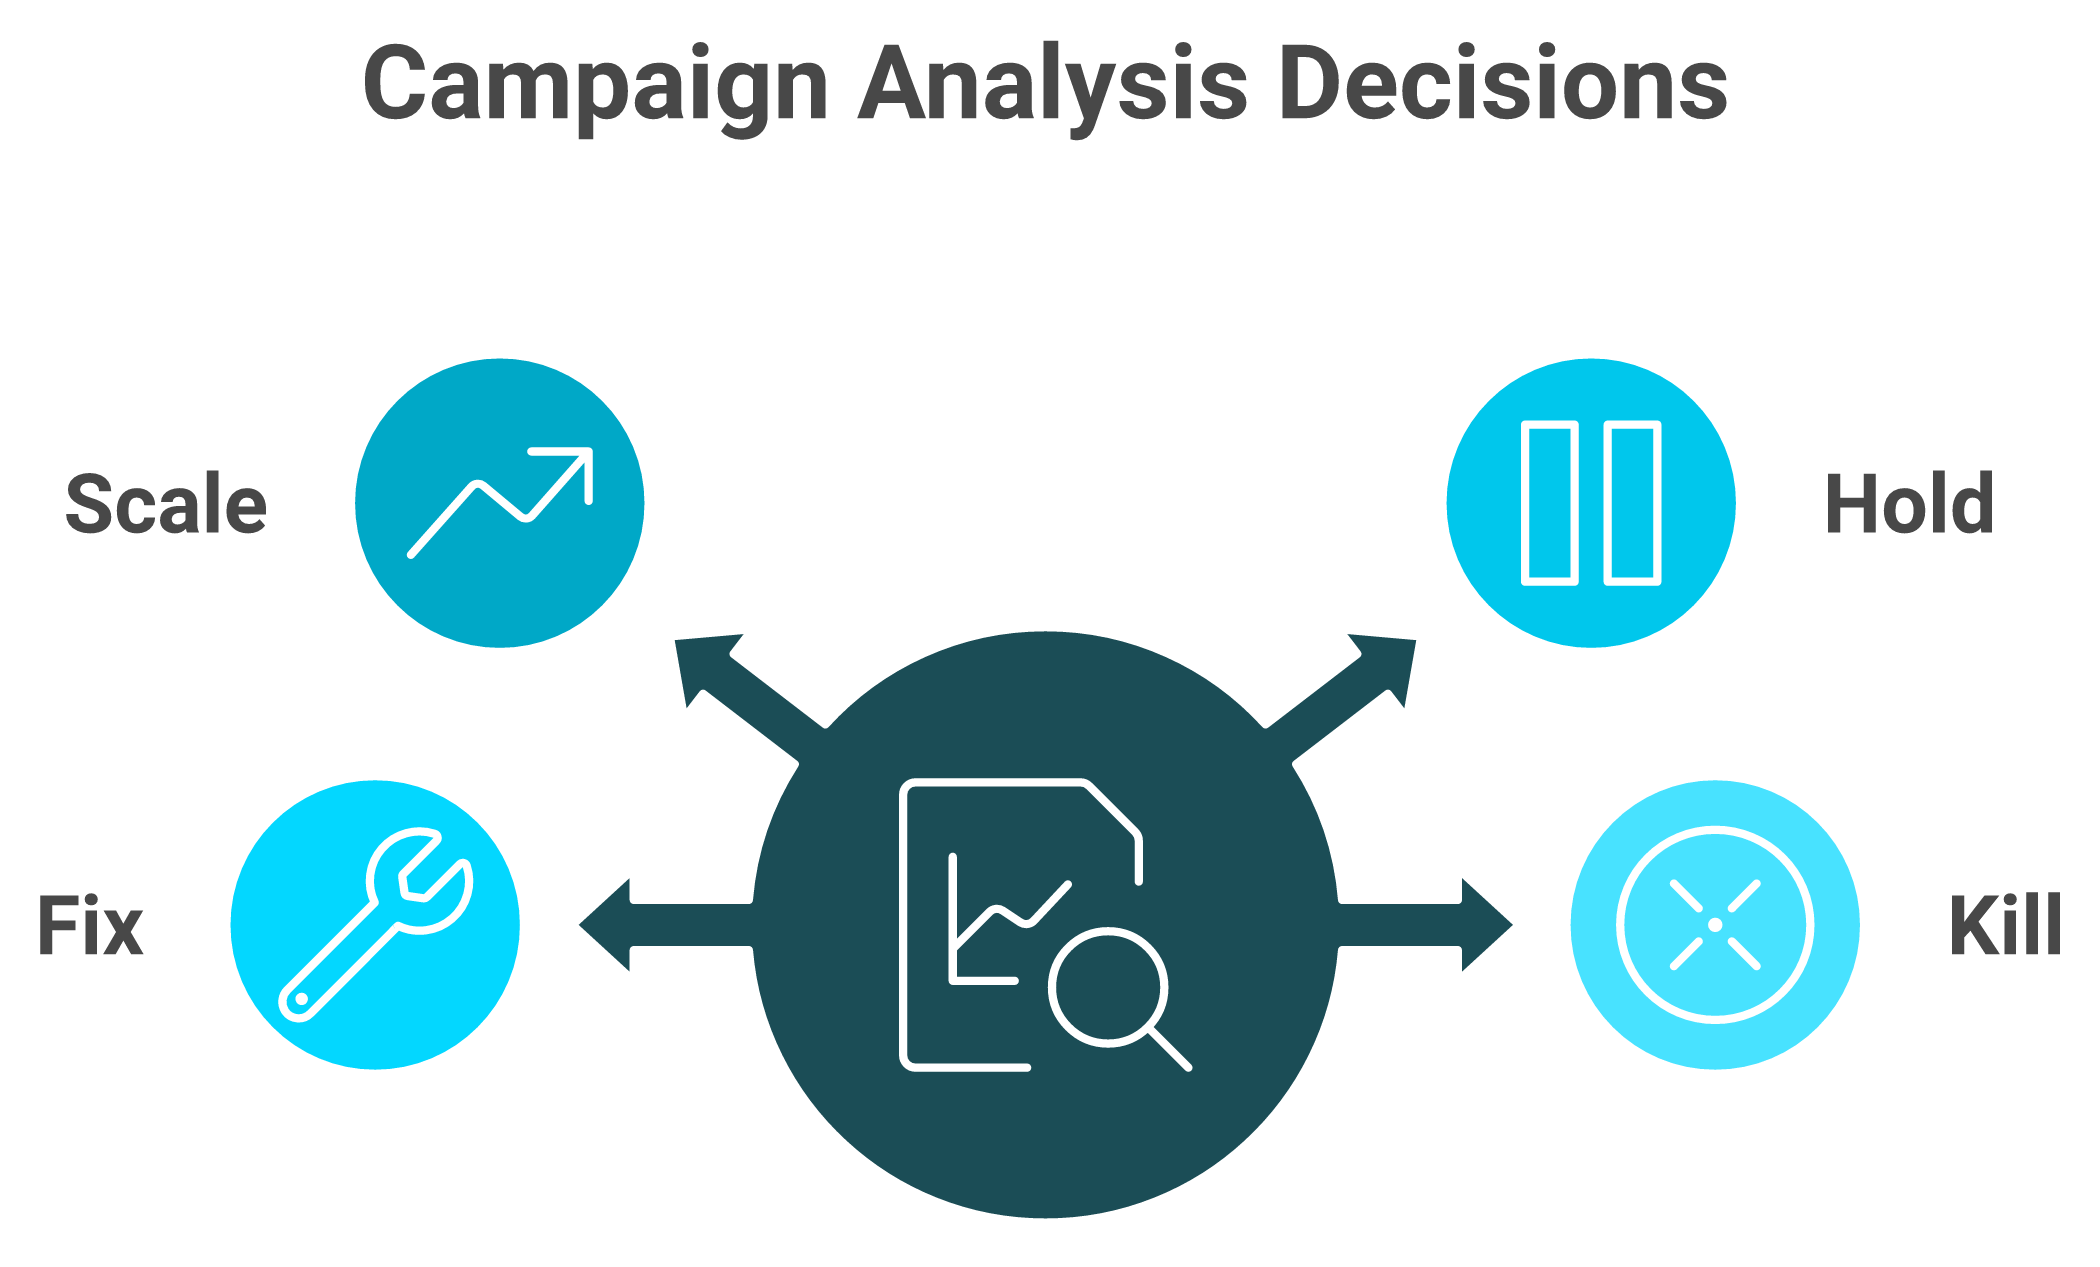
A campaign performance analysis ends in one decision: scale, hold, fix, or kill. If the output is a slide deck instead of a budget change, you ran a report.
Reconcile before you read any KPI. A 10 to 20 percent platform-versus-store gap is normal, 30 to 45 percent signals loss, and 45 percent or more means broken tracking.
Track three to five metrics in levels: contribution margin per order, MER, new-customer CAC, and CAC payback decide budget. Everything else only diagnoses.
A $49.99 product can post strong platform ROAS and still lose $21.31 per order once landed cost, fulfillment, shipping, returns, support, and CAC are loaded in.
Run a holdout before scaling, split new-customer from returning performance, and remember one retailer lost roughly $40,000 in two weeks after killing branded search.
Budget a fixed learning line. Below 30 to 50 orders a month, channel-level attribution does not pay back, so work on offer and average order value instead.
Q1. What is a campaign performance analysis actually supposed to answer? [toc=1. Analysis vs Reporting]
A campaign performance analysis compares actual results against targets set before launch, traces spend through to profit rather than clicks, and ends in one decision: scale, hold, fix, or kill. Reporting shows spend, impressions, and platform ROAS. Analysis explains why the gap exists and what changes on Monday. If the output is a deck instead of a budget change, you ran a report.
⭐ The question the Monday report never answers
Picture the Slack message every founder gets on Monday. The media buyer posts a screenshot: spend $18,400, ROAS 3.1, "strong week." Two hours later, the finance lead opens the bank feed and the deposits do not feel like a 3.1 week.
Nobody in that thread is lying. They are answering two different questions. The buyer answered "what did the platform record." The founder needed "did we make money, and what do I fund next."
💸 Why siloed media buying drains the account
This is the structural failure, not a personality clash. Nick Shackelford, who scaled Brez, described the pattern bluntly: ad buyers spend, finance worries later, and channel owners fight over who really drove the sale.
That fight is a symptom. The disease is that no single number in the room is tied to profit per order. When credit is contested, the only honest arbiter is contribution margin, which is revenue minus every variable cost attached to fulfilling that order.
✅ The four valid outputs
A campaign review is only an analysis when it lands on one of these four decisions. Anything else is a status update.
An analysis is finished when it produces one of exactly four answers. Anything else is a status update.
Scale. The campaign clears your margin target with room, so budget moves up by a stated amount.
Hold. Performance is inside tolerance, so nothing changes and you set the next review date.
Fix. The result is bad for a named, correctable reason (tracking, creative fatigue, landing page).
Kill. The campaign loses money at every tested budget level, so it stops this week.
Write the answer as one sentence with a number in it. "Increase Prospecting-US daily budget from $600 to $780" is an analysis. "Prospecting is doing well" is not.
⚠️ The test that separates the two
Here is the test I use before accepting any campaign review. Did something change in an ad account, a budget, or a creative brief within 48 hours of the review? If no, the review was theater.
Reporting is a mirror. Analysis is a decision with a dollar amount attached. Most brands under $10M have plenty of the first and almost none of the second, which is why the dashboard count keeps rising while the margin does not. That gap is the whole argument behind declining platform ROAS versus true profitability.
💰 What this means for the next five sections
Everything that follows assumes that sequence. First, you make the numbers trustworthy. Then you pick the three to five ecommerce KPIs that carry the decision. Then you compare against a target you wrote down before spending.
Skip any of those steps and the analysis inherits the error. I have watched operators spend a full quarter optimizing toward a ROAS figure that was never real, which is the most expensive form of diligence there is.
Q2. Why do your ad platform numbers and your store revenue never match? [toc=2. Reconciling Your Data]
Platforms attribute influence inside click and view windows and back-date conversions to click date. Your store counts settled orders net of refunds. A 10% to 20% gap is normal, 20% to 30% means check view-through, 30% to 45% suggests signal loss, and 45% or more usually means duplicated events or broken UTMs (the tracking tags appended to your ad links). Never sum platform revenue across channels. Reconcile to one date range and one attribution window before reading any KPI.
⚠️ Use the gap size as a diagnostic
The gap itself is data. An analysis of more than 300 Shopify ad accounts, published by Vaizle in April 2026, produced usable tiers, and they match what I see in audits.
Platform Versus Store Revenue Gap Tiers
Gap vs store revenue
Most likely cause
First thing to check
Under 10%
Normal modeling noise
Nothing, proceed
10% to 20%
Expected signal loss
Confirm date range alignment
20% to 30%
View-through credit inflating results
Switch Meta to 7-day-click only
30% to 45%
Server-side gaps, modeled conversions
Pixel and CAPI event match quality
45% or more
Duplicate events or broken UTMs
Event deduplication and UTM audit
💸 What operators actually report
The pain here is not theoretical. One operator walking through a live account put it plainly: spend of $3,000 against reported conversion value of $1,600, with Facebook capturing roughly 20% of real store sales. His words were that he felt like he was winging it in the dark.
The tooling built to solve this does not fully solve it either, and verified buyers say so. This is the same friction that drives most Triple Whale alternatives searches.
"Some data we still notice discrepancies between platforms, for example, tracking ads, and differences in the reported metrics like revenue. Or with our emails/sms platforms about what revenue is attributed to which channel." — Verified User, Mid-Market Marketing, Triple Whale - G2 Verified Review (4/5), 20 April 2023
"We are a startup company and mainly use Supermetrics for Shopify API. Data is inaccurate when it comes to Daily Total Sales and Returning Orders figures." — Verified User, Startup Operator, Supermetrics - G2 Verified Review (2.5/5), 6 October 2022
"It is becoming very opaque, it doesn't have real-time, the sampling is increasingly wild... To make decisions based on grounded data, it is really difficult to trust it 100% and it complicates decision-making." — Verified User in Retail, Google Analytics - G2 Verified Review (1.5/5), 14 February 2024
❌ Why date-matching can never work
One r/PPC thread documents the mechanism better than most vendor docs. An operator watched double-claimed sales climb from about 10% to between 30% and 40% in a single month.
"Conversions are back-dated to the date of the click, not the date of purchase." — Operator reply, r/PPC Reddit Thread, December 2023
That is the cause. So a sale today can appear in last Tuesday's row. Matching Shopify day-by-day to platform day-by-day is structurally impossible, no matter how carefully you export, which is why ecommerce conversion tracking has to be set up with one agreed window.
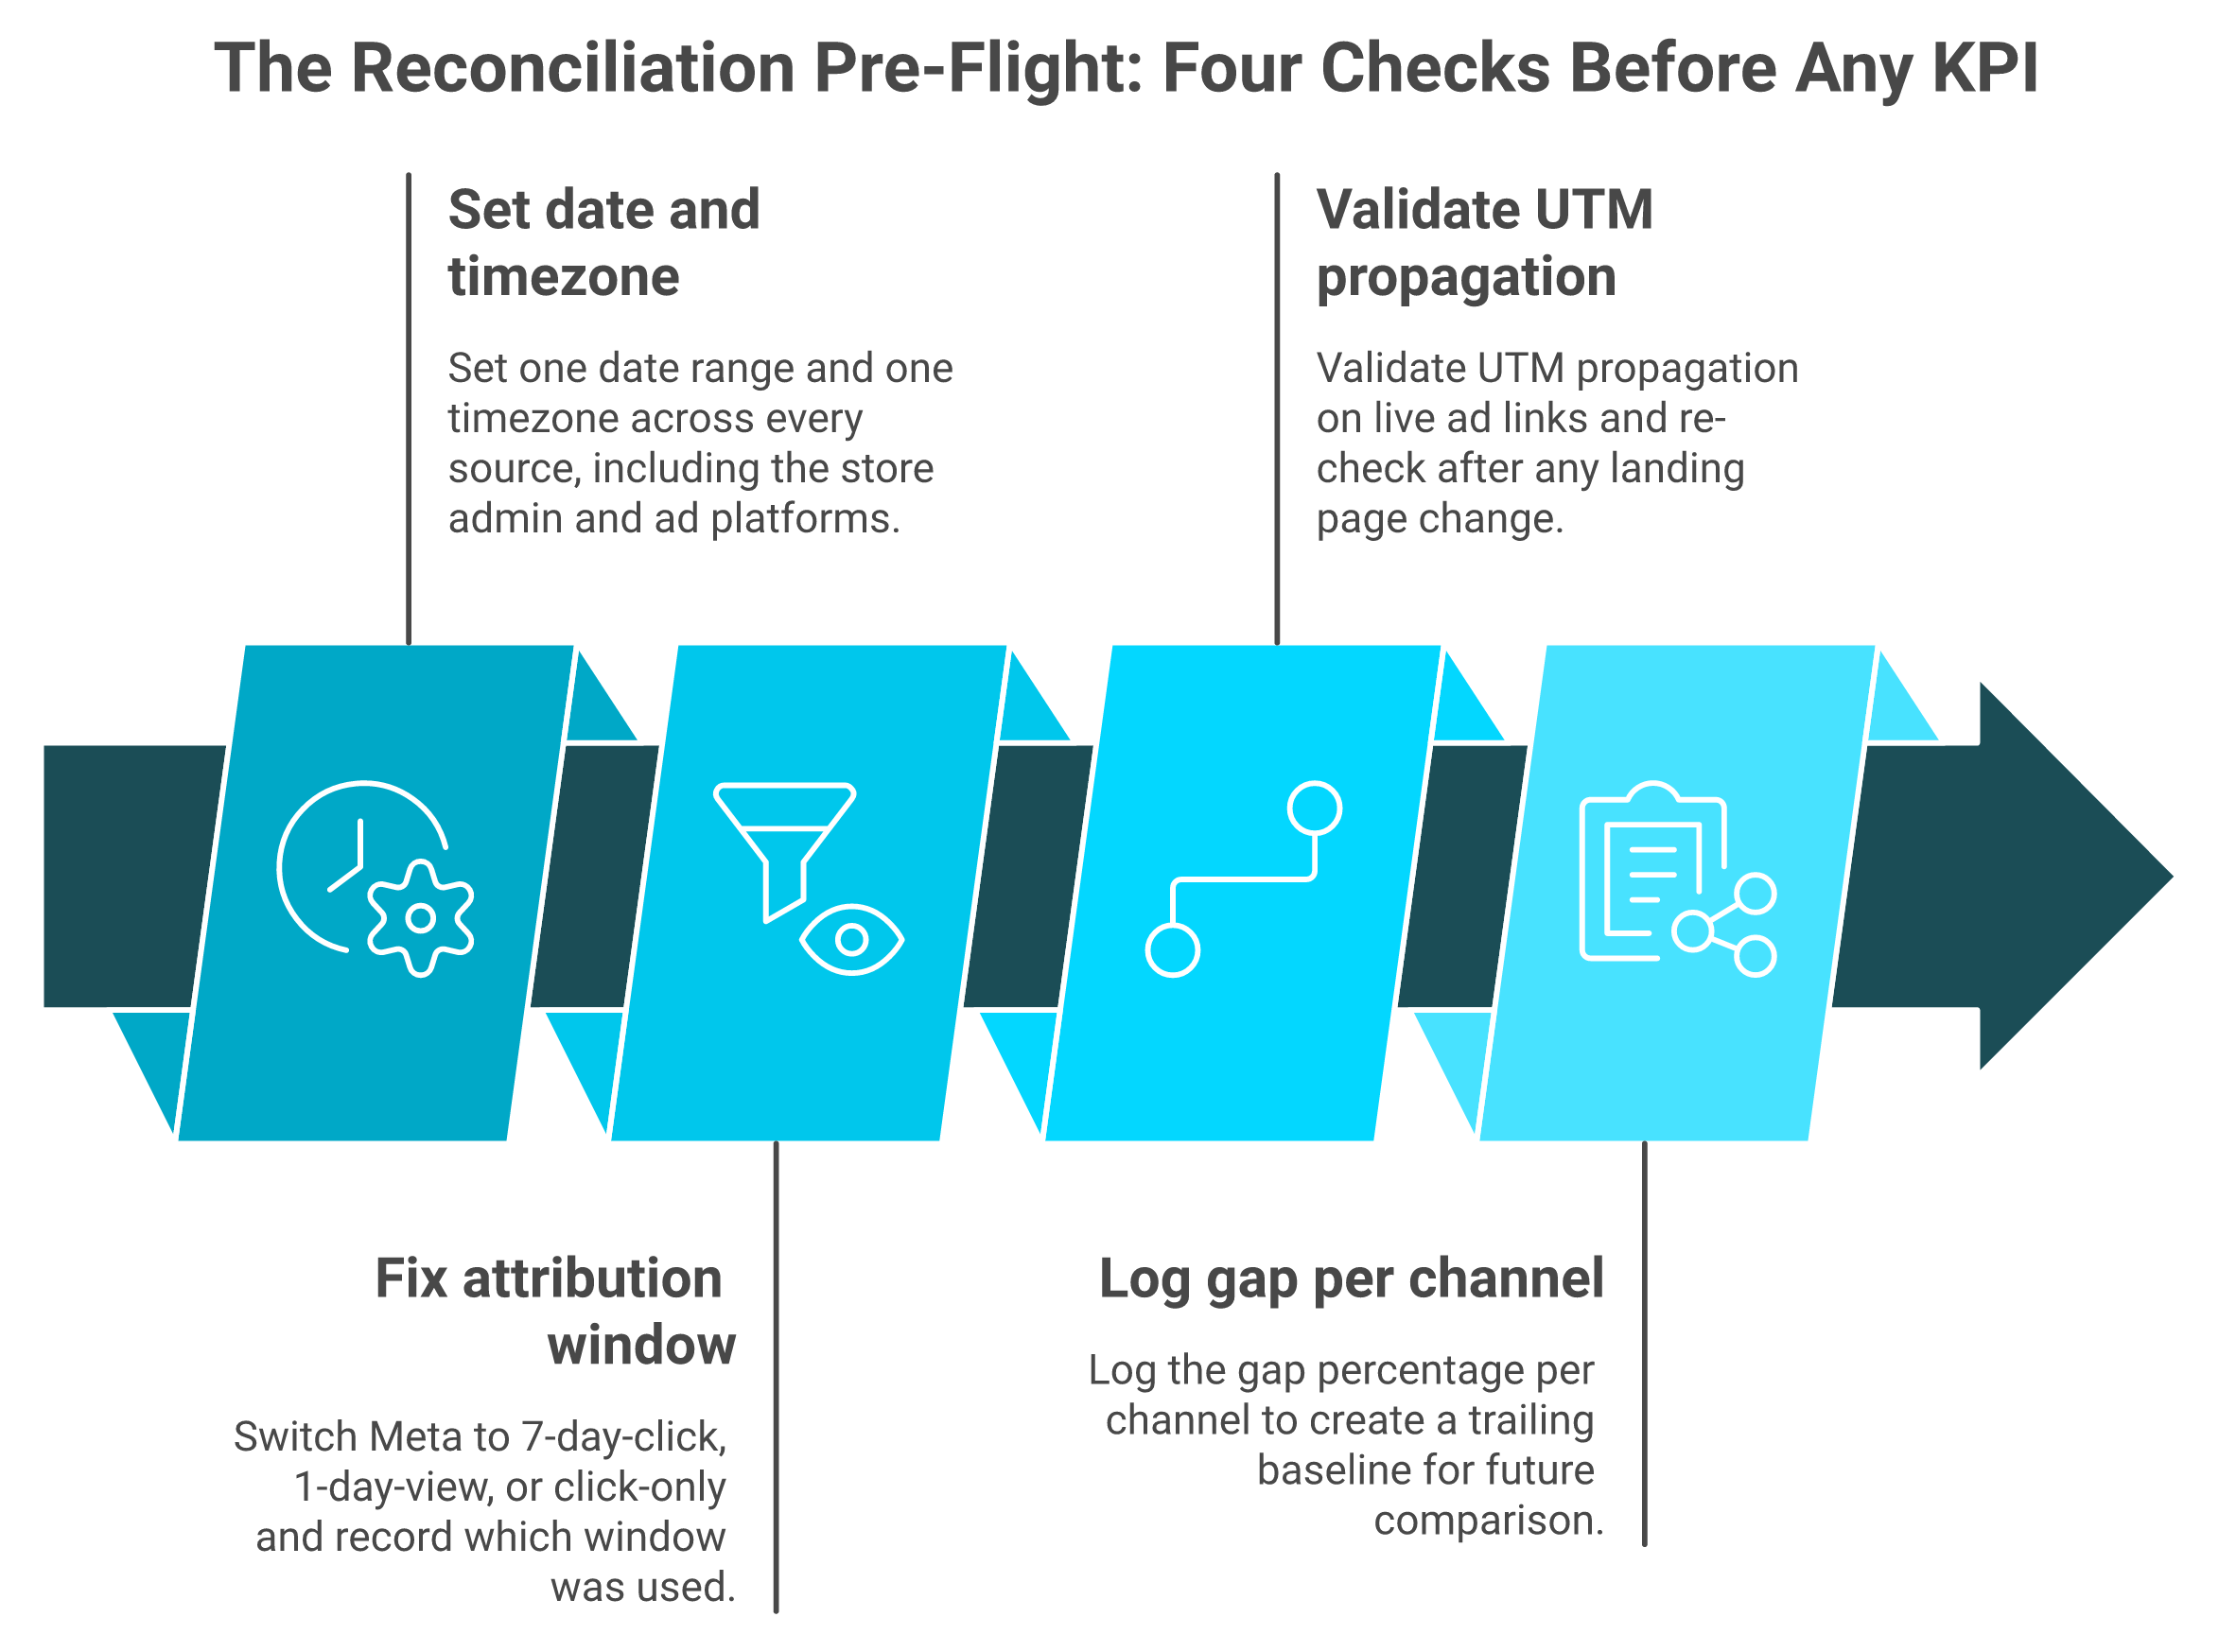
✅ Run this pre-flight before any KPI
Four checks, roughly twenty minutes, and they go before every analysis.
Twenty minutes of reconciliation protects every number that follows it in the analysis.
Set one date range and one timezone across every source, including your store admin.
Switch Meta to 7-day-click, 1-day-view, or click-only, then record which you used.
Validate UTM propagation on live ad links, especially after any landing page change.
Log the gap percentage per channel so you have a trailing baseline to compare against.
Luca AI normalizes and standardizes every connected source on ingestion, so Shopify, Meta, Google, Klaviyo, and your accounting ledger arrive on one revenue definition and one date logic. Monday stops being reconciliation work and starts being decision work. Luca AI's analytics sit over that unified data, not over a pixel, so the output is the reasoning, not another dashboard to triangulate. That is the practical case for ecommerce data integration happening before analysis, not after it.
Q3. Which KPIs actually matter, and how many should you track? [toc=3. Choosing Your KPIs]
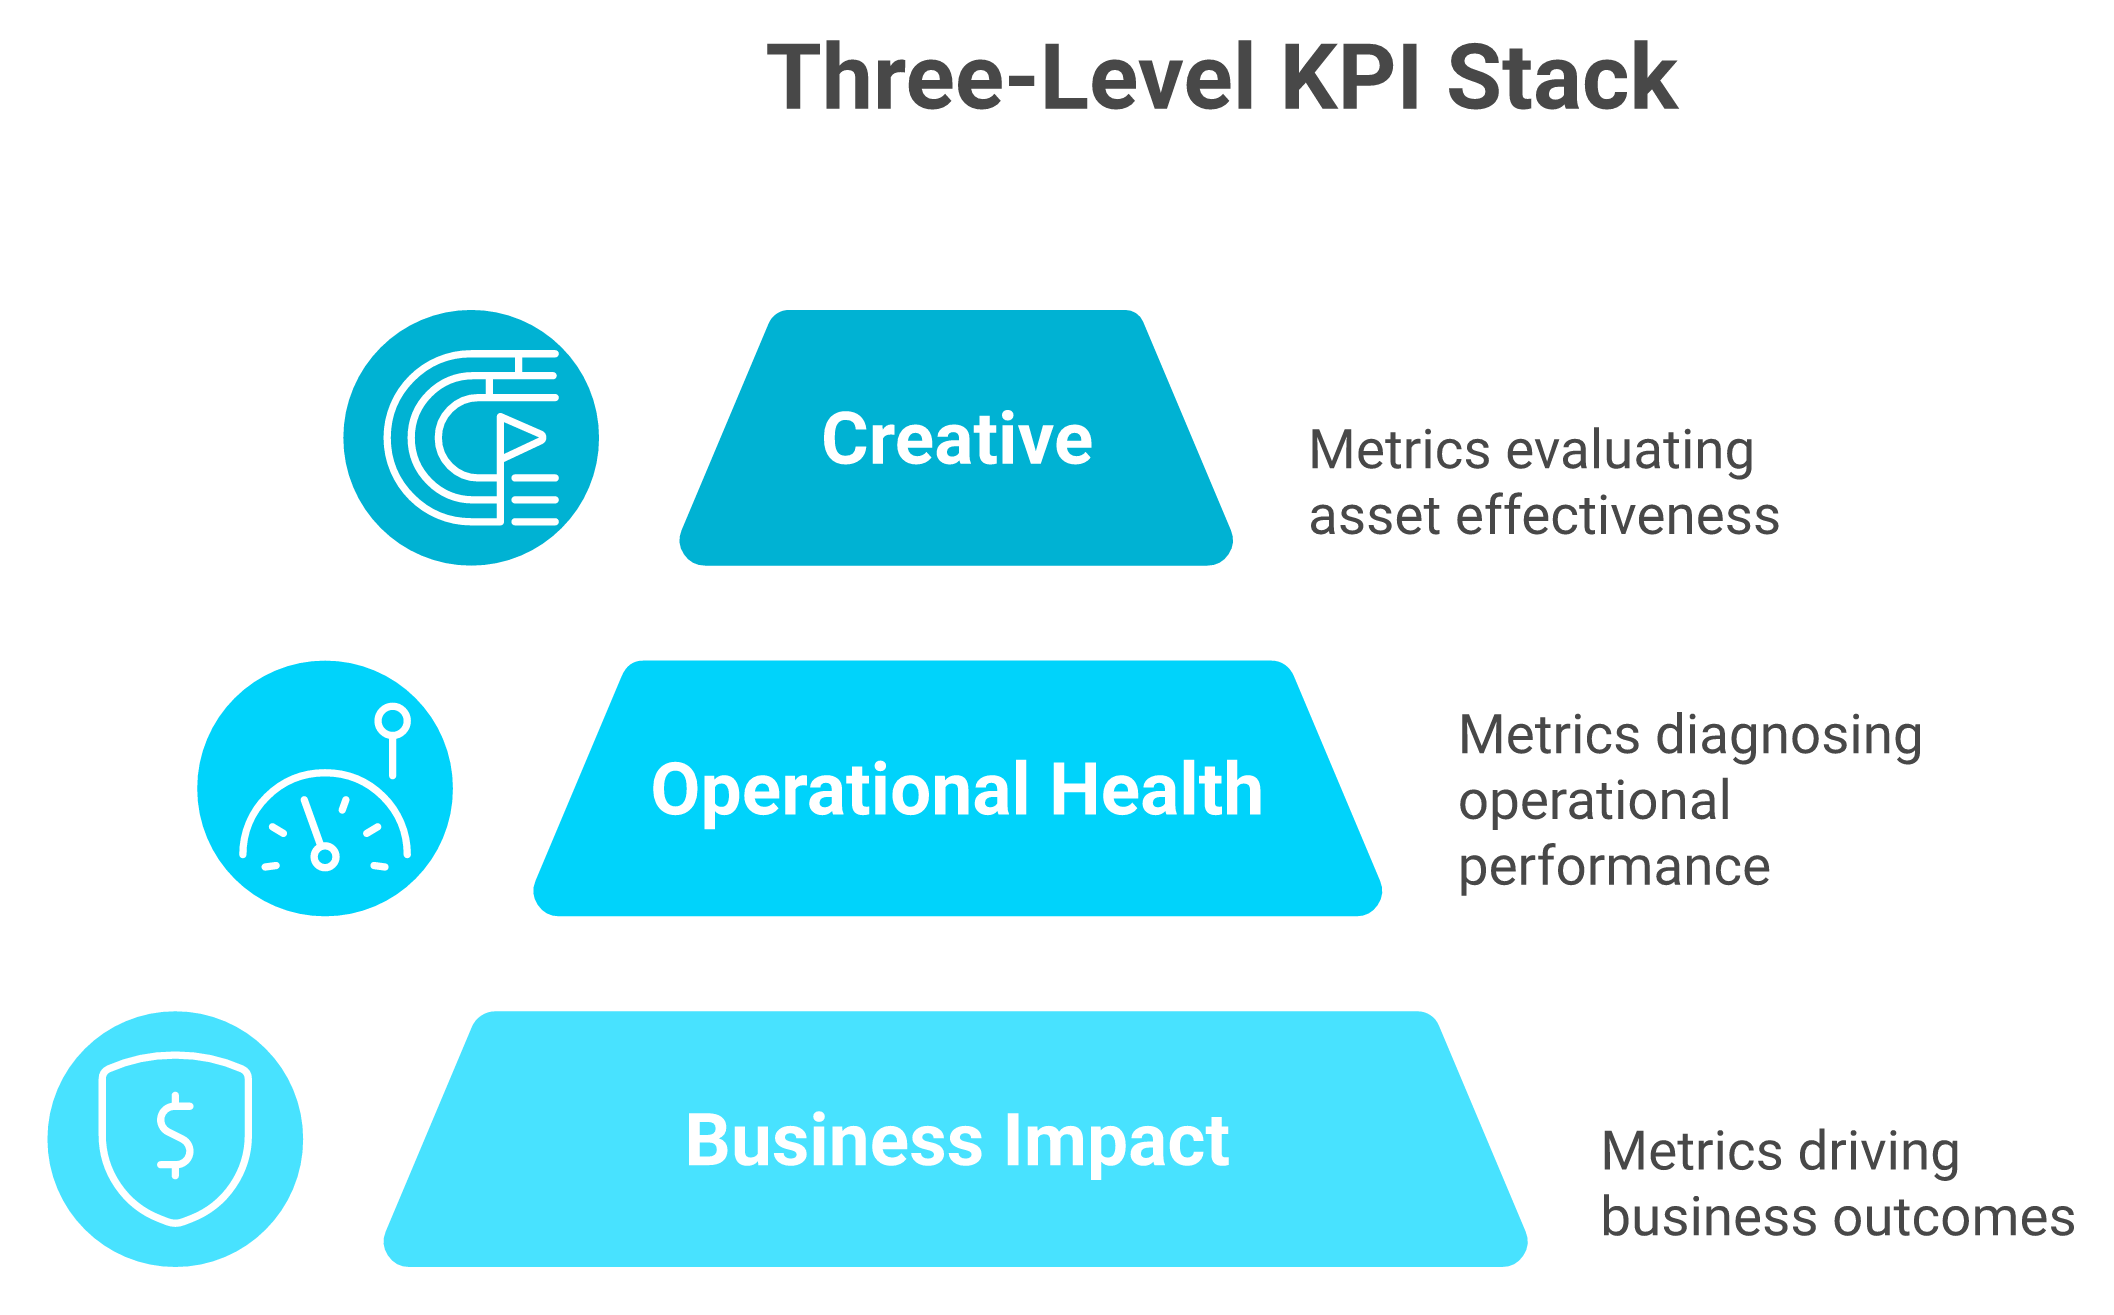
Track three to five metrics, arranged in levels. Business impact: contribution margin per order, MER, new-customer CAC, and CAC payback. Operational health: CPM, CPC, and conversion rate. Creative: hook rate and thumbstop. ROAS divides ad revenue by ad spend, while ROI measures profit against total investment, including production and tooling. Luca AI calculates contribution margin by reading ad spend and the accounting ledger inside the same query, so cost lines and campaign results resolve together.
⭐ Three levels, not one long list
Metrics are not peers. Sorting them into three levels decides which number is allowed to change your spend.
The reason most KPI lists fail is that they are flat. Twenty metrics with equal weight means no metric decides anything.
Sort them instead. Business impact metrics decide budget. Operational health metrics diagnose why the impact number moved. Creative metrics tell you which asset to rebuild. Only the first level is allowed to trigger a spend change, which is the discipline behind tracking e-commerce unit economics properly.
💰 The eight line items that decide profit
Here is the teardown that changes how founders read a healthy-looking ROAS. A $49.99 knife set, analyzed line by line, carried these costs.
Full Cost Teardown On A $49.99 Hero Product
Line item
Amount
Revenue
$49.99
Landed cost
$17.75
Storage
$0.65
Pick, pack, fulfill
$4.10
Shipping
$8.40
Payment processing
$1.75
Returns allocated
$0.62
Customer service allocated
$0.145
Customer acquisition cost
$31.00
Total cost as published
$71.30
The operator was losing $21.31 on every unit sold. Platform ROAS never showed it, because CAC and fulfillment live outside the ad account. Shackelford's framing holds up here: you want to know how much profit per order per day was made, and without that, CTR and ROAS are meaningless.
✅ Why MER survives what ROAS does not
MER, or marketing efficiency ratio, is total store revenue divided by total ad spend. It ignores attribution entirely, which is exactly the point.
Kunle Campbell's argument is that MER accounts for long lead times and repeat purchases, which makes it steadier than ROAS as cookie coverage degrades. My read is that MER should be your scaling guardrail, and ROAS should only rank creative inside one channel. Pair it with ecommerce customer lifetime value before you judge any acquisition channel.
⚠️ ROI and ROAS are not interchangeable
Operators use these two words as synonyms in the same meeting, and the confusion costs real money.
ROAS counts ad revenue against ad spend only. ROI counts profit against the full investment, including production, tooling, agency fees, and staff time. Report both, and label which costs each figure includes. A 3.0x ROAS and a negative ROI happily coexist, which is also why ecommerce profit margins deserve their own line in every review.
⏰ The one column to add this week
Add a single column to whatever sheet you already keep: margin per order, per campaign, per day. Nothing else needs to change yet.
Luca AI sits as an AI layer over your unified store data, so margin per order becomes a question you ask in plain English instead of a model you rebuild each month. Ask which cost line moved and Luca AI names the influencing components behind the shift. Dashboards place the metrics side by side and leave the arithmetic to you at 11pm on a Sunday, which is the gap conversational analytics tools were built to close.
Q4. What targets should you set before the campaign launches? [toc=4. Setting Benchmarks]
Write the target before you spend, because "did it work" has no answer otherwise. Record target CPA, order volume, spend ceiling, and breakeven margin per campaign. Then cohort your external benchmarks, because Meta median ROAS sat near 1.86 across roughly 35,000 brands in 2025, while Google sat near 3.31 across more than 18,000. Luca AI studies your own trailing performance across months and years, so the baseline it compares against is your store's history rather than a borrowed median.
✅ The pre-launch target sheet
Five fields, filled in before the campaign goes live. Keep it in the same place every time so the comparison is mechanical.
Breakeven CPA. Contribution margin per order, before ad cost. This is your ceiling.
Target CPA. Usually 60% to 75% of breakeven, which leaves room for a bad week.
Order volume target. The number of orders that justifies the spend ceiling.
Spend ceiling. The absolute figure you will not cross without a new decision.
Review date. When you will judge it, decided now rather than in the moment.
⚠️ One blended target breaks the arithmetic
This is where most target sheets go wrong. A single company-wide ROAS goal applied across channels guarantees that one channel looks broken.
Look at the medians again. Meta near 1.86, Google near 3.31, with Meta vertical medians ranging roughly 1.17 to 2.54 and Google 2.12 to 4.30, as compiled in the 2026 DTC ROAS benchmark analysis. Set a 3.0x target everywhere and you will kill a profitable Meta campaign, while over-rewarding branded Google traffic you already owned.
⏰ Cohort the benchmark or skip it
An industry median is only useful when the cohort resembles your store. Triple Whale's own Benchmarks Dashboard documentation cohorts by industry, by AOV above or below $100, and by GMV band (under $1M, $1M to $10M, above $10M).
Match all three before you borrow a number. If you cannot, use your own trailing 90 days instead. Your history is a smaller sample but a far closer match, and it already reflects your margins, your offer, and your creative quality. Good ecommerce reporting starts from your own baseline, not someone else's.
💰 Watch the input costs, not just the output
One more caveat on external targets. Meta CPM rose about 20% year over year in that same dataset, while ROAS barely moved.
So a flat ROAS target quietly becomes harder every quarter. My read is that you should re-derive targets from current CPM and conversion rate at least twice a year, rather than carrying last year's number forward out of habit.
Luca AI handles this comparison continuously. Connect the sources once, then ask in plain English whether a campaign is inside its historical pattern, and Luca AI flags the deviations in both directions, including the positive ones where you should be pushing harder. Set the cadence and those checks arrive in Slack or email without anyone opening a tool, which is what automated ecommerce reporting should actually mean.
Q5. What are the exact steps to run the analysis? [toc=5. The Analysis Loop]
Seven steps. Pull your pre-launch targets. Reconcile actuals to one date range and one attribution window. Load full costs to get contribution margin. Compare actual against plan per campaign, and flag anything more than 20% off in either direction. Trace each gap to a cause: tracking break, creative fatigue, audience saturation, or genuine underperformance. Confirm the result survives a holdout. Write one sentence naming the change and its size. Luca AI runs the reconcile, load, and compare steps on a continuous scan and surfaces the flagged variance without being asked.
⏰ The loop, in order
The order matters more than the tooling. Each step inherits the errors of the one before it, so skipping step two poisons steps three through seven.
Compare actual against plan, and flag gaps over 20%.
Trace each gap to a named cause.
Confirm with a holdout before scaling.
Write the decision sentence.
Luca AI performs steps two through four on a 24/7 scan of your connected data, then pings you when a campaign breaks pattern. That continuous watch is what separates agentic analytics tools from a dashboard you have to remember to open.
💰 Walked through one real campaign
Take a prospecting campaign with a $35 target CPA and a $600 daily ceiling. Actual CPA lands at $47, which is 34% off plan.
Step five is where most reviews stop. You check the discrepancy first, and the platform-to-store gap sits at 41%, inside the signal-loss band documented across 300 Shopify ad accounts by Vaizle. So the real CPA is probably better than $47, and the fix is tracking, not creative. I have killed profitable campaigns by skipping that check, which is an expensive way to learn it.
⚠️ The Variance Triage Table
This is the artifact I would hand a new growth hire on day one. It pairs plan variance with the platform discrepancy tiers, so one table carries the whole decision.
Variance Triage: Gap Size To Decision
Gap vs plan
Probable cause
First check
Decision
Under 10%
Normal noise
Nothing
Hold
10% to 20%
Early drift
Pacing and frequency
Hold, review in 3 days
20% to 30%
Creative fatigue or view-through credit
Hook rate, then switch to click-only
Fix
30% to 45%
Signal loss or saturation
Event match quality, audience overlap
Fix, then retest
Over 45%
Broken tracking or genuine failure
UTM and duplicate events
Fix tracking first, kill only after
Luca AI identifies which influencing components moved behind a flagged gap, so step five arrives with a candidate cause attached rather than a blank cell. Root-cause work like this is the practical use case for AI agents for data analysis.
✅ Write the decision sentence
A decision sentence has three parts: the campaign, the change, and the number. "Pause Retargeting-Broad, shift $400 daily to Prospecting-US, review Thursday."
That is it. No adjectives. Shackelford's team treats their forecast as a live document updated in real time, which only works because every review ends in a stated move. A review that ends in discussion is a meeting, not an analysis, and that distinction sits at the heart of good decision intelligence tools.
💸 Who owns which step
Steps one, five, six, and seven need judgment, which means a human owns them. Steps two, three, and four are arithmetic, which means they should never consume a Monday morning.
Luca AI inverts the usual order of work here. Instead of opening a tool to hunt for the variance, the variance opens the conversation, with the root cause and the influencing components already named. Judgment, the holdout call, and the decision sentence stay with the operator, and we think that split is the honest one. If you are weighing vendors on exactly this boundary, the framework for evaluating AI data agents is worth a read.
Q6. How often should you run it, and how long before the data is trustworthy? [toc=6. Reporting Cadence]
Match cadence to the decision. Budget moves run intraday: 9am to read profitability, 12pm and 6pm to push winners, midnight to pull budgets back toward baseline. Creative verdicts wait until the learning phase clears, roughly one to two weeks or 50 or more conversions. Margin and CAC payback close monthly against accounting data. Under 50 to 100 conversions per variant, treat the read as directional only. Luca AI pushes scheduled reports and threshold alerts into Slack or email, so the exception reaches you instead of you going to find it.
⏰ Cadence mapped to the decision
Different decisions have different clocks. Mixing them is why founders feel busy and still miss moves.
Here is the clock, not the advice. One operator walking through a live account runs four checkpoints: 9am to see if yesterday was profitable, then 12pm and 6pm to raise budgets on winners, then midnight to pull budgets back near baseline, because tomorrow's audience is unknown.
One mechanical note for budget-level campaigns. If you run CBO, where the platform distributes one budget across ad sets, set a minimum spend of roughly 10% at the ad set level, so your tested winner actually receives money. Pairing that with Facebook analytics at the ad set level is what makes intraday moves safe.
⚠️ Do not judge before the sample exists
The learning phase is the period where the ad platform is still finding buyers for you. Judging inside it produces random verdicts.
Wait one to two weeks or about 50 conversions, whichever comes first. Below 50 to 100 conversions per variant, call the read directional, and say so out loud. Luca AI flags when a campaign deviates from its own trailing pattern, which is a different and more useful signal than a raw week-over-week swing.
✅ Automate the watching, not the deciding
Brez can staff hourly human reporting across a full week. A four-person brand cannot, and pretending otherwise just means the check quietly stops happening by Wednesday.
Luca AI handles the watching side. Set a threshold in plain English, something like ping me if ROAS drops below 1.8 or inventory falls under 500 units, and the alert arrives with graphs, the reasoning, and a recommended next step. I still want a human reading it before anything moves. That alerting layer is the part of ecommerce monitoring tools that actually earns its keep.
💸 What I would actually put on the calendar
If I were rebuilding this for a $3M brand today, it would be four recurring blocks. A ten-minute morning pacing check. A Thursday creative review. A Monday channel-mix read. A monthly close with the accountant.
Luca AI's scheduled reports cover three of those four, since the monthly close still needs a human signing off on the ledger. Everything else runs as exceptions, which is the only cadence that survives a busy quarter.
Q7. How do you tell a real winner from a phantom one? [toc=7. Proving Incrementality]
Run a holdout. A campaign only wins if revenue falls when you switch it off. Before judging, split new-customer from returning performance, because a 4.0x blended ROAS can hide 2.1x on acquisition. Add a thank-you-page question asking how customers first heard about you, as a signal that does not depend on tracking. Then respect the reverse trap: one retailer killed branded search and lost an estimated $40,000 in two weeks. Luca AI isolates which customer cohorts absorbed the change after a holdout runs.
⭐ Most operators have this backwards
The common belief is that better attribution software produces truth. It produces precision, which is not the same thing.
Multi-touch attribution, meaning software that splits credit across the clicks it can see, is not customer journey analysis. Kunle Campbell makes the distinction plainly: it tracks what customers click and distributes credit mathematically, which leaves brand equity and offline touchpoints out entirely. Andrew Faris and Olivia Kory of Haus went further in 2026, arguing that incremental measurement now frequently beats standard attribution for DTC, and that stitched third-party models add false precision. If journey-level context is what you are missing, start with ecommerce customer journey analytics.
💸 The split that exposes phantom wins
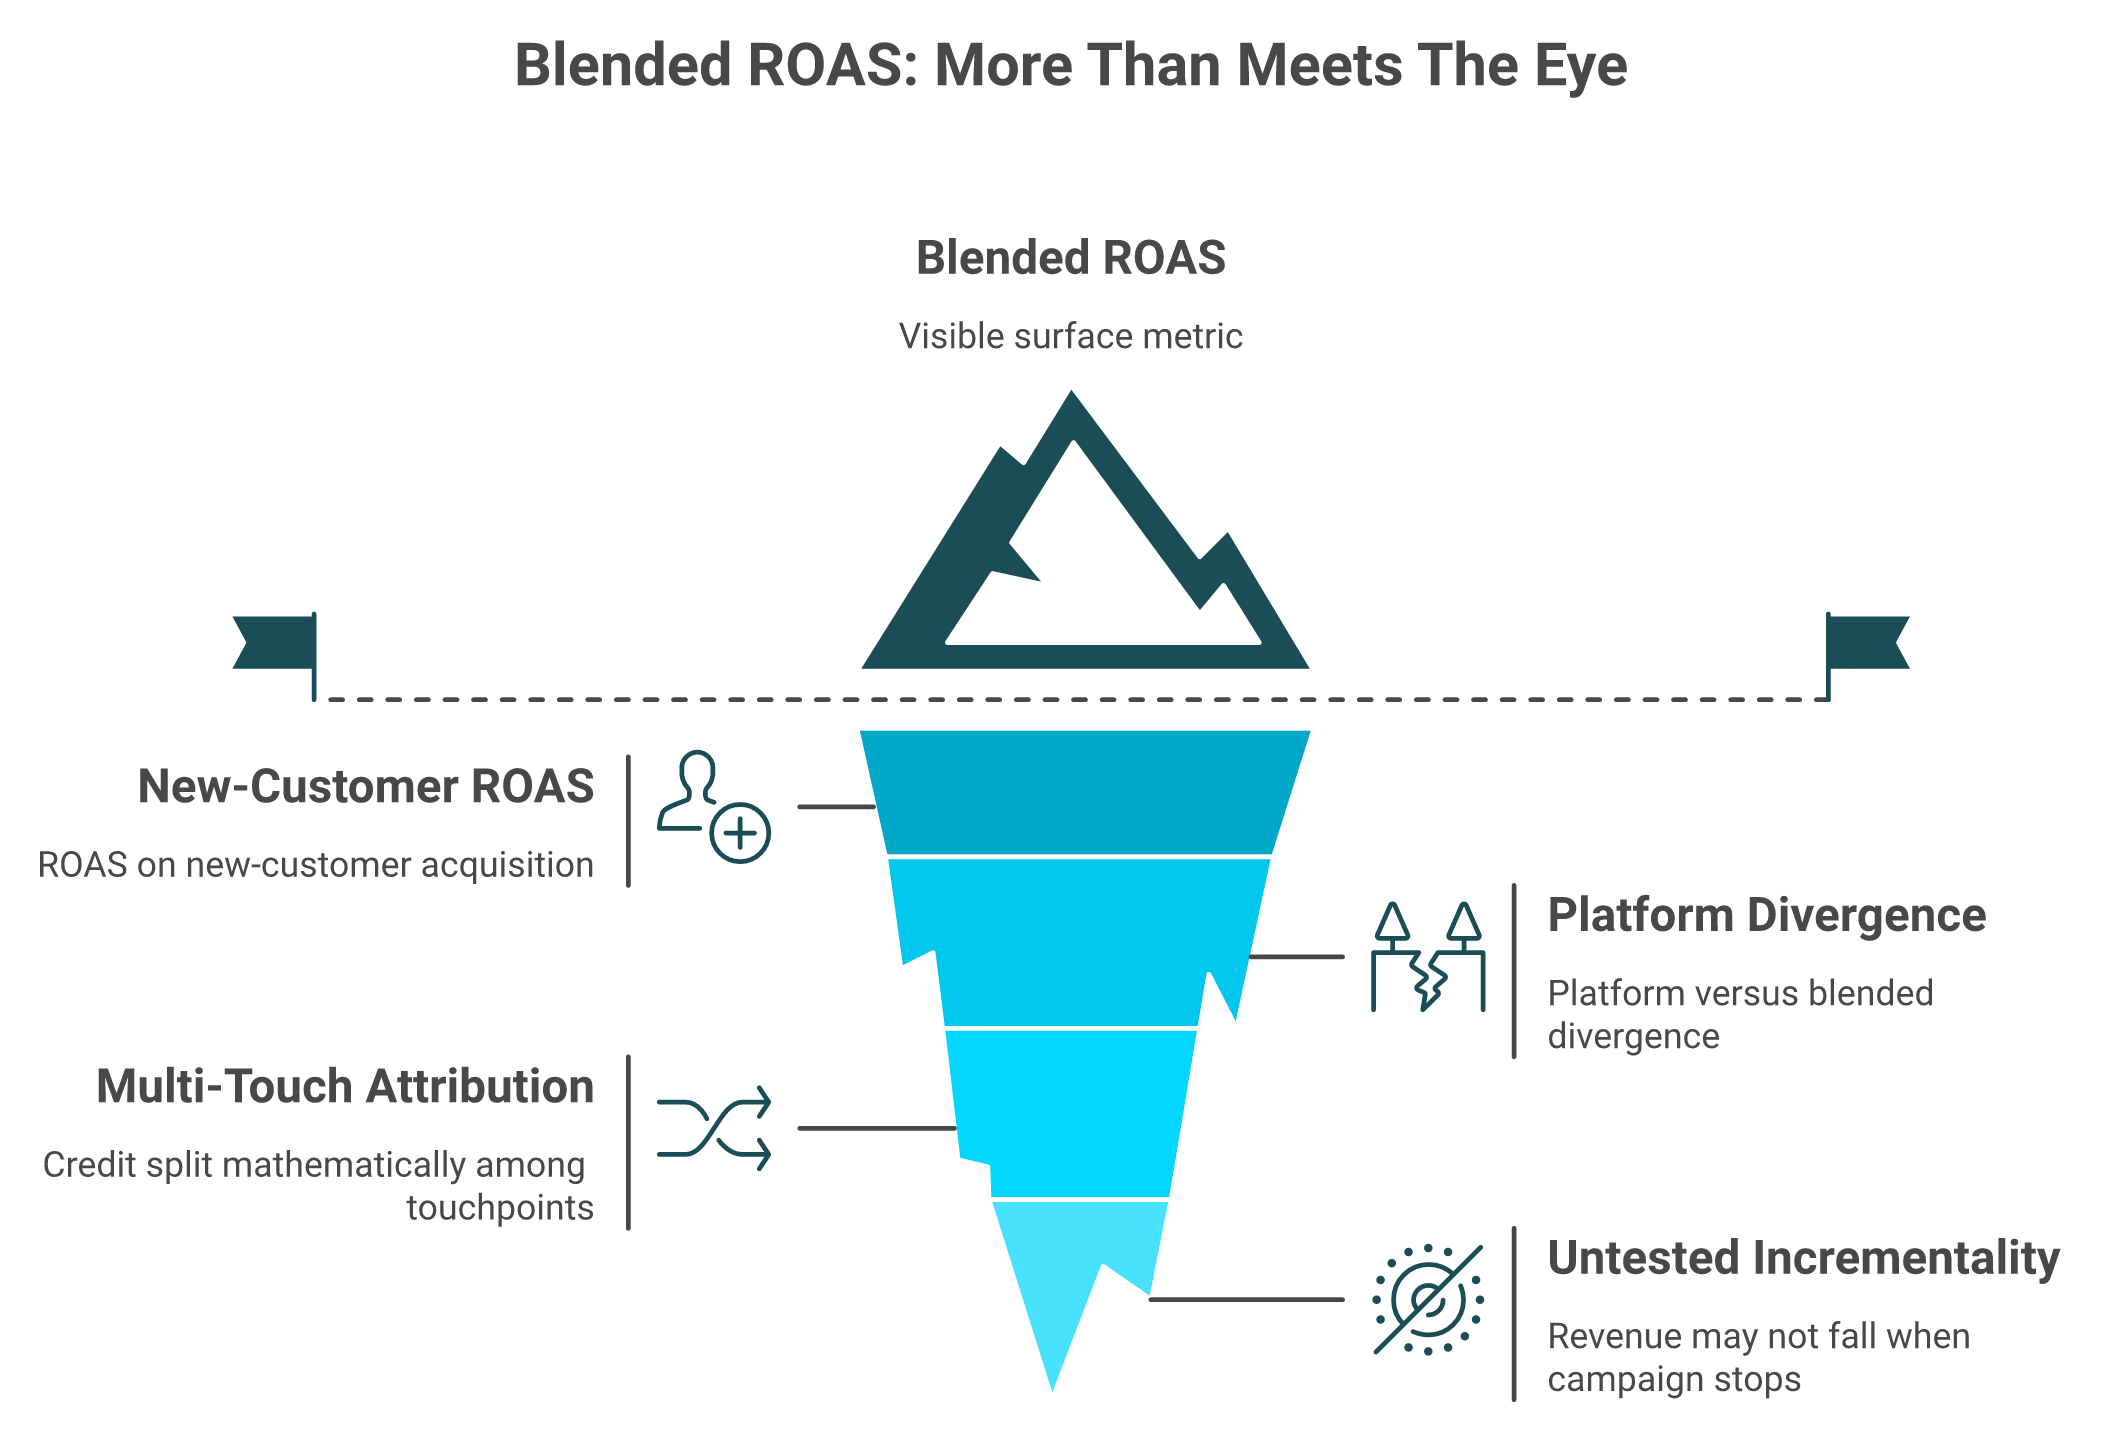
The blended figure is the tip. New-customer economics and untested incrementality sit underneath it.
Blended numbers hide the thing you actually buy with ad money, which is new customers.
A practitioner teardown of Triple Whale deployments found 4.0x blended ROAS masking 2.1x on new-customer acquisition, with platform-versus-blended divergence of 20% to 60% after iOS 14. Buyers notice the same gap in the tooling itself.
"Some data we still notice discrepancies between platforms, for example, tracking ads, and differences in the reported metrics like revenue." — Verified User, Mid-Market Marketing, Triple Whale - G2 Verified Review (4/5), 20 April 2023
"It has pretty substantial limitations for ecommerce tracking and often isn't close to accurate for conversion rate, number of orders, or revenue." — Verified User in Information Technology and Services, Google Analytics - G2 Verified Review (1.5/5), 9 May 2019
"Conversions are back-dated to the date of the click, not the date of purchase." — Operator reply, r/PPC Reddit Thread, December 2023
Luca AI measures new-customer and returning performance as separate cohorts by default, because the blended figure is where phantom winners hide. That cohort split is also the foundation of honest customer profitability analysis.
⚠️ The counter-case nobody mentions
Here is where the contrarian take needs a brake. Branded search looks like credit theft, so operators kill it.
Greg Swan of Tinuiti, a firm that has managed over $3 billion in paid media, documented a retailer who switched off branded search and lost roughly $40,000 in two weeks before turning it back on. Competitors took the top slots. So test, do not assume, in either direction.
✅ A holdout you can run next week
Pick one channel. Hold out two or three comparable geographic regions for two weeks. Compare total store revenue in held-out regions against matched control regions, not platform-reported conversions.
Luca AI can simulate the expected revenue effect against your own historical patterns before you spend two weeks finding out live. My read is that the simulation narrows which test is worth running, and the live holdout still settles it. The cohort arithmetic afterward, which is where most operators quietly give up, is the part Luca AI does for you. Simulation of this kind is where predictive analytics tools for ecommerce stop being a buzzword.
Q8. How do you analyze creative when most of it never gets spend? [toc=8. Analyzing Creative]
Analyze messages, not audiences. The algorithm already knows your customer, so audience and structure insights are mostly noise. Expect most creative to receive near-zero spend. One ad team jokes that 90% of their work goes in the bin, because the algorithm ignores it. Judge the surviving 10% on contribution margin, hold 70% of budget on proven winners and 30% on tests, shift to 90/10 when performance dips, and isolate one variable per test.
⚠️ The scoreboard most teams never see
Luke Bean, who runs the ad team at Valente, describes a standing joke internally: roughly 90% of the creative his team produces goes straight in the rubbish bin without receiving any spend at all.
Sit with that for a second. If most of your creative never spends, then most of your "creative analysis" is analyzing assets the algorithm never tested. The real question is not which ad performed best. It is which message earned distribution, which is a different read than any standard AI marketing analytics report gives you.
💸 Where the money usually gets wasted first
The expensive mistake is production order. Brands commission the cinematic shoot, then discover the angle was wrong.
Brez ran it the other way around. The team smoke-tested angles using the lowest-lift statics possible, a product on a plain background with bold text calling out one claim, testing stress relief against focus against energy. Cheap assets, one job: find which sentence people stop for.
⭐ Then build like Lego, not like a film
Only after an angle survived did Brez build video around it. The method is modular: simple blocks for hook, benefit, and solution, rearranged into new variations instead of shot fresh each time.
Winning statics became scripted videos, then dedicated offer landing pages, and the brand scaled to roughly $5M per month across two years. The sequence is the lesson, not the number. Cheap test, then production spend only behind proven messages.
💰 The budget split that keeps testing alive
Here is the allocation rule I would hold to. Put 70% of budget behind proven winners and 30% behind ongoing tests.
When performance dips, shift to 90/10, or briefly 100% winners, until the next round of tests lands. The instinct during a bad week is to kill testing entirely. That feels safe and quietly guarantees you have nothing to scale next month, which is the slow version of a broken ecommerce growth strategy.
✅ Isolate one variable, and write it down
Savannah Sanchez, a D2C creative specialist, gives the discipline that makes any of this measurable: isolate as many variables as possible, change little, and keep a document of everything you test.
Change the hook and the offer and the format at once, and a win teaches you nothing. One variable per test, logged with the date and the result. My read is that the test log matters more than the test, because the log is the only thing that compounds.
❌ What to stop analyzing
Three habits to drop from your creative review this week.
Audience and interest-layer reports. Creative is the targeting mechanism now.
Campaign structure debates, beyond the basic CBO minimum-spend setting.
Any asset that spent under about $100, since it has no signal in it.
Spend the recovered hour on the surviving winners instead, asking which message is carrying them and what the next variation of that sentence looks like.
Q9. How much should you budget to lose on purpose, and when are you too small to analyze? [toc=9. Budgeting for Learning]
Budget a fixed learning line, and stop grading it on ROAS. Brez spent $75,000 to $100,000 in its first quarter purely to find out what worked. Rent is survival, ad spend is education, and requiring first-order profitability on every campaign removes all testing room. Below roughly 30 to 50 orders a month, channel-level attribution work does not pay back. Read blended numbers instead, and spend the saved hours on offer and creative.
💸 The situation every founder recognizes
You have $20,000 for the month. Every dollar feels like rent money, so every campaign has to pay for itself this week.
That instinct is why most brands stall. Shackelford put the distinction plainly: rent is survival, ad spend is education, and confusing the two breaks you fast. Brez bought learnings before earnings, and the first quarter bill for that education ran between $75,000 and $100,000.
⚠️ Why first-order profitability caps you
Here is the complication nobody prices in. If every campaign must be profitable on the first purchase, you can only run offers you already know work.
So you stop testing. Then your winners fatigue, which they always do, and you have no bench. Digital Darts puts the failure rate bluntly: roughly 90% of Shopify stores lose profit when they try to scale Facebook ads. My read is that most of those stores were never funding discovery in the first place, which is a planning failure more than an ecommerce growth strategy failure.
💰 How to size the learning line
Treat it as a separate budget with its own scoreboard. I would set it between 10% and 30% of monthly ad spend, depending on how stable your winners are.
Stable winners, strong margin: 10% to 15% to testing.
Winners fatiguing, margin fine: 25% to 30%.
Cash tight: drop to 10%, but never zero.
Grade that line on learnings per dollar, meaning validated angles, hooks, and offers, not on ROAS. Everything else stays on the performance budget where ROAS rules apply. Sizing it against runway is far easier once you forecast cash flow for e-commerce properly.
⏰ When you are genuinely too small for this
Now the uncomfortable half. Sophistication has a floor, and most guides pretend it does not.
An operator in that r/PPC attribution thread made the point that at 30 to 50 orders a month, the time and tooling cost of channel-level attribution does not pay back. You simply do not have the sample. Treat anything under 50 to 100 conversions per variant as directional.
✅ What to do below the floor
If that is you, here is the honest playbook. Watch three numbers: total revenue, total ad spend, and contribution margin on your top three products.
Then spend the recovered hours on the two levers that actually move at low volume. Raise average order value through bundles or a better offer. Improve the landing page so the traffic you already pay for converts. Attribution sophistication can wait until volume gives it something to measure, and Shopify's own analytics will carry you until then.
💸 The trap on the way up
One last warning, because I see this at the $2M mark repeatedly. Founders cross the volume floor, buy the tooling, and then quietly cut the learning budget to pay for the tooling.
That is backwards. Better measurement with nothing new to measure is an expensive mirror. Keep the testing line funded first, then add the instrumentation that tells you which tests won.
Q10. Which tools can actually run this analysis, and where does each stop? [toc=10. Choosing Analytics Tools]
Five options, each stopping somewhere different. Luca AI is an AI layer over your unified store data: ask in plain English and get prediction, simulation, root-cause analysis, and scheduled reports. Triple Whale provides attribution dashboards you still interpret yourself. Supermetrics moves data between sources, though reviewers report inaccurate Shopify daily sales totals. GA4 is modeled and sampled. Agencies deliver monthly decks on retainer. Choose based on which gap is costing you money.
⚠️ The problem is rarely missing data
Most brands I audit already have the data. They have eight tools and no answer, which is a synthesis problem, not a collection problem.
So pick on one criterion: who does the reasoning? If the tool stops at a chart, you are still the analyst. Luca AI was built for that specific gap, with data normalized on ingestion, so the reasoning starts immediately rather than after a cleanup project. That is the dividing line across most ecommerce analytics platforms.
💰 Honest capability comparison
Campaign Analysis Capability By Tool
Capability
Luca AI
Triple Whale
Supermetrics
GA4
Agency
Unifies commerce, ads, email, accounting
Yes
Marketing-weighted
Pipes only
No
Manual
Plain-English questions
Yes
Partial
No
No
Via email
Root-cause and influencing components
Yes
Limited
No
No
Sometimes
Prediction and simulation
Yes
Limited
No
Modeled
No
Scheduled push reports with reasoning
Yes
Alerts
No
No
Monthly deck
Replaces a junior analyst
Largely
No
No
No
Partly, at cost
💸 What verified buyers actually report
The limits are documented by the people paying for these tools.
"1. The tool promises a robust series of direct connectors; however, the connectors rarely update without breaking. 3. The query time out limit is severely shorter than the industry standard." — Verified User, Agency Reporting Lead, Supermetrics - G2 Verified Review (0/5), 18 November 2021
"Sampling, sampling, sampling. When we switched to an enterprise web analytics solution that does no sampling, we found that Google Analytics was telling us we had twice as much traffic as we actually do." — Gitai B., Marketing, Web Analytics and Testing Lead, Google Analytics - G2 Verified Review (1/5), 22 November 2016
Three cases, stated plainly. Luca AI does not fit enterprises that already employ a data team, since they want warehouse control and SQL access.
It does not fit stores below the data volume where patterns exist to reason against, which ties back to the floor in the previous section. And Luca AI is not a marketing attribution pixel, so brands whose single problem is click-level attribution should buy an attribution tool instead. Those buyers are usually better served comparing Triple Whale alternatives on attribution depth alone.
⚠️ The agency question
An agency is a tool choice too, and it deserves the same scrutiny. Jen Van Wart of Twigs described paying a digital marketing consultant $5,000 to $15,000 a month, and leaving debriefs unable to explain what had just been said. She then spent another $5,000 sending two staff to a certificate course, and heard nothing productive back from either.
Luca AI replaces the reporting half of that relationship, not the strategy half. We think an agency earns its retainer on creative and offer work, and loses it the moment the deliverable is a slide deck of impressions. For brands weighing that swap, the practical comparison is against an AI data analyst for ecommerce.
Q11. The analysis says scale. How fast can you actually get the capital? [toc=11. Funding Winning Campaigns]
A winning campaign you cannot fund is a deadline, not a win. Judge capital on three numbers: effective cost of funds, time from decision to money in account, and the paperwork between them. Wayflyer charges a fixed fee of about 5% to 10% and funds in 24 to 48 hours after approval, which converts to roughly 14% to 36% effective APR, depending on repayment speed. Luca AI prices capital dynamically against live performance data and disburses same-day, with no separate application cycle.
⏰ Before: the window closes while you apply
Richie Jones at VAST wired weather data and category velocity into a BI layer to spot European heatwaves as they formed. The move was a $50,000 opportunistic budget uplift to buy cheap CPMs while demand spiked.
That window is days wide. A funding cycle measured in days to weeks means you buy the CPM after it has already risen. The cost of slow capital is not the fee. It is the price you pay for media once everyone else notices.
Wayflyer holds 4.6 across 536 Trustpilot reviews, with 90% at five stars and 7% at one. The speed praise is real and consistent. The one-star cluster is where the detail lives.
"I made 28 payments. Then I missed two payments during a cash-flow problem. On August 31, Wayflyer terminated the agreement and declared the entire remaining balance of $23,386.10 immediately due, giving me two days to pay it." — Emily Bishop, Store Owner, Wayflyer - Trustpilot Verified Review, September 2026
"Sales team was great, Ops team was terrible. They pulled funds far faster than the contract stated thereby increasing the effective interest rate significantly." — Thomas Bishop, Ecommerce Founder, Clearco - Trustpilot Verified Review, July 2026
Terms like these are exactly why revenue-based financing deserves a line-by-line read before signing.
✅ After: what to have ready now
Three things, before the next winner appears. Know your effective APR at your realistic repayment speed, not the headline fee. Know whether a UCC lien is filed, because it affects your next facility.
And keep your performance data live and connected, since every data-led underwriter prices off it. Luca AI's capital sits on that same live data, which is why pricing adjusts with verified performance instead of a one-time risk snapshot, and why the disbursal step has no application packet attached.
Q12. What quietly ruins a campaign performance analysis? [toc=12. Mistakes to Avoid]
Five habits. Grading success on platform-reported ROAS alone. Reading a blended average that hides unprofitable acquisition. Calling a test before the learning phase clears. Accepting monthly decks built on impressions and CTR with no contribution margin. And setting impossible targets, like a 15% conversion rate on cold traffic, which guarantees every analysis reads as failure. Each one is fixable in an afternoon.
❌ Ranked by what they cost you
Order matters here, because the first mistake invalidates everything downstream.
Platform ROAS worship. The number is self-reported by the party being graded. Reconcile first.
Blended averages. Split new-customer from returning before judging anything.
Early test calls. Wait for the learning phase and the conversion floor.
Impression-led reporting. If contribution margin is absent, the deck is decoration.
Impossible targets. This one masquerades as ambition.
The fifth habit deserves its own paragraph, because operators rarely notice they are doing it.
One operator ran the arithmetic on a plan requiring 15 sales from 100 visitors, and called it what it is: a 15% cold-traffic conversion rate is almost impossible to hit. Build a forecast on that, and every weekly review reads as underperformance, which eventually makes you distrust the analysis itself.
💰 The two levers that actually move
When the math does not work, conversion rate is the hardest input to change. Raise average order value, or lower cost per click.
Bundles, volume discounts, and a stronger offer move AOV within a week. Better creative and tighter targeting move CPC. Both change the arithmetic faster than another round of landing-page tweaks aimed at a conversion rate that was never achievable. Watch the effect on ecommerce profit margins rather than on session counts.
❌ Three more things to stop doing
These come straight from how the better operators now work.
Stop producing cinematic video before a cheap static has proven the angle.
Stop bringing audience and interest-layer insights to a creative review.
Stop accepting reporting that never mentions margin per order.
✅ The one change to make before your next report
Pick a single fix, not five. Add the reconciliation step from Q2 to the top of your next campaign review.
Everything else in this article depends on it. If your actuals are wrong, your variance is wrong, your cause is wrong, and your decision is a coin flip wearing a spreadsheet. Get the numbers trustworthy, then make the call. When you want that reconciliation to happen without you, that is what automated ecommerce reporting is for.
FAQ's
What is a campaign performance analysis, and how is it different from campaign reporting?
A campaign performance analysis compares actual results against targets you wrote down before launch, traces spend through to profit rather than clicks, and ends in a single decision: scale, hold, fix, or kill.
Reporting and analysis are not the same job:
Reporting shows spend, impressions, clicks, and platform-reported ROAS.
Analysis explains why the gap against plan exists, names the cause, and states the change.
The practical test we use is simple. Did a budget, a bid, or a creative brief actually change within 48 hours of the review? If nothing moved, the meeting was reporting dressed up as analysis.
Luca AI treats the arithmetic half of this work as automated: it reconciles connected sources, loads full costs, compares actuals against plan, and surfaces the flagged variance with a candidate root cause attached. The judgment half, meaning the holdout call and the final decision, stays with the operator.
Write the decision as one sentence containing a number. "Pause Retargeting-Broad, shift $400 daily to Prospecting-US, review Thursday" is an analysis. "Prospecting is doing well" is a status update. If you want the deeper argument on why platform-reported numbers mislead this process, read our breakdown of declining platform ROAS versus true profitability.
Why do my ad platform numbers never match my Shopify revenue?
They answer different questions. Ad platforms attribute influence inside click and view windows, and they back-date a conversion to the date of the click rather than the date of purchase. Your store counts settled orders, net of refunds.
Use the gap size as a diagnostic rather than a frustration:
Under 10 percent: normal modeling noise, proceed.
10 to 20 percent: expected signal loss, confirm date ranges align.
20 to 30 percent: view-through credit inflating results, switch to click-only.
30 to 45 percent: server-side gaps, check event match quality.
45 percent or more: duplicate events or broken UTMs.
Two rules follow from the mechanics. Never sum platform-reported revenue across channels, because each one claims the same sale. And never try to date-match your store ledger to platform rows day by day, because back-dating makes that reconciliation structurally impossible.
Luca AI normalizes and standardizes every connected source on ingestion, so Shopify, Meta, Google, Klaviyo, and your accounting ledger arrive on one revenue definition and one date logic before anyone asks a question. That removes the Monday morning spreadsheet rebuild. For the setup layer underneath it, see how we approach ecommerce data integration.
Which KPIs should I track, and how many are too many?
Track three to five metrics, arranged in levels, and let only the top level trigger a spend change.
Business impact: contribution margin per order, MER (total revenue divided by total ad spend), new-customer CAC, and CAC payback period.
Operational health: CPM, CPC, and conversion rate, used to diagnose why the impact number moved.
Creative: hook rate and thumbstop, used to decide which asset to rebuild.
Two definitions worth separating in every review. ROAS divides advertising revenue by advertising spend only. ROI measures profit against the full investment, including production, tooling, agency fees, and staff time. A 3.0x ROAS and a negative ROI coexist happily.
The reason margin sits at the top is arithmetic. A $49.99 product carrying $17.75 landed cost, $4.10 pick and pack, $8.40 shipping, $1.75 processing, allocated returns and support, plus $31.00 CAC, loses $21.31 on every order while the ad account still reports a respectable return.
Luca AI calculates contribution margin by reading ad spend and the accounting ledger inside the same query, so cost lines and campaign results resolve together rather than in separate tabs. If you are building this from scratch, start with our guide to the best way to track e-commerce unit economics.
How often should I run a campaign performance analysis, and how long before the data is trustworthy?
Match the cadence to the decision, not to the calendar. Different decisions have different clocks, and mixing them is why founders feel busy while still missing moves.
Budget up or down: intraday checks, using spend, orders, and margin per order.
Creative keep or cut: weekly, once a variant has 50 or more conversions.
Channel mix shift: monthly, using MER and new-customer CAC.
Payback and cash position: monthly close against the accounting ledger.
On trustworthiness, wait until the platform's learning phase clears, roughly one to two weeks or about 50 conversions, whichever comes first. Under 50 to 100 conversions per variant, call the read directional and say so out loud. Early verdicts produce random outcomes that feel like insight.
Most teams land weekly in practice, with a smaller group reviewing daily. The constraint is rarely discipline; it is that manual checks quietly stop happening by Wednesday in a four-person brand.
Luca AI pushes scheduled reports and threshold alerts into Slack or email, so the exception reaches you instead of you going to find it. Set a threshold in plain English, and the alert arrives with graphs, reasoning, and a recommended next step. See how that works in practice in automated ecommerce reporting.
How do I prove a campaign is actually driving incremental revenue?
Run a holdout. A campaign only wins if total store revenue falls when you switch it off. Better attribution software gives you precision, which is not the same thing as truth.
A workable test design for next week:
Pick one channel, not the whole account.
Hold out two or three comparable geographic regions for two weeks.
Compare total store revenue in held-out regions against matched controls, not platform-reported conversions.
Before judging anything, split new-customer from returning performance. A 4.0x blended ROAS can hide 2.1x on acquisition, which is where phantom winners live. Add a thank-you-page question asking how customers first heard about you, as a signal that does not depend on pixels at all.
Then respect the reverse trap. Branded search looks like credit theft until you test it: one retailer documented losing roughly $40,000 in two weeks after switching branded campaigns off, because competitors took the top slots. Test, do not assume, in either direction.
Luca AI simulates the expected revenue effect against your own historical patterns before you spend two weeks finding out live, then isolates which cohorts absorbed the change afterward. The cohort arithmetic is where most operators quietly give up. More on that reasoning layer in our overview of predictive analytics for ecommerce.
Enjoyed the read? Join our team for a quick 15-minute chat — no pitch, just a real conversation on how we’re rethinking Ecommerce with AI - Luca
Loading Schedule...
Your AI Co-Founder is here.
Here’s why:
Shopify, Meta, Xero - one brain.
"Should I scale?" Answered with real data.
Growth capital. No applications. One click.
Thank you! Your submission has been received! Please book a time slot for the Meeting
Oops! Something went wrong while submitting the form.