Segmentation Analysis: A Complete Guide to Market and Customer Segmentation
mins read
TL;DR
Segmentation analysis only counts if it changes one of three decisions: who you stop emailing, which cohort you pay to acquire, or which product you push second.
Run customer segmentation before market segmentation once you have 500 or more purchasers, because the data is already yours and the actions reverse inside a week.
Only behavioral, needs-based, and value-based segmentation reliably predict purchase. Demographic and firmographic cuts belong in context, never as the driver.
Score RFM on quintiles, use the median repurchase gap instead of the mean, and expect Champions near 8 to 12 percent of customers carrying 45 to 60 percent of revenue.
RFM scores revenue, not contribution margin, so add SKU-level acquisition cost, return rate, support cost, and discount dependence before acting on any segment.
Most segmentation failures are timing failures. Track segment migration weekly, hold one definition as system of record, and refresh monthly at minimum.
Q1. What is segmentation analysis, and what does it change in your store on Monday? [toc=1. What It Changes]
Segmentation analysis is the process of splitting your market or customer base into groups that behave differently, then analyzing each group to decide what to do differently for it. For an operator, it should change three things: who you stop emailing, which cohort you pay to acquire, and which product you push second. If it changes none of those, you labeled customers instead of analyzing them.
💸 The customer table nobody opens
Open your Shopify admin and click Customers. That table already holds order count, total spent, last order date, and first product purchased. Most stores never sort it. They treat it as a mailing list, not a dataset.
That is the gap. Segmentation is not a new data project. It is reading data you already paid to collect, then acting on the differences inside it. The same logic underpins any serious approach to ecommerce customer analytics.
⚠️ What unsegmented spend actually costs
The cost is not theoretical. Electronic Arts once put 22% of revenue into blasting identical messages to every gamer on its list. Their own data team eventually flagged how poorly it worked.
Smaller stores do the same thing at smaller scale. Ryan Daniel Moran puts it bluntly: most founders fail because they try to make a product for everyone, then waste money on advertising that connects with nobody. Attentive's 2026 research found 64% of shoppers think brand messages are too generic, and 81% ignore them.
✅ The three-decision test
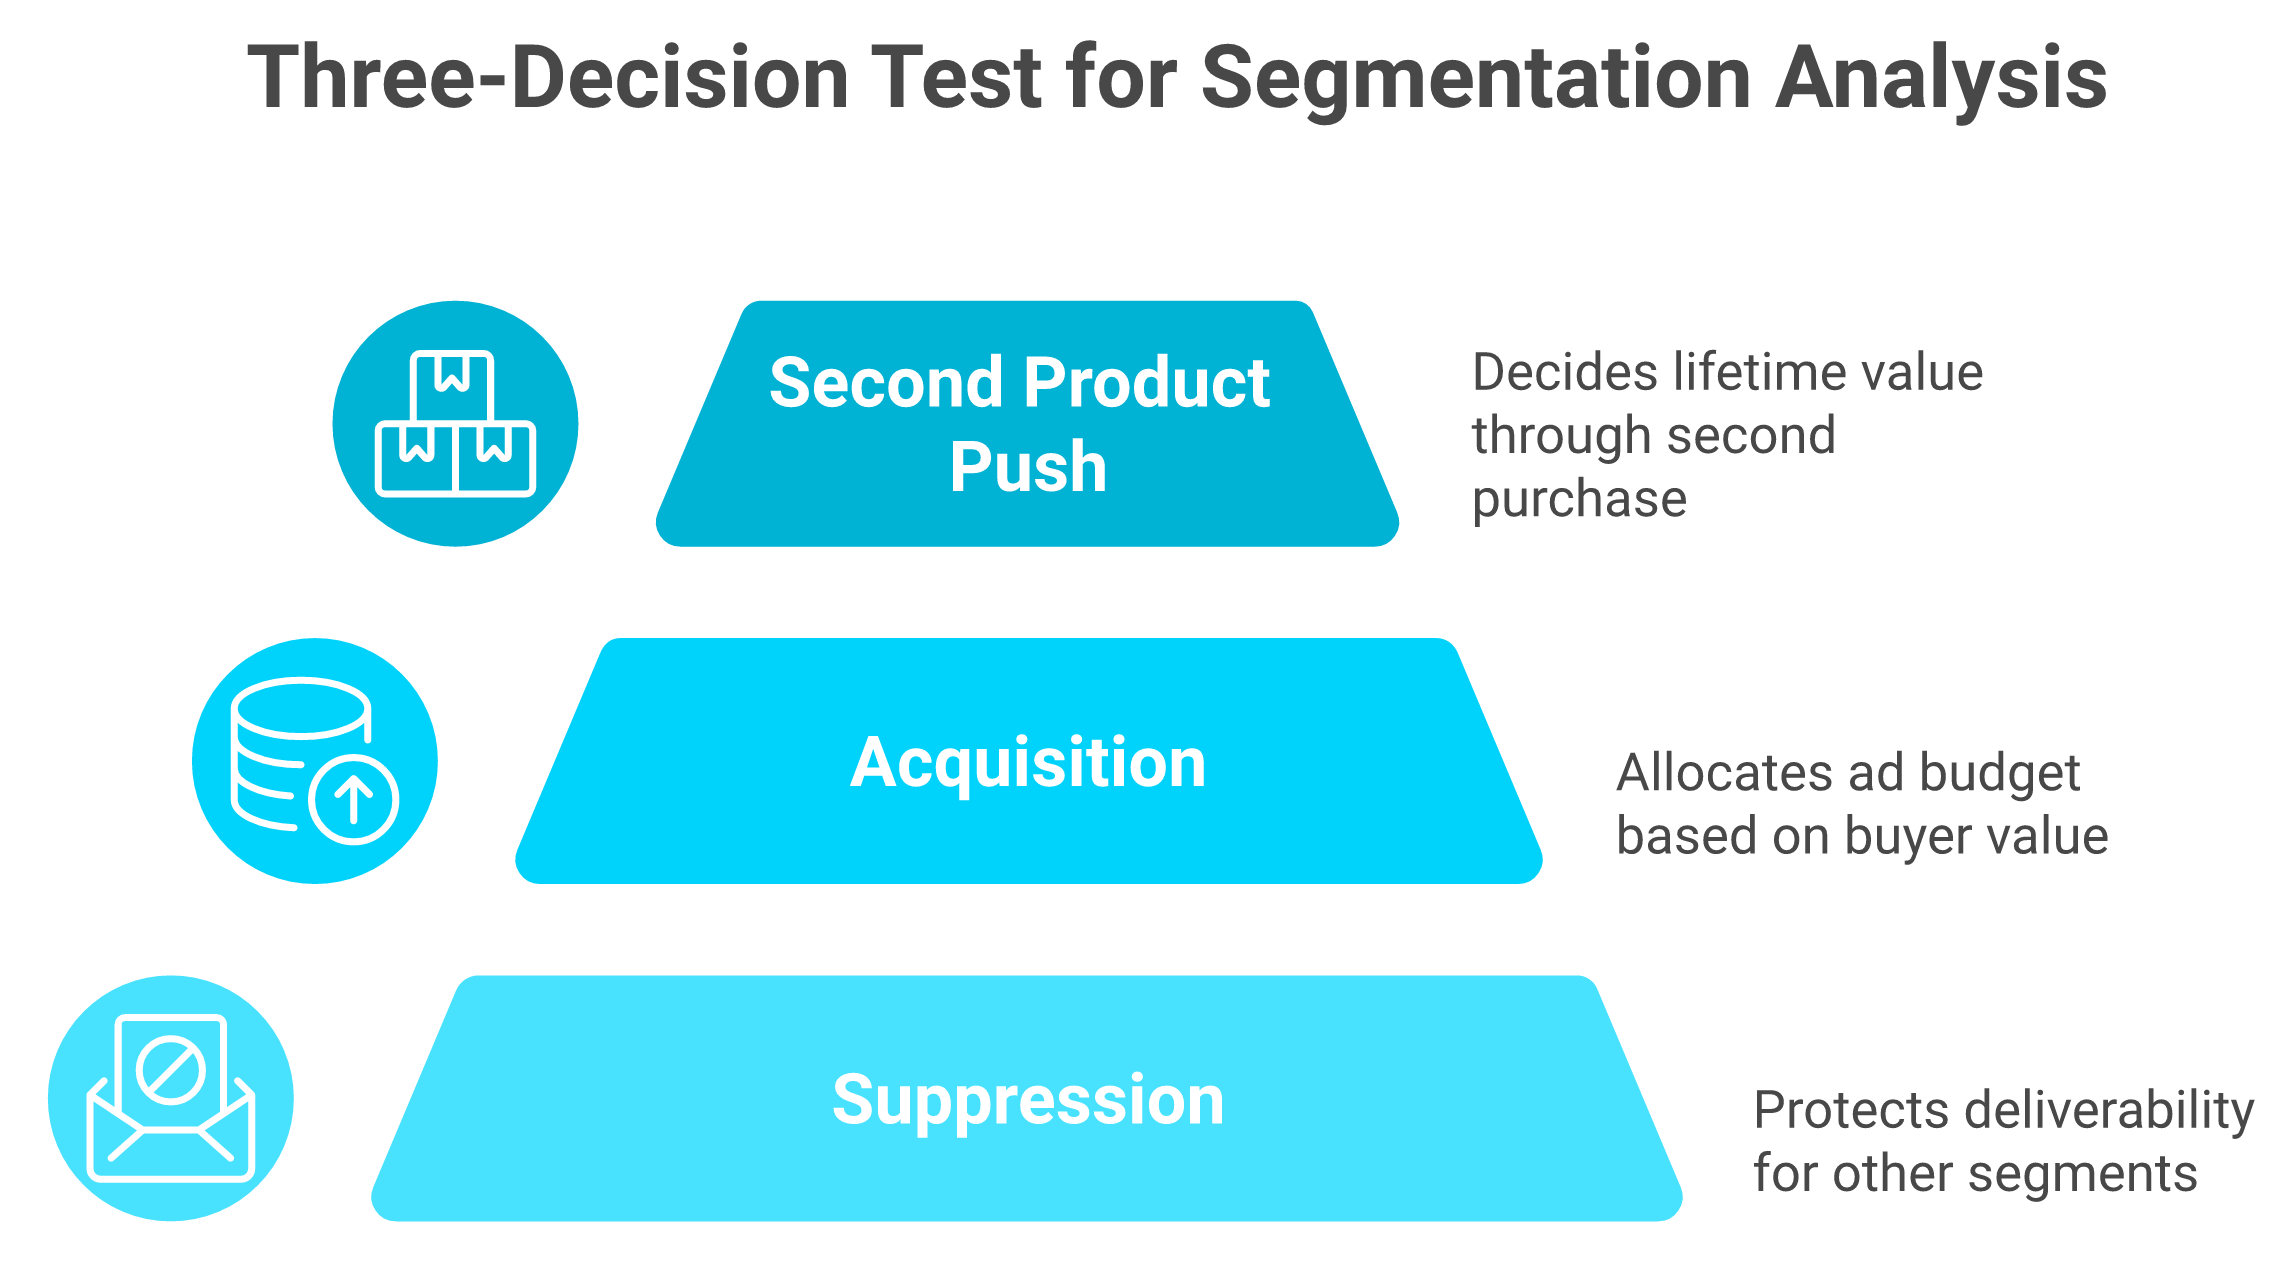
Before you build a single segment, name the decision it has to change. I use three, because they are the only ones that move cash inside 30 days.
Who you stop emailing. Suppression protects deliverability for everyone else, and it costs nothing to implement.
Which cohort you pay to acquire. If one entry product produces buyers worth twice as much, your ad budget should know that.
Before building a single segment, name the decision it has to change. These three are the only ones that move cash inside 30 days.
If your segmentation output cannot be mapped to one of those three, it is a labeling exercise. I have watched good analyses die in a Drive folder for exactly that reason.
⭐ Where most guides lose the thread
Almost every article on this keyword stops at the definition and the types list. That is fine if you are writing an exam. It is useless at 11pm on a Sunday when you are deciding whether to send tomorrow's campaign to the full list.
The useful version of this work is narrow. Pick one decision, cut the data one way, act, then measure whether the group moved. Everything else in this guide is in service of that loop.
Luca AI sits as an AI layer over a store's connected data, including Shopify, Klaviyo, Meta, and accounting sources, and normalizes it on ingestion. In our deployments, the first question operators ask is some version of "which customers are worth more and why," which is this section's question with money attached.
Q2. Market segmentation or customer segmentation: which one are you actually doing? [toc=2. Market vs Customer]
Market segmentation divides the whole addressable market, including people who have never bought from you, to decide where to compete. Customer segmentation divides your existing database using transaction and behavioral data, to decide what to send, cross-sell, and defend. With 500 or more purchasers, run customer segmentation first. The data is already yours, and the actions are reversible inside a week.
🔍 The two jobs side by side
These get used interchangeably in agency decks. They are different jobs with different owners and different cadences.
Market Segmentation vs Customer Segmentation
Dimension
Market segmentation
Customer segmentation
Data source
Market research, surveys, competitor sets, panel data
Shopify orders, Klaviyo events, site behavior, support tickets
Question it answers
Which market should we enter or position against?
What do we send, cross-sell, or suppress for each group?
Typical owner
Founder, brand lead
Growth lead, retention lead
Cadence
Annually, or before a launch
Continuously, or monthly at minimum
⏰ Why the existing table wins on sequence
Market work is slower and less reversible. April Dunford's positioning waterfall runs through competitive alternatives, unique attributes, value and proof, target market characteristics, and finally market category. That is a quarter of work, and it should be, because the output reshapes your whole brand.
Customer segmentation is a Tuesday afternoon. You already have the orders. You can build a group, send to it, and read the result inside ten days. For a store with revenue already flowing, that speed difference decides the order of operations, which is why ecommerce customer segmentation comes first for most teams.
💰 The honest reason agencies lead with market work
Market segmentation bills better. It produces a deck, a persona set, and a workshop. I have paid for that deck. It was not wrong; it was just slower to pay back than sorting my own customer table would have been.
My read is that most $1M to $10M stores are over-invested in market segmentation and under-invested in customer segmentation. The exception is a genuine new category or a new geography. Then you need the market side first, because your existing customers cannot tell you about a market they are not in.
⚠️ One trap in the sequence
Do not run customer segmentation on a list smaller than a few hundred purchasers. The groups get too small to send to, and the results read as noise. Below that threshold, segment on two things only: new versus returning, and first product purchased.
Luca AI reads across Shopify, Meta, Google, Klaviyo, and accounting data in one place, so market-level and customer-level questions run against the same numbers. That matters mostly because it stops the two analyses from disagreeing with each other, which is the core promise of proper ecommerce data integration.
Q3. Which of the seven segmentation types actually predict what someone will buy? [toc=3. Seven Types Ranked]
There are seven working types: demographic, geographic, psychographic, behavioral, firmographic, technographic, and needs-based, plus value-based as a commercial overlay. Only behavioral, needs-based, and value-based reliably predict purchase. Demographics fail because "women aged 25 to 34" holds your best subscriber and your one-time discount hunter in the same bucket. Any message written for that group lands on neither.
Shopify's own segmentation guidance lists behavioral data as purchase frequency, recency, AOV, category affinity, browsing, discount sensitivity, lifecycle stage, and channel engagement. HubSpot's 2026 State of Marketing found 29% of marketers rate shopping habits as the most valuable segmentation data, more than any identity attribute.
❌ Why the demographic habit persists
Because platforms sell it. Reddit's own marketing material leads with age, gender, income, and education, and cites Panasonic lifting ROAS 30% by targeting life events like moving and marriage. That works for an ad platform, which needs targetable attributes.
It works far worse inside your own database, where you have actual behavior. Dunford's point is that a useful segmentation needs to go well beyond demographics or firmographics. Her example is a "diet muffin" that should have been repositioned as a "gluten-free paleo snack." No demographic cut gets you there.
Operators say the same thing less politely:
"Generally behavioral data is best here. Less emphasis on attributes. So think, how often a particular customer leaves a particular item or priced item in a cart, how many days they do this, how many visits. Don't think, age, gender identity, home address, income." — Commenter, r/dataengineering Reddit Thread, Feb 2024
"Hell no. It's an amazing body of theory, but trying to execute to it in practice is a nightmare. First, you have to design a research plan to assess the psychographics of your audience." — Commenter, r/marketing Reddit Thread, Sep 2023
"RFM is segmentation for data scientists. The analysis of such measures often refines segments. Nothing new is usually uncovered. YMMV." — u/mixliv_, r/ecommerce Reddit Thread, Jul 2023
That last one is worth sitting with. I disagree with it, but it is an honest warning. Scoring customers tells you nothing if you do not attach an action to each group.
✅ The four columns to start with
You do not need new tooling for any of this. Build these four columns from your Shopify export: first product purchased, number of distinct categories owned, days since last order, and share of orders placed with a discount code.
That is behavioral, value-based, and needs-adjacent in one sheet. Everything else is refinement, including anything you later build inside Shopify custom reports.
⚠️ How narrow is too narrow
Target as narrowly as you can to hit near-term sales objectives, then broaden later. If you sell gloves that appeal to woodworkers and gardeners, pick one. Your core customers carry the message outward.
The limit is capacity. Divide your required orders by a realistic conversion rate. If the answer is bigger than the segment, the segment is too small, and no amount of message precision fixes that.
Luca AI measures predictive strength by cutting lifetime value against each available attribute, so the ranking above gets tested against a specific store rather than assumed. In our audits of customer behavior analytics, category count and first product beat every demographic field we have looked at.
Q4. How do you conduct a segmentation analysis step by step? [toc=4. Step-by-Step Process]
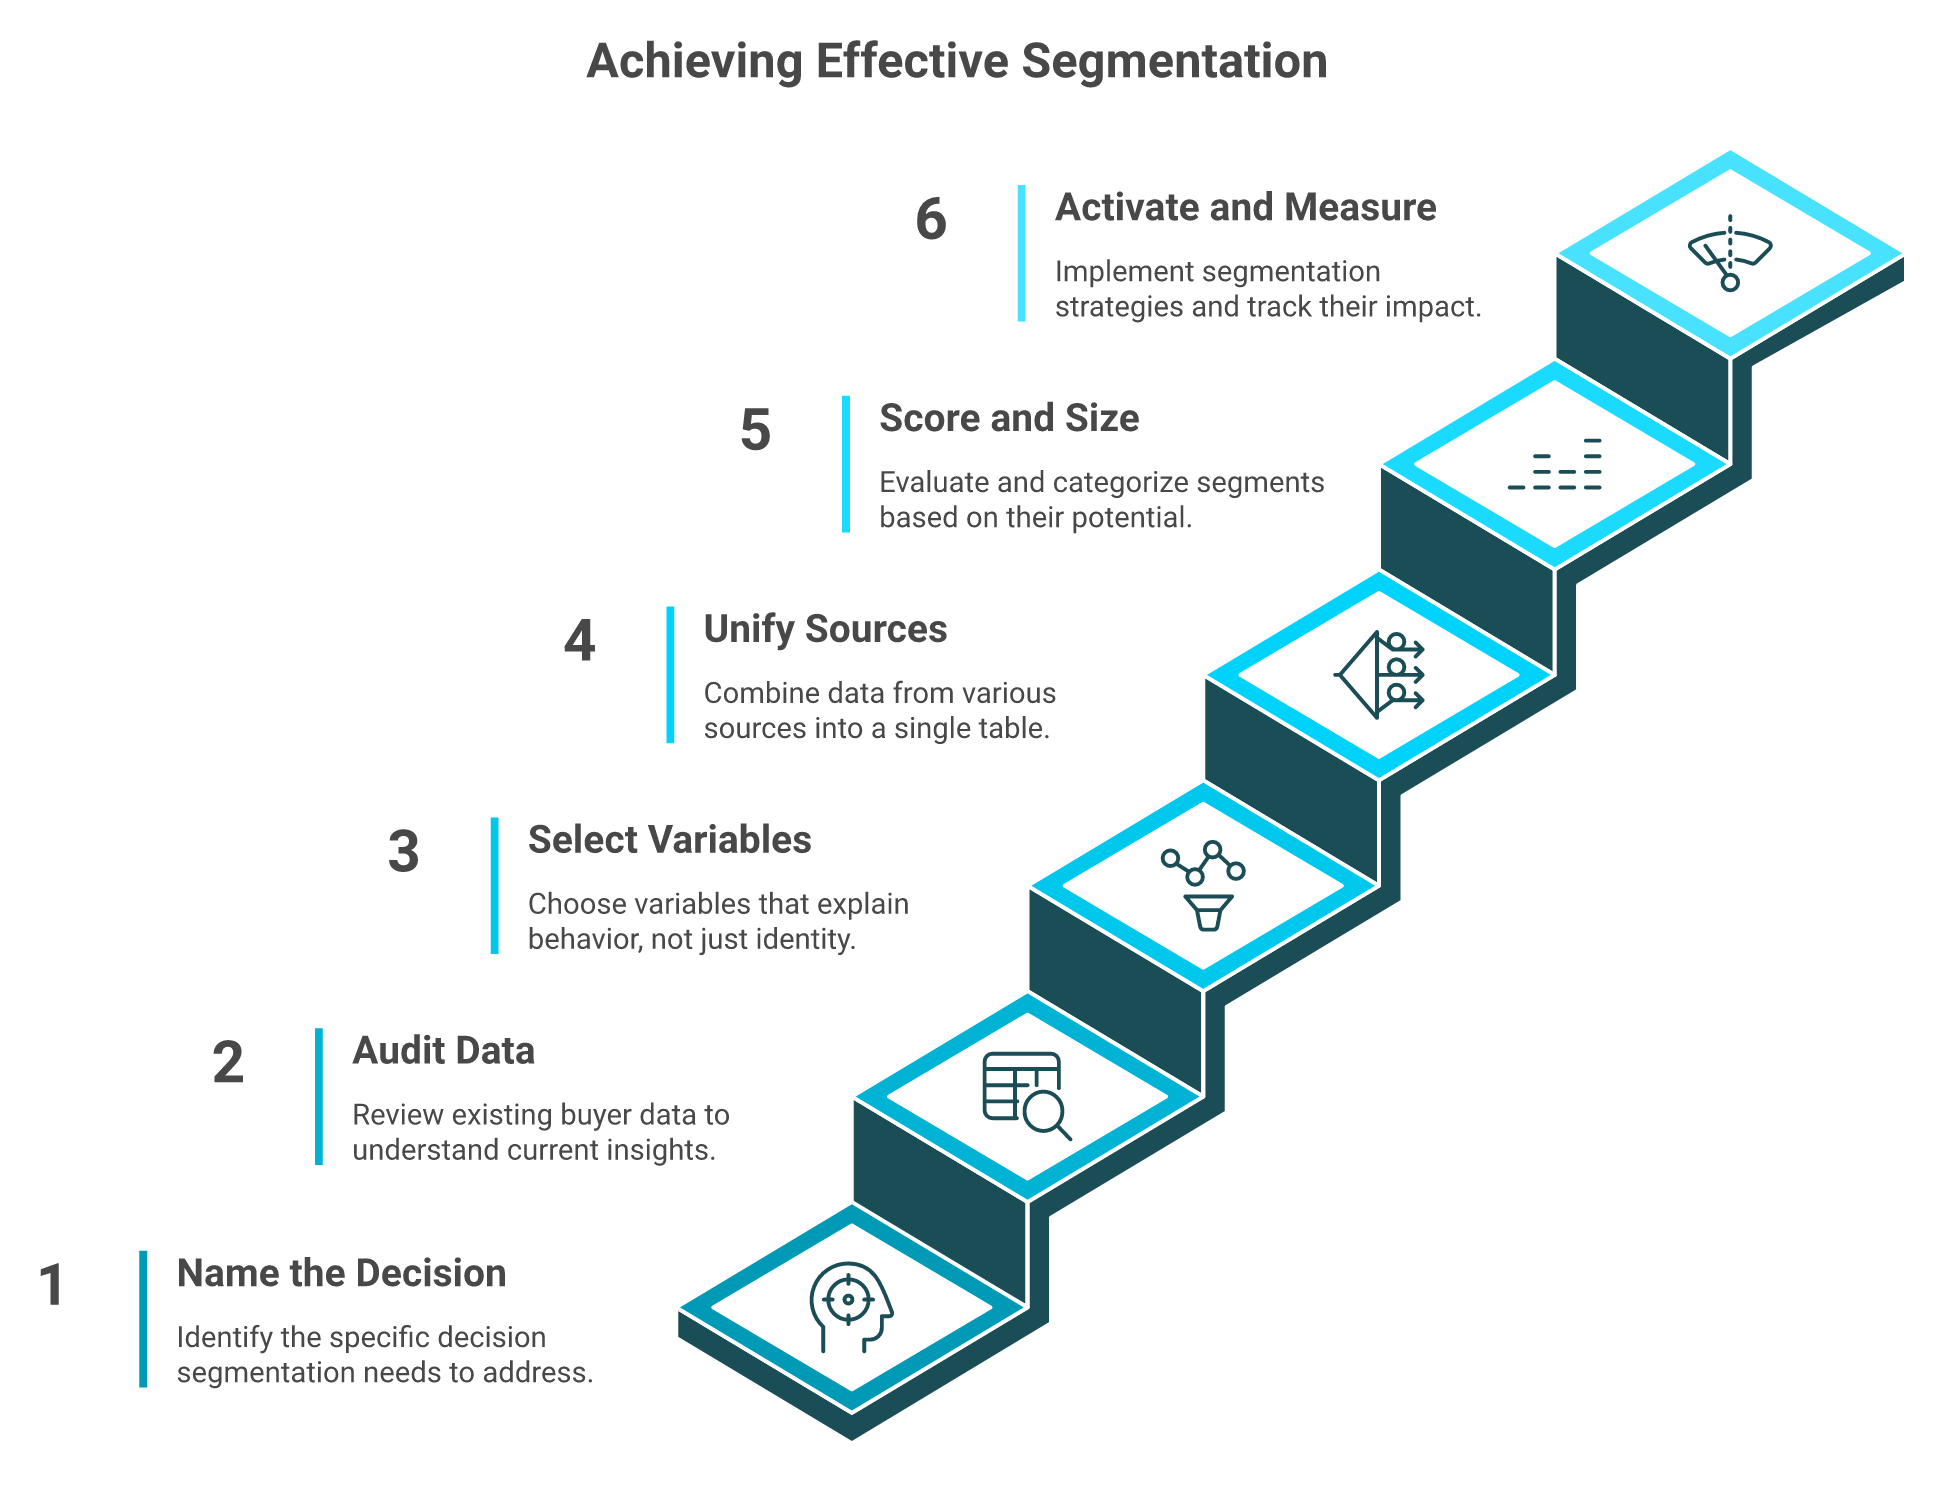
Six steps. Name the decision the segmentation must change. Audit your existing buyers. Choose variables that explain behavior, not identity. Collect and unify the data. Score and size the segments. Activate with exclusions, then measure migration. Before acting, test each segment against five criteria: measurable, reachable, substantial enough to matter, distinct from its neighbors, and actionable with a resource you already have.
✅ The six steps
Name the decision this segmentation has to change.
Audit the buyer data you already hold.
Pick variables that explain behavior, not identity.
The six steps in execution order, with the five-criteria gate every segment must clear before activation.
🔍 Step 2 and 3 in practice
Your audit is a list, not a project. Write down what you actually have: order history, order dates, discount usage, email events, support tickets, and any quiz answers. Then write down what you do not have.
Then pick variables. The test is simple. If the variable cannot plausibly change what you would send or spend, it does not belong in the model. Device type usually fails this test. Days since last order never does.
⚠️ The five viability criteria
Run every proposed segment through these before anyone writes copy for it.
Measurable. You can count the people in it today, not estimate them.
Reachable. You have an email, a phone number, or an ad audience for them.
Substantial. It is big enough that a lift would show up in revenue.
Distinct. It behaves differently from the segment next to it.
Actionable. You can serve it with a resource you already have this month.
Most failed segmentation decks fail on the last two. The groups look different on a slide and behave identically in the data. Or they are genuinely different, and nobody has the bandwidth to serve them separately.
💰 Step 5: the sizing math nobody writes down
Sizing is arithmetic, and it saves weeks. Take the orders you need from this segment. Divide by a realistic conversion rate for the channel. That number is your minimum viable segment size.
If you need 60 orders and expect 2% conversion, you need 3,000 reachable people. A 400-person segment cannot deliver it, however precise your messaging is. Broaden the criteria or pick a different segment.
⏰ Step 6: activation and the thing to measure
Activation means attaching one action and one exclusion list to each segment. Then measure migration, not just opens. Migration is how many customers moved up or down a tier this month.
Aggregate revenue can rise while every segment degrades underneath it. Migration is the number that catches that early, and it belongs in your standing set of ecommerce KPIs. Shopify's guidance makes the same point about segment definitions updating as behavior changes.
Luca AI runs this loop as a standing query rather than a monthly rebuild. Connect the sources once, ask for the segment cut in plain English, and set the migration report to arrive weekly in Slack or email through automated ecommerce reporting.
Q5. How do you build RFM segments from your own Shopify data? [toc=5. RFM Scoring Build]
Export order history, score each customer 1 to 5 on recency, frequency, and monetary value using quintiles, map the combinations to segments, and attach one action to each. Start from these thresholds: under four months since last order counts as recent in most categories, and three purchases a year marks a frequent buyer. Use the median gap between orders, never the mean.
⏰ Before you start: the data gate
RFM has a minimum data requirement, and almost no guide mentions it. Klaviyo's own RFM report needs at least 500 purchasers, 180 days of order history, orders inside the last 30 days, and a paid analytics plan.
If you are below that, do not force it. Segment on two things only: new versus returning, and first product purchased. That is enough to run your first useful campaign split.
✅ The scoring walkthrough
Export Customers from Shopify with order count, total spent, and last order date.
Sort by days since last order. Split into five equal groups. Top fifth scores 5.
Repeat for order count, then for total spent.
Concatenate the three scores into one code, for example 5-5-5.
Map codes to named segments.
Attach exactly one action and one exclusion to each segment.
Kunle Campbell frames the whole method well: RFM runs on paying attention to what people do, not what they say. All you need is when they bought and how much they spent. That is also the cheapest entry point into ecommerce customer segmentation.
The Eleven RFM Segments and One Action Each
Segment
RFM pattern
What it means
The one action
Champions
5-5-5
Recent, frequent, high spend
Early access, referral ask
Loyal
4-5 / 4-5 / 3-5
Reliable repeat buyers
New collection first look
Potential loyalists
4-5 / 2-3 / 2-3
Promising, not yet habitual
Second-purchase nudge
Recent buyers
5 / 1 / 1-2
Just bought once
Onboarding and education
Promising
4 / 1 / 1-2
New, low spend
Cross-sell the gateway product
Need attention
3 / 3 / 3
Drifting mid-tier
Reminder plus reason to return
About to sleep
2-3 / 1-2 / 1-2
Cooling off
Low-cost reactivation
At risk
1-2 / 3-4 / 3-4
Good buyers going quiet
Win-back with real incentive
Cannot lose them
1 / 4-5 / 4-5
Former best customers
Personal outreach, not a blast
Hibernating
1-2 / 1-2 / 1-2
Long gone, low value
One last try, then suppress
Lost
1 / 1 / 1
Inactive
Suppress
⚠️ Median, not mean
When you measure the time between purchases, use the median. The mean gets dragged by subscription buyers and one extreme outlier.
I have seen a store set its win-back trigger at 90 days because the mean said so. The median was 41 days. Every win-back email fired seven weeks too late.
💰 The distribution sanity check
Here is the diagnostic I rely on. Champions should land near 8% to 12% of customers, carrying roughly 45% to 60% of revenue. If your distribution comes out flat, your scoring window is wrong, not your customers.
Then run ten real profiles through the logic before anything goes live. Lake House Group makes the point plainly: RFM is a prioritization model, not a messaging strategy.
Operators doing this by hand tend to simplify, and that is fine:
"We define our customer segments primarily based on their purchase history over the past year. We have 3 main tiers. Top customers: Let's say they have spent over $3,000 in the past 12 months." — u/adymcke, r/ecommerce Reddit Thread, Jul 2023
"Not being able to pull out the daily stats/ metrics to analyse in Excel. I would have liked to go deeper to see how it does on a daily basis or create my own custom reports." — Verified user, Marketing, 4/5, Triple Whale G2 Verified Review, Apr 2023
"Sometimes it does not update the numbers correctly and has errors with synchronisation." — Verified user, Ecommerce, 3/5, Triple Whale G2 Verified Review, Apr 2023
Luca AI removes the export step, which is the step that makes this work stale. Recency decays daily, so a sheet scored on Monday misroutes win-backs by Thursday. Luca normalizes Shopify, Klaviyo, Meta, and accounting data on ingestion, so you can use conversational analytics for ecommerce to ask which customers left Champions this week and get the slice plus the cause.
Q6. Which segments deserve a campaign, and which should you stop emailing? [toc=6. Activate or Suppress]
Treat high-monetary frequent buyers as VIPs with perks and advocacy prompts, and work low-monetary frequent buyers with volume discounts and cross-sells to lift AOV. Stop campaigning to the lapsed-and-infrequent group entirely, because they drag deliverability for everyone else. Klaviyo reports roughly three times more revenue per recipient from targeted segments than from indiscriminate sends. Luca AI monitors these groups continuously and alerts on movement rather than waiting for a campaign to underperform.
💰 Two frequent buyers, two completely different plays
Frequency alone tells you nothing about what to send. Two customers can both buy five times a year and need opposite treatment.
High-monetary frequent buyers get exclusivity. Early access, a real human note, a referral ask. Low-monetary frequent buyers get volume economics: bundles, tiered discounts, and cross-sells aimed at raising order value.
❌ The group to stop mailing
Campbell is direct about this. The lapsed and infrequent group should generally be avoided, because they have shown no interest in engaging. Mailing them costs you sender reputation, which costs you inbox placement for the segments that do convert.
I know suppression feels like leaving money on the table. It is the highest-return thing on this list, and it takes an afternoon. It also belongs in any serious set of customer retention strategies for ecommerce.
⚠️ The exclusion checklist nobody writes down
Before any segment enters a flow, exclude these. This is the deliverable that prevents the embarrassing send.
Anyone who bought in the last 7 to 30 days, depending on your repurchase cycle
Profiles without marketing consent
Orders with delayed or failed fulfillment
Customers with an open support ticket
Active subscribers getting a different sequence
Wholesale accounts and internal test profiles
Luca AI tracks these conditions across connected order, support, and fulfillment data, so the exclusion logic is checked against live context rather than a stale list. That depends on real ecommerce data integration rather than a one-off export.
⭐ Why flows beat campaigns
Klaviyo's 2026 benchmarks, drawn from more than 183,000 customers, found flows made up about 5.3% of sends but produced roughly 41% of email revenue. Revenue per recipient on flows ran close to 18 times campaigns.
That is the real argument for segmentation. Triggered, behavior-based sends to small groups outperform broad campaigns by an order of magnitude.
Operators describe the shift the same way:
"So far, we had been mailing all customers similar communications. But after moving to moda, they helped us with the segmentation suggestions shortly after we installed it. We got to understand who are our most loyal customers, who hadn't ordered in a while, and more." — u/RetentionGuy, r/shopify Reddit Thread, Feb 2023
"We typically categorize our audience according to their behaviors, such as those who have shown interest in a product but haven't made a purchase, along with their lifecycle stage or subscription plan. So far, our most successful strategies have involved emails and on-site notifications." — u/jinforever99, r/ecommerce Reddit Thread, Jul 2023
"Sometimes the data takes time to update, and some ratios are more difficult to understand." — Juliette P., CEO, 4.5/5, Polar Analytics G2 Verified Review, Jan 2026
⏰ Measure movement, not opens
Open rates tell you about subject lines. Migration tells you whether segmentation worked. Count how many customers moved up or down a tier this month.
Luca AI runs that count as a standing report, with the contributing metrics named, delivered to Slack or email on whatever cadence you set through automated ecommerce reporting.
Luca AI treats this as monitoring, not reporting. Set the condition you care about, such as a falling Champions count, and the alert arrives with the influencing components identified. You find out when the segment moves, not when the campaign misses.
Q7. Is product category crossover a bigger LTV lever than purchase frequency? [toc=7. Category Crossover Lever]
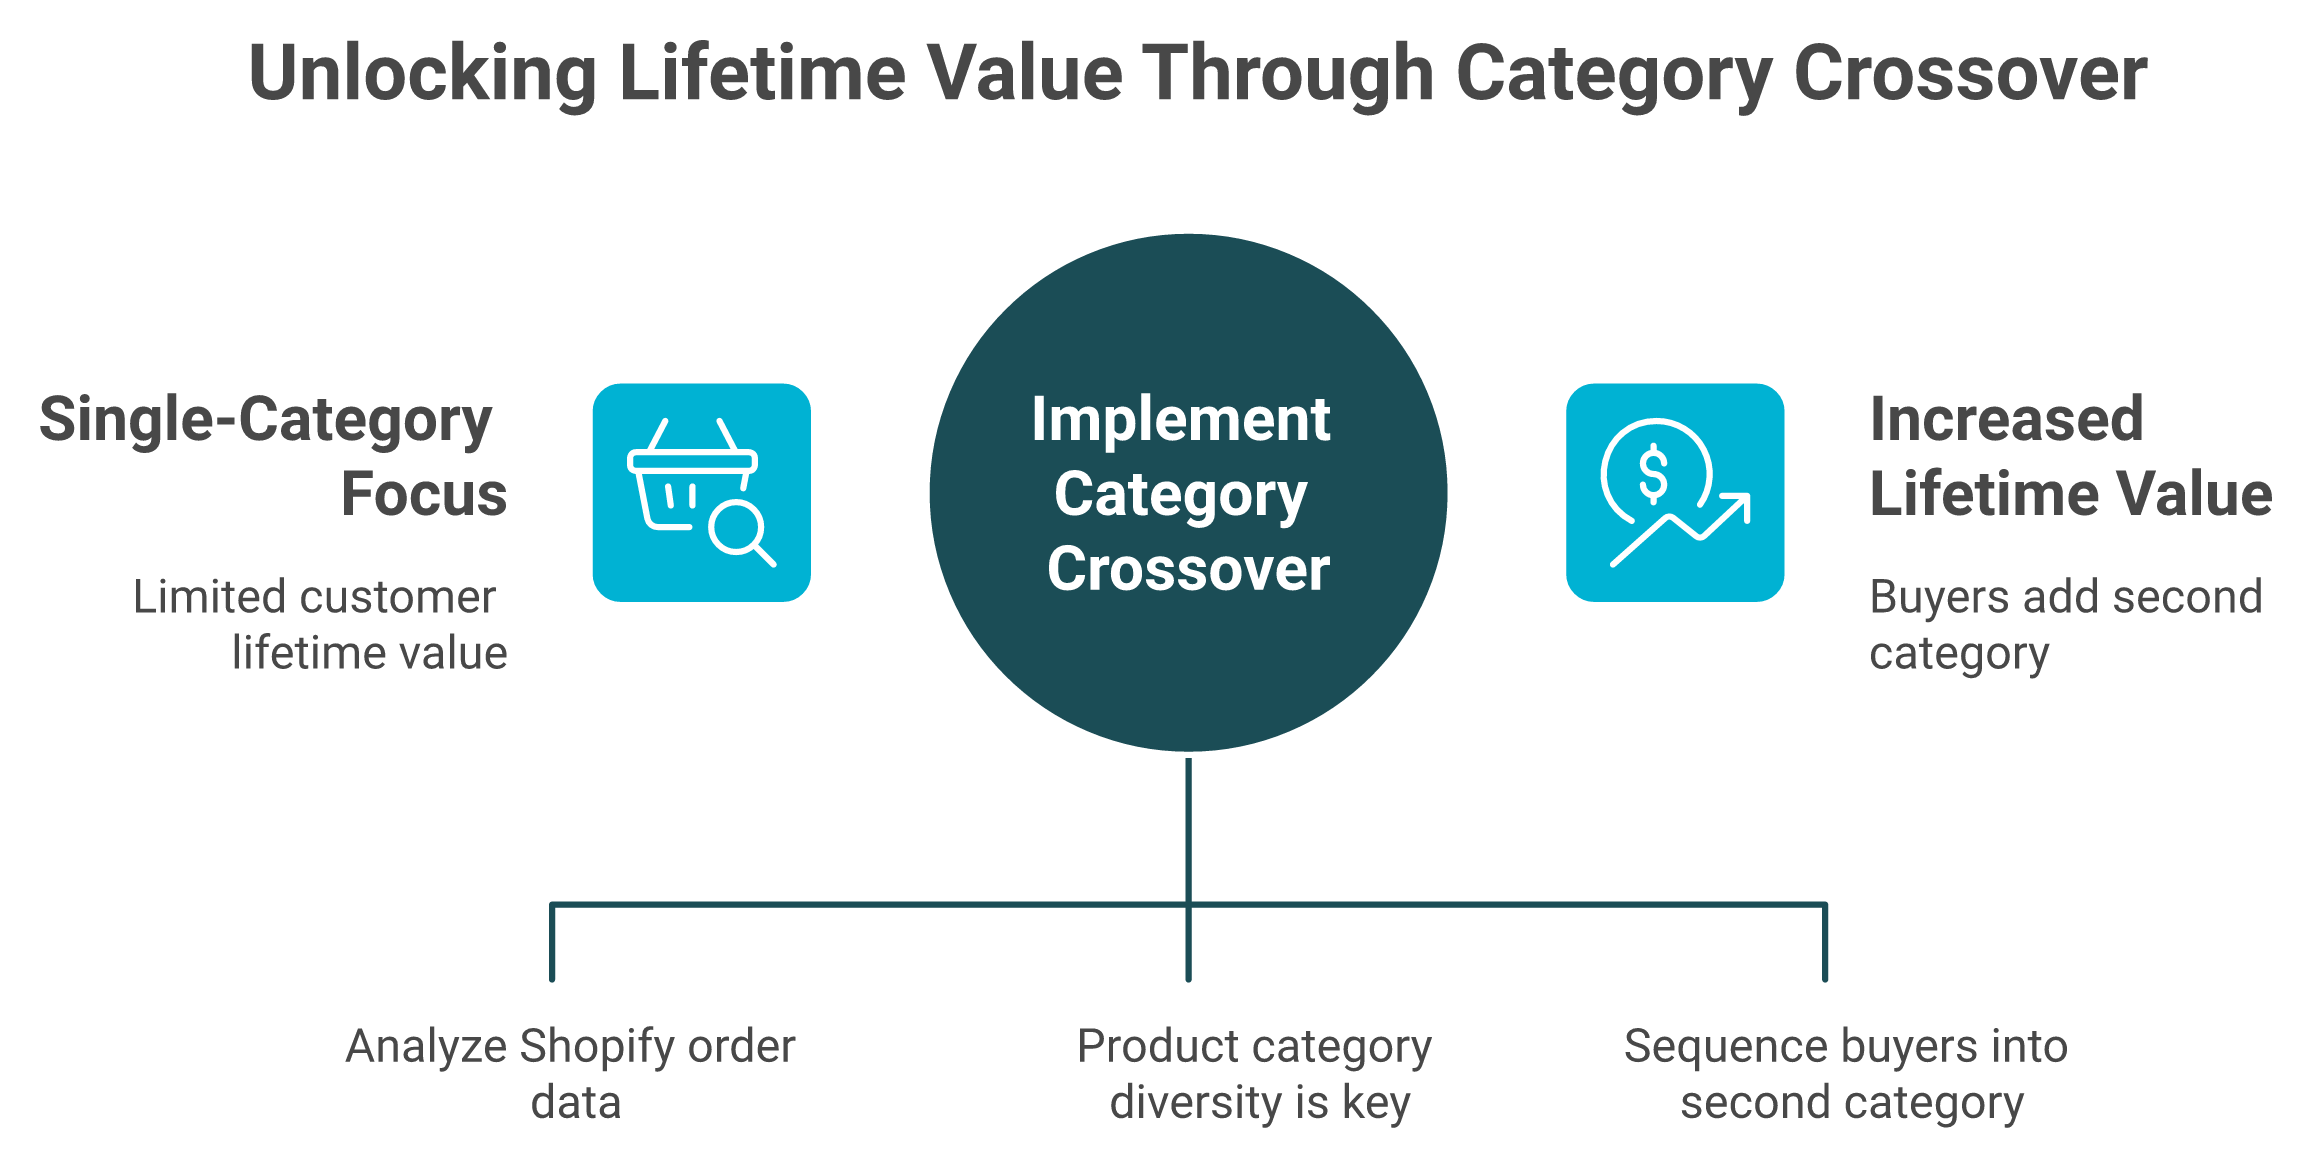
For multi-category DTC brands, often yes. Anthony Mink of Live Bearded ran cohort analysis on raw Shopify order data and found product category diversity, not frequency, was the leading driver of lifetime value. Body care buyers jumped roughly 50% to 100% in LTV, and adding apparel and accessories repeated the lift. Segment on number of categories owned, then sequence everything toward the second category.
⏰ Twelve months looking the wrong way
Mink's team spent a year on the front end. Better creative, better ads, landing page tests, conversion rate work. In his words, almost all of the focus had gone to the front end.
That is the default for most stores doing $1M to $10M. Acquisition is visible, measurable, and urgent. The back end is quiet, so it waits.
🔍 The turn: one query against raw order data
Then he ran cohort analysis directly against Shopify's database APIs. Cohort analysis means grouping customers by a shared trait, then tracking their spending over time.
The finding surprised him. He said he would never have thought product category diversity was the leading driver of lifetime value. He had assumed the answer was frequency, more product, more launches.
One cohort query reversed a year of assumptions: category diversity, not frequency, drove the lifetime value lift.
⭐ The after: sequencing rebuilt around one transition
Live Bearded rebuilt back-end marketing around a single operational goal. Move single-category buyers into a second category.
Not more emails. Not more discounts. One transition, treated as the primary retention objective. Luca AI runs the same class of analysis, cutting ecommerce customer lifetime value by category count across connected Shopify order data, which is how we see whether a store has a gateway category at all.
✅ How to replicate this in your store
This is three columns and an afternoon. No new tooling required.
Build a column counting distinct product categories per customer.
Cut average lifetime value by that count: one category, two, three or more.
Find which second category produces the largest jump. That is your gateway.
Point your post-purchase sequence at that one transition.
If the lift is small, you have learned something cheap and should go back to frequency work. Luca AI's read is that most multi-category stores have a gateway product they have never identified, though I will say honestly that single-category brands see much less here.
⚠️ The honest limit of this finding
One store is one store. Live Bearded sells grooming, body care, apparel, and accessories, so crossover was available to them.
If you sell one SKU in one category, this lever does not exist for you yet. Your version of the question is whether a second product line is worth launching, which is a different analysis.
Operators who have tried to answer questions like this inside dashboard tools report the same friction:
"Mobile limitations and the platform isn't a plug-and-play solution, it requires time and effort to learn its advanced features and capabilities. There are instances that certain intergrations are not yet fully functioning so you have to always check with Customer Support." — Charlene R., Head of Operations, HR and Culture, 5/5, Polar Analytics G2 Verified Review, Nov 2024
"They have not basic features in place like a line chart Year on Year comparison of revenue etc. I've also reported an issue with inventory levels, as our inventory is multiplied with 6, since we have 6 different shopify stores connected to the same warehouse." — Maja, 2/5, Polar Analytics TrustPilot Verified Review, Nov 2025
"Triple Whale is very user-friendly and easy to navigate to find the data you need across multiple channels." — Verified user, Marketing, 4/5, Triple Whale G2 Verified Review, Apr 2023
Luca AI exists for the question Mink had to write code to answer. Ask whether lifetime value changes by category count, and the intelligence layer pulls the slice, names the drivers, and can simulate moving a cohort across. That turns a one-time discovery into something you track monthly, the way an AI data analyst for ecommerce would.
Q8. How do you collect zero-party segmentation data without building a CDP? [toc=8. Zero-Party Quiz Stack]
Ask the customer directly with an onsite quiz. Doe Lashes found many buyers were new to false eyelashes, asked a single question (newbie or experienced), and used the answer to personalize product recommendations and post-purchase flows, which lifted revenue and satisfaction. You need three things: a CMS like Shopify, an email and SMS platform like Klaviyo, and a quiz layer such as Octane.ai.
🔍 What Doe Lashes actually did
The insight was not complicated. A large share of their buyers had never used the product category before. A newbie and an experienced user need different emails, different product picks, and different education.
So they asked. One question, answered before checkout, stored on the profile. The post-purchase flow then split on that single field.
✅ The three-tool stack
Zero-party data means information the customer hands you on purpose, not something you infer. That distinction matters, because inferred data decays and declared data does not.
CMS: Shopify, holding the storefront and the order record.
Email and SMS:Klaviyo, holding the profile property and the flows.
Quiz layer:Octane.ai, TryInteract, or similar, writing the answer to the profile.
That is the whole stack. No warehouse, no reverse ETL, no analyst. If you later outgrow it, that is when reverse ETL tools for ecommerce enter the conversation.
⚠️ Ask one question, not seven
Every extra field costs completion rate. Most of the extra fields never get used in a segment anyway.
My rule is that a quiz question earns its place only if a different email goes out based on the answer. If you cannot name that email, cut the question.
Operators on Reddit describe the same mechanic in plain terms:
"It is very easy to set it up as a product recommendation engine on your website and is a smart choice if you have a lot of products across collections. One of the best features is the ability to segment users into different email segments based on their answers. So the guy choosing the green widget can end up on the green widget email list vs the blue widget email list." — u/ecommerce-optimizer, r/shopify Reddit Thread, Feb 2023
"We've been attempting to get a handful of other data sources connected (ShipHero and Walmart at this moment) and the process has been long and drawn about because it can take up to a week to hear back from the Polar team." — Ben S., Director of Commercial Operations, 4/5, Polar Analytics G2 Verified Review, Sep 2025
"Shopify segmentation filters will help you only in the beginning. But when you get in more apps to manage reviews, customer support, quizzes, shipping etc. Managing customer segmentation needs to be more tighter and personalized depending on so many factors." — u/RetentionGuy, r/shopify Reddit Thread, Feb 2023
💰 Where the quiz stops being enough
Below roughly 10,000 customer records, a quiz plus RFM gets you most of the available value. Above that, catalog complexity grows faster than your ability to write rules for it.
That is the point where predictive analytics for ecommerce starts to earn its cost. Not before. I have watched stores buy a customer data platform at 3,000 records and spend a year configuring something a spreadsheet was already handling.
⏰ The ordering that actually works
Run the quiz first, because it is cheap and reversible. Let it run for 60 days and count how many segments you actually sent differently to.
If the answer is one, the quiz was still worth it. If the answer is zero, the problem is activation, not data collection.
Luca AI does not replace a quiz tool, and it is not the right fit for stores with thin order history or marketplace-only sales. Where Luca helps after collection is reading declared answers against actual purchase behavior, so you learn which quiz responses predicted revenue and which only felt useful. That is the practical test for ecommerce data collection.
Q9. Which metrics prove your segmentation actually worked? [toc=9. Proof Metrics]
Cut five metrics by segment, not in aggregate: repeat purchase rate, average order value, conversion rate, customer lifetime value, and revenue per recipient. Then add the one metric almost nobody tracks, segment migration rate, meaning how many customers moved up or down a tier this month. Aggregate revenue can rise while every segment degrades underneath it. Luca AI delivers these cuts as scheduled reports with the contributing metrics named, so the measurement is standing rather than rebuilt monthly.
📊 The five cuts that matter
Five Segment-Level Metrics and What Each One Tells You
Metric
How to cut it
What good looks like
What it tells you to do
Repeat purchase rate
By first product purchased
Rising in your gateway category
Push that product to new buyers
Average order value
By segment tier
Highest in VIP, lowest in one-time
Bundle for the low tier
Conversion rate
By segment and channel
Flows above campaigns
Move budget into triggered sends
Customer lifetime value
By cohort and category count
Climbing with each category added
Sequence toward the second category
Revenue per recipient
By send, per segment
Targeted beats broadcast
Shrink the audience, not the offer
Luca AI measures each of these by reading order, ad, and email data as one set, which is the only way revenue per recipient and contribution land in the same view. MoEngage's segment KPI guidance covers the same five cuts, and treating them as standing top ecommerce KPIs is what keeps them honest.
⏰ Migration rate, the number nobody reports
Levels tell you where customers are. Migration tells you whether they are moving. Count how many customers crossed a tier boundary this month, in both directions.
The theory behind this is older than most dashboards. Peter Fader's work showed that a customer with low baseline visit frequency and rising activity converts better than a high-baseline customer whose frequency is falling. Direction beats level.
⚠️ Why aggregate revenue lies
Here is the failure I see most. Total revenue climbs for two quarters because acquisition is working. Meanwhile, Champions shrink, At Risk swells, and nobody notices until Q1 goes flat.
Segment-level reporting catches that in month one. Luca AI's read is that migration is the single most underused retention metric in DTC, though I will admit it takes two months of data before the number means anything. It belongs in the same review as your customer churn analysis.
💰 The benchmark to check yourself against
Returning customer revenue share is the fastest health read available. Healthy D2C brands sit between 35% and 55% over the trailing 18 months.
Below 25% suggests a leaky bucket, where acquisition keeps refilling a store nobody returns to. Above 70% often means acquisition has stalled. Luca AI tags orders as new or returning at the order level, so this mix reports alongside absolute revenue instead of behind it.
Operators report the same friction when they try to build these cuts inside conventional tools:
"The downside of GA is its learning curve, especially with GA4. The interface and reporting structure are not very intuitive at first, and finding specific metrics or building custom reports can take time." — Aman S., Performance Marketing Head, 2/5, Google Analytics G2 Verified Review, Dec 2025
"Too much push for AI. Inconsistent data delivery based on the settings selected. Lack of reporting / status information for data extractions." — Verified user, Marketing, 4/5, Improvado G2 Verified Review, Feb 2025
"No connectivity to our subscription partner yet." — Brett G., Small-Business Operator, 5/5, Polar Analytics G2 Verified Review, Apr 2023
Luca AI turns this reporting into a standing job. Ask for a weekly segment report with migration counts, LTV by tier, and the reasoning behind any swing, and it arrives in Slack or email on schedule through automated data reporting in ecommerce. The intelligence layer also flags tiers already performing well, so your attention goes to the ones that need it.
Q10. Why do your best-looking segments hide unprofitable customers? [toc=10. Margin Blind Spots]
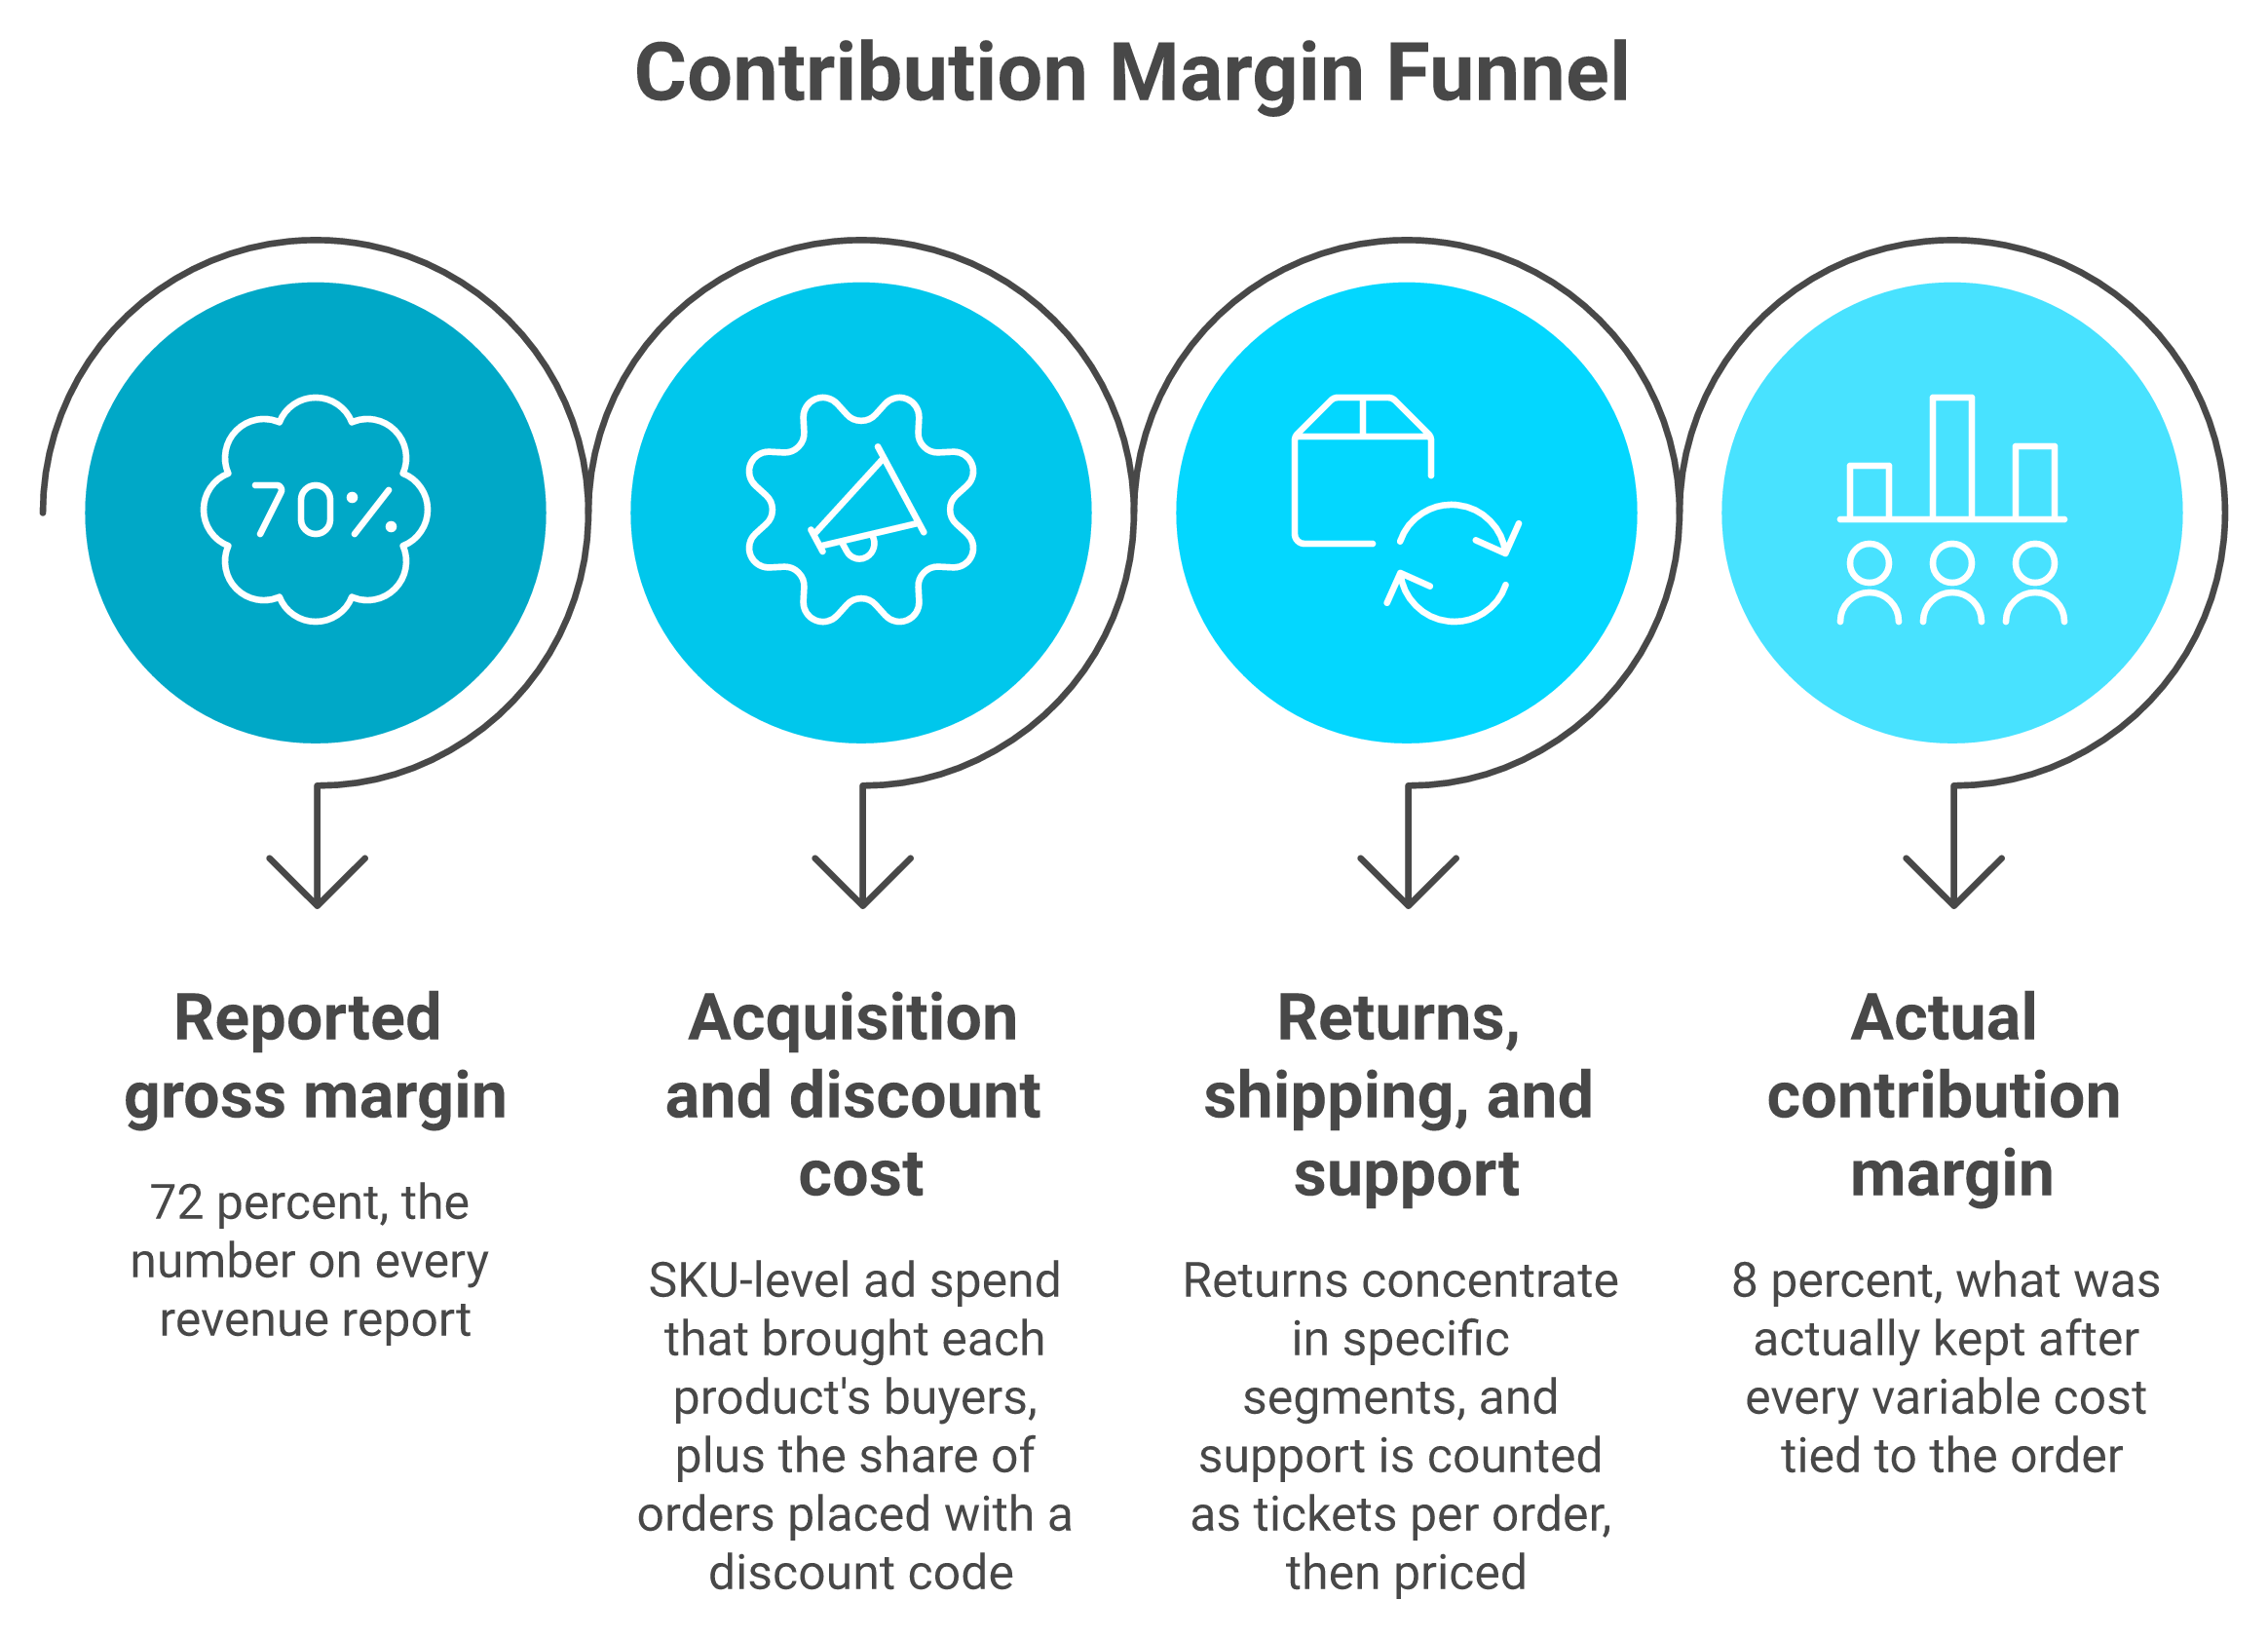
Because RFM scores revenue, not contribution margin. Contribution margin means what is left after every variable cost tied to that order. A discount-acquired customer can sit in your Champions tier and lose money once you count SKU-level ad spend, returns, shipping, and support. One operator found a product showing 72% gross margin was running at 8% actual contribution margin after costing it line by line. Luca AI reads order, ad, and accounting data together so margin can be cut by segment.
💸 Two years scaling a break-even product
The detail that stays with me is the timeline. She had spent two years scaling that product. It looked like her best performer on every revenue report she had.
And the costs were already in her systems. As the operator who told the story put it, the data was sitting right there the whole time. She just did not know how to see it. The distinction between the two numbers is covered in contribution margin vs gross margin.
RFM has three inputs and none of them is a cost, which is how a Champion segment can lose money on every order.
❌ What RFM structurally cannot see
RFM has three inputs. None of them is a cost. That is not a flaw in the model; it is a boundary of it.
So your Champions tier ranks by what customers paid you, not by what you kept. Luca AI's data points one way here, and I may be reading it too strongly, but in our audits the top revenue segment is rarely the top contribution segment.
✅ The four columns to add
SKU-level acquisition cost. Which ad spend brought which product's buyers?
Return rate by segment. Returns concentrate; they do not spread evenly.
Support cost per segment. Count tickets per order, then price them.
Discount dependence. Share of orders placed with a code.
Luca AI unifies Shopify, Meta, Google, Klaviyo, accounting, 3PL, and support data, which is what makes a contribution cut by customer group possible at all. That is the foundation of any real customer profitability analysis.
⚠️ Discount cohorts decay faster
The discount cohort problem is worth isolating. A cohort acquired on a heavy promotion looks fine in month one and separates fast afterward.
In published D2C cohort work, a discount-acquired cohort returned roughly $95 per customer by month two, against roughly $210 for a full-price cohort. Same channel, same period, very different economics.
💰 The reframe
Rank segments by contribution, not revenue. Then re-read your VIP list. Some of those names will move, and one or two may need a different offer rather than a perk.
Luca AI traces a margin gap to the SKU and channel driving it, which is the difference between knowing a segment is weak and knowing why. I would rather lose a Champion than keep subsidizing one. The same logic applies when you compare declining platform ROAS vs true profitability.
Operators evaluating conventional tools for this work describe the same wall:
"Sampling, sampling, sampling. For a data and algorithm based company, Google does a terrible, terrible job of estimating reality out of the sampling they do. When we switched to an enterprise web analytics solution that does no sampling, we found that Google Analytics was telling us we had twice as much traffic as we actually do." — Gitai B., Marketing, Web Analytics, and Testing Lead, 1/5, Google Analytics G2 Verified Review, Nov 2016
"Some data we still notice discrepancies between platforms, for example, tracking ads, and differences in the reported metrics like revenue." — Verified user, Marketing, 4/5, Triple Whale G2 Verified Review, Apr 2023
Luca AI makes margin-aware segmentation workable because the data meets in one place. Shopify knows the order, Meta knows the spend, and your accounting tool knows the cost. None of them will tell you which customer group is profitable on its own. Luca reads across them and names the drivers.
Q11. What do you actually need to run this: a spreadsheet, Klaviyo, a CDP, or an AI layer? [toc=11. Tooling by Stage]
Four options, each correct at a different stage. Luca AI fits operators who want to ask segmentation questions in plain English across unified store data and get the reasoning, not just the chart. Klaviyo's native RFM fits if you clear its thresholds and only need email activation. A spreadsheet fits under a few thousand customers. A customer data platform, meaning a system that merges identity across sources, fits when you have a data team and millions of records.
📊 The four options side by side
Segmentation Tooling Options Compared by Stage
Option
What it answers
What it cannot do
Record fit
Real cost
Luca AI
Why a segment moved, what drives LTV, what to do next
Multi-touch ad attribution, writing to your live systems
Luke Bean at Valente moved from Klaviyo to Bloomreach to get a single point of truth around the customer. He described it as significantly expensive and difficult.
That is the cost of choosing wrong. Luca AI connects sources natively and normalizes on ingestion, so the single-source-of-truth goal does not start with a replatform. If you are mid-evaluation, the trade-offs are laid out in our guide to ecommerce analytics platforms.
❌ Where each option breaks
Luca AI is not for enterprises with an existing data team, marketplace-only sellers, or stores with too little order history to reason against.
Klaviyo native RFM stops at email and cannot see cost.
Spreadsheets go stale the day you build them.
CDPs below roughly 10,000 records are a configuration project pretending to be a solution.
✅ The decision rule
Match the tool to your record count, not your ambition. Under 2,000 customers, use a sheet. Between 2,000 and 10,000, use Klaviyo native plus one analytics layer.
Above that, the question changes from storing data to reasoning across it. Luca AI is built for that second question, which is why it leads this list rather than sitting in the middle of it, and why we treat it as customer segmentation in ecommerce rather than reporting.
Reviews across the data-pipeline category are worth reading before you commit:
"Nothing. This tool is full of promises, but you are met with unstable connectors, unresponsive/incompetent customer service, and obscene limitations for any scalable business." — Verified user, Marketing, 0.5/5, Supermetrics G2 Verified Review, Nov 2021
"There is a steep learning curve, and if you aren't familiar with databases, Excel, and data transformations, this could be a really tough software to implement. I'm having this issue myself, where I am currently the only person who knows how to use Improvado within my team." — Verified user, Marketing, 3.5/5, Improvado G2 Verified Review, Dec 2021
That second review is the whole argument for plain-English querying. One person who knows the tool is a single point of failure. That is the gap conversational analytics tools are meant to close.
Luca AI sits as an AI layer over the warehouse rather than a dashboard with AI attached. It extracts the slice for a specific question, predicts from historical patterns, simulates alternatives, and names root causes. It is not an attribution tool and does not replace one.
Q12. How often should you re-segment, and why do two tools label the same customer differently? [toc=12. Freshness and Drift]
Recency changes daily, so any segment built on a quarterly export is wrong before you act on it. Refresh monthly at minimum, with a weekly migration check. Expect labels to disagree across tools. Shopify uses five-point scores across eleven predefined groups, while Klaviyo uses percentile scores of 1 to 3 per dimension, so the same customer can read Loyal in one system and Active in the other. Luca AI monitors migration continuously against a store's own historical pattern.
⏰ Your segmentation is not wrong, it is late
This is the frame I would leave you with. Most segmentation failures are not modeling failures. They are timing failures.
A sheet scored on Monday has drifted by Thursday. Win-back emails fire at customers who already came back. VIP perks land with people who churned six weeks ago.
🔍 Direction beats level
Fader's work makes the point precisely. A customer with above-average baseline visit frequency that is falling is less likely to convert. A customer with low baseline frequency that is rising is more likely to convert.
Static exports destroy that signal, because they capture state and not movement. Luca AI studies performance across months and years, then flags when a group breaks its own pattern, which is the behavior we expect from ecommerce monitoring tools.
⚠️ Why two tools disagree about one customer
This catches teams off guard. The same buyer can appear in two systems with two different labels, and neither system is broken.
Shopify scores recency, frequency, and monetary value from 1 to 5, then maps combinations to eleven named groups, as documented in this side-by-side comparison.
Klaviyo assigns percentile scores of 1 to 3 per dimension, with its own eligibility gates.
Klaviyo refreshes RFM profile properties nightly, while its dashboard updates sooner.
Pick one system of record and write the definition down. Luca AI holds one consistent definition across connected sources, which removes the reconciliation step entirely.
✅ The cadence that works
Weekly: check migration counts in both directions.
Monthly: rescore, and re-confirm your recency threshold against the median repurchase gap.
Quarterly: re-test which variable predicts LTV best, because gateway products shift.
If that sounds like a lot, it is about twenty minutes a week once the definitions are set. Luca AI runs the weekly check as a scheduled report, so the twenty minutes goes to deciding rather than to building.
💸 What breaks when you skip it
Three things, in order of cost. Win-back timing goes wrong, which wastes your best incentive. VIP perks go to churned buyers, which wastes margin.
Then suppression lists go stale, and deliverability drops for every segment at once. That last one is the expensive failure, because it damages the sends that were working.
Luca AI replaces the refresh ritual with continuous monitoring and one definition. Instead of remembering to rescore on the first Monday of the month, the intelligence layer watches migration and tells you when a group moves, with the reasoning and a recommended next step attached. That is what we mean by agentic BI.
The knitwear founder I mentioned at the top ran the four-column cut in an afternoon. Her gateway product turned out to be a $38 wool scarf, not the $220 sweater she had been pushing. That is the whole value of this work. Not a prettier chart, one changed decision.
FAQ's
What is segmentation analysis and how is it different from just building an email list?
Segmentation analysis is the process of splitting a market or customer base into groups that behave differently, then analyzing each group to decide what to do differently for it. An email list treats every buyer as identical. A segment treats them as different economic units with different next actions.
The practical test we apply is whether the output changes one of three decisions:
Who you stop emailing. Suppression protects deliverability for the segments that do convert.
Which cohort you pay to acquire. If one entry product produces buyers worth twice as much, your ad budget should know.
Which product you push second. The second purchase is where lifetime value is decided.
If none of those three change, you labeled customers rather than analyzing them. Luca AI sits as an AI layer over connected store data, including Shopify, Klaviyo, Meta, and accounting sources, and normalizes everything on ingestion so the analysis runs without a cleanup project first. In our deployments, the first question operators ask is some version of which customers are worth more and why. That is the same question with money attached, and it is where any serious ecommerce customer analytics program should start.
Should I run market segmentation or customer segmentation first?
If you already have revenue flowing and 500 or more purchasers, run customer segmentation first. The data is already yours, the cost is zero, and the actions reverse inside a week.
The two jobs are genuinely different:
Market segmentation divides the whole addressable market, including people who have never bought from you, and answers where you should compete.
Customer segmentation divides your existing database using transaction and behavioral data, and answers what to send, cross-sell, or suppress.
Market work is slower and far less reversible. A full positioning exercise runs through competitive alternatives, unique attributes, value and proof, target market characteristics, and market category. That is a quarter of work, and it should be, because the output reshapes the brand.
Customer segmentation is a Tuesday afternoon. You build the group, send to it, and read the result in ten days.
The exception is a genuine new category or new geography, where your existing customers cannot tell you about a market they are not in. Luca AI reads across Shopify, Meta, Google, Klaviyo, and accounting data in one place, so market-level and customer-level questions run against the same numbers. That is the point of real ecommerce data integration: the two analyses stop disagreeing with each other.
How do I build RFM segments from my own Shopify data?
Export order history, score each customer 1 to 5 on recency, frequency, and monetary value using quintiles, map the combinations to named segments, and attach exactly one action and one exclusion to each.
The walkthrough is six steps:
Export Customers from Shopify with order count, total spent, and last order date.
Sort by days since last order, split into five equal groups, and score the top fifth as 5.
Repeat for order count, then total spent.
Concatenate into one code, for example 5-5-5.
Map codes to segments such as Champions, At Risk, and Cannot Lose Them.
Attach one action and one exclusion per segment.
Two thresholds to start from: under four months since last order counts as recent in most categories, and three purchases a year marks a frequent buyer. Use the median gap between orders, never the mean, because subscription buyers drag the average and push win-back timing weeks late.
Check your distribution before acting. Champions should land near 8 to 12 percent of customers carrying 45 to 60 percent of revenue. A flat spread means your scoring window is wrong, not your customers. Luca AI removes the export step entirely, so you can ask which customers left Champions this week using conversational analytics for ecommerce and get the slice plus the cause.
Why do my best revenue segments sometimes lose money?
Because RFM scores revenue, not contribution margin. Contribution margin is what remains after every variable cost tied to that order. RFM has three inputs and none of them is a cost, so your Champions tier ranks customers by what they paid you rather than by what you kept.
A discount-acquired customer can sit at the top of that tier and lose money on every order once you count SKU-level ad spend, returns, shipping, and support. One operator discovered a product showing 72 percent gross margin was running at 8 percent actual contribution margin after costing it line by line, two years into scaling it. The costs were already in her systems. Nothing was surfacing them.
Four columns fix most of this:
SKU-level acquisition cost, so you know which spend brought which buyers.
Return rate by segment, because returns concentrate rather than spread evenly.
Support cost per segment, counted as tickets per order and then priced.
Discount dependence, measured as share of orders placed with a code.
Luca AI unifies Shopify, Meta, Google, Klaviyo, accounting, 3PL, and support data, which is what makes a contribution cut by customer group possible at all. Rank segments by contribution instead of revenue, and treat it as customer profitability analysis rather than reporting.
How often should I re-segment, and why do two tools label the same customer differently?
Refresh monthly at minimum, with a weekly migration check. Recency changes every day, so a segment built on a quarterly export is wrong before you act on it. Most segmentation failures are not modeling failures, they are timing failures. A sheet scored on Monday misroutes win-back emails by Thursday.
Label disagreement across tools is normal, not a bug:
Shopify scores recency, frequency, and monetary value from 1 to 5, then maps combinations to eleven predefined groups.
Klaviyo assigns percentile scores of 1 to 3 per dimension, with its own eligibility gates, and refreshes profile properties nightly.
The same buyer can therefore read Loyal in one system and Active in the other.
Pick one system of record and write the definition down. Then watch direction, not just level. A customer with low baseline visit frequency that is rising converts better than a high-baseline customer whose frequency is falling, and static exports destroy that signal.
Three things break when cadence slips: win-back timing, VIP perks sent to churned buyers, and stale suppression lists that drag deliverability for every segment at once. Luca AI studies performance across months and years, then flags when a group breaks its own pattern, which is the behavior we expect from real ecommerce monitoring tools.
Enjoyed the read? Join our team for a quick 15-minute chat — no pitch, just a real conversation on how we’re rethinking Ecommerce with AI - Luca
Loading Schedule...
Your AI Co-Founder is here.
Here’s why:
Shopify, Meta, Xero - one brain.
"Should I scale?" Answered with real data.
Growth capital. No applications. One click.
Thank you! Your submission has been received! Please book a time slot for the Meeting
Oops! Something went wrong while submitting the form.