.svg)
.svg)

Q1: What Are the 12 Best Customer Behavior Analytics Platforms for E-commerce in 2026? [toc=1. 12 Best Platforms]
The 12 best customer behavior analytics platforms for e-commerce in 2026 are Luca AI, Contentsquare, Mixpanel, Amplitude, Fullstory, Hotjar, Heap, Glassbox, Smartlook, Mouseflow, Pendo, and Crazy Egg. Each is scored on four behavioral axes, segmentation, heatmaps, journey mapping, and real-time signals, plus pricing, usability, and verified reviews. The table below lets a scaling DTC operator self-select in under a minute, then I break down all twelve in plain detail.
Here is the simple list, each linked to its home page, with a one-line "best for" call.
- Luca AI (ask-luca.com), Best for AI-native cross-functional behavior intelligence
- Contentsquare, Best for enterprise journey and zone-based analytics
- Mixpanel, Best for event-based funnel and retention analysis
- Amplitude, Best for deep product behavior cohorts
- Fullstory, Best for session replay with autocapture
- Hotjar, Best for affordable heatmaps and feedback
- Heap, Best for autocapture without manual tagging
- Glassbox, Best for enterprise struggle-detection and compliance
- Smartlook, Best for mobile app and web replay
- Mouseflow, Best for friction scoring on a budget
- Pendo, Best for in-product guides plus analytics
- Crazy Egg, Best for simple heatmaps and A/B tests.
📊 The 4-Axis Comparison Table
Now let me walk through each platform in detail. I will start with the first six, then continue with the rest.
1.1 Luca AI
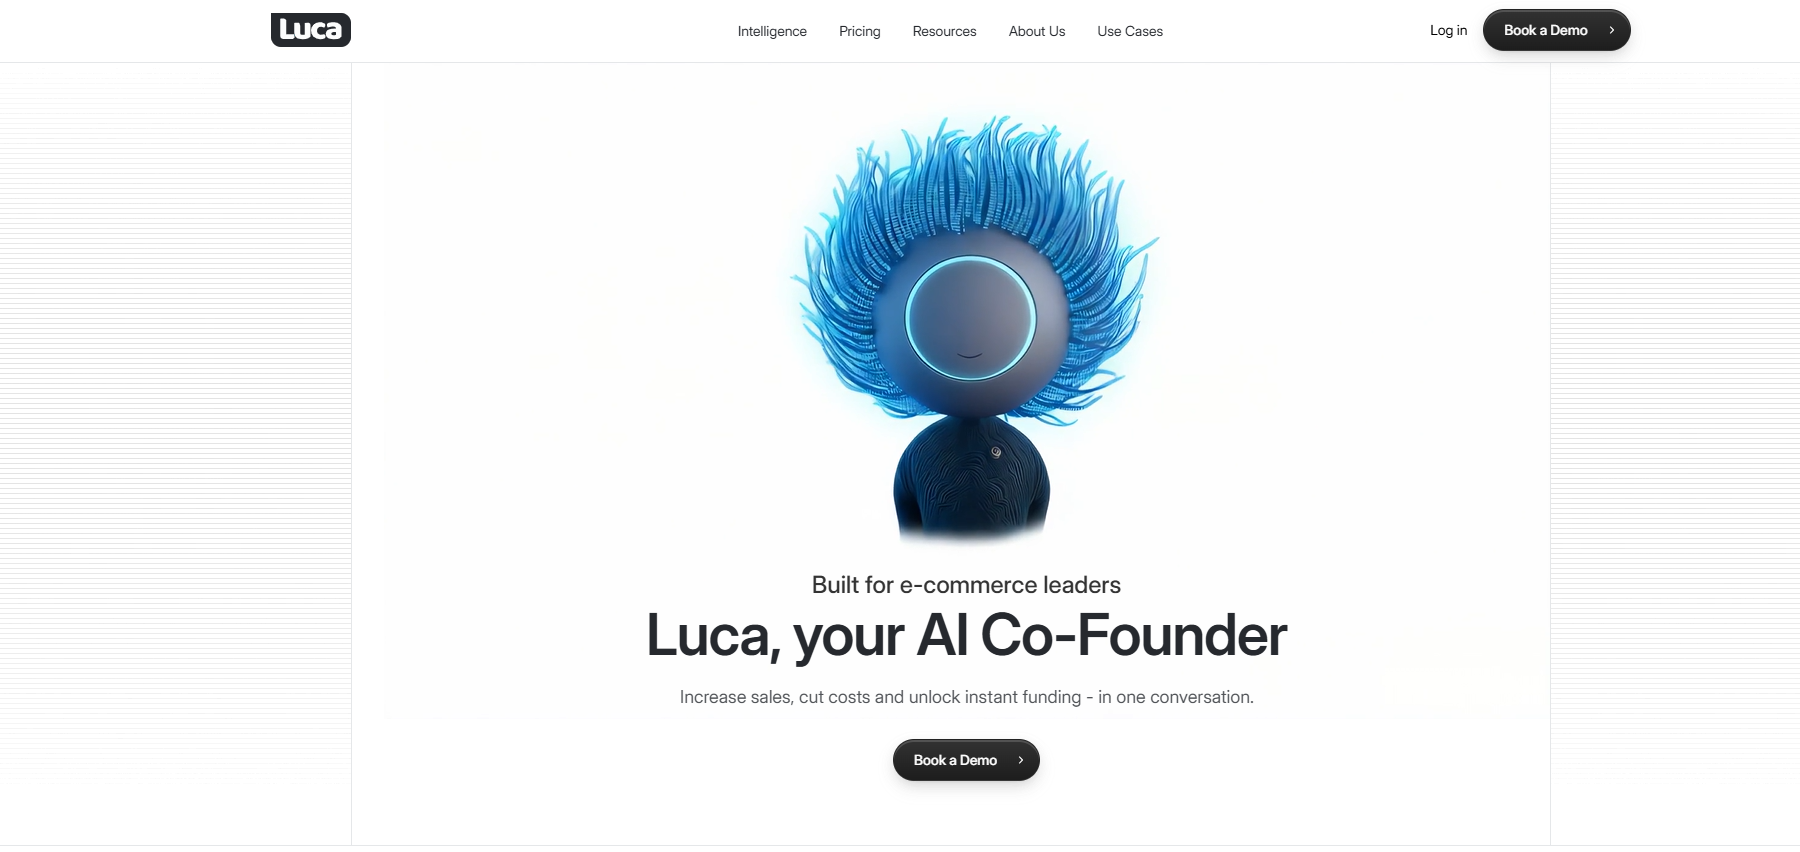
Luca AI is an AI layer that sits on top of your e-commerce data warehouse and turns scattered behavioral data into plain-English answers, predictions, and alerts. You connect Shopify, Meta, Google, and the rest, then ask questions like a colleague. It reads behavior across the whole funnel, finds the root cause of an outlier, and pings you the moment something breaks.
❤️ Why Did We Choose This Tool?
I am Eric Bidinger, and I put Luca first because of what it does, not because I helped build it. Most analytics tools added AI as a feature. Luca is AI at the core, a reasoning engine, not another dashboard you babysit. It reasons across marketing, finance, and operations in one chat, normalizes data on ingestion, and proactively scans for risks and opportunities. For a founder drowning in disjointed logs, that "second brain" is the difference between watching charts and acting on them.
✅ Core Behavioral Capabilities
- Segmentation: Builds behavioral and RFM cohorts conversationally, no SQL required.
- Heatmaps and journey context: Pulls the relevant behavioral slice for any situation you ask about.
- Real-time signals: Scans data 24/7 and alerts on Slack, email, or app when ROAS dips or CAC spikes.
- Root-cause reasoning: Finds the influencing metrics behind an outlier, not just the outlier itself.
- Scheduled reports: Pushes weekly or monthly reports with graphs, reasoning, and recommendations.
😊 Best For
Scaling DTC and mid-market brands that want cross-functional behavior intelligence without hiring a data analyst.
📈 Case Study
What was the problem? A 7-figure DTC supplements brand was scaling revenue but could not see which behaviors drove repeat purchases. Their data sat in disconnected exports, and weekly reporting ate two full days.
How Luca helped? They connected Shopify, Meta, and Google to Luca, then asked plain-English questions about cohort behavior. Luca surfaced that buyers who tried a second product category jumped sharply in lifetime value, a pattern hidden in the spreadsheets.
What was the outcome? The team rebuilt onboarding flows around that cross-category behavior. 💰 Repeat-purchase rate climbed, reporting time dropped from two days to minutes, and outlier alerts replaced manual dashboard checks.
💰 Pricing
Starter, €299 / Month | Growth, €499 / Month | Scale, Custom Pricing
1.2 Contentsquare
Contentsquare is an enterprise-grade digital experience platform built around zone-based heatmaps and full journey analysis. It maps where attention and revenue concentrate on every page, then ties friction to lost conversions. For large catalogs, it is one of the deepest journey tools available.
✅ Why Did We Choose This Tool?
- Zone-based heatmaps: Shows revenue and engagement per page element, not just clicks.
- Journey analysis: Stitches multi-session paths across the whole site.
- Frustration scoring: Flags rage clicks and erratic behavior automatically.
- Session replay: Replays real sessions tied to journey data.
- Enterprise integrations: Connects to large martech and analytics stacks.
😊 Best For
Enterprise and upper-mid-market retailers needing deep journey and zoning analytics.
📊 Reviews
"Contentsquare gives us incredibly granular insight into how users interact with each zone of our pages, which we never got from standard analytics."
— Verified User in Retail, Contentsquare G2 Verified Review
"The platform is powerful but the learning curve is steep, and pricing sits firmly in the enterprise range, so smaller teams may struggle to justify it."
— Verified User, Contentsquare G2 Verified Review
1.3 Mixpanel
Mixpanel is an event-based product analytics platform that excels at funnels, retention, and cohort segmentation. It is a favorite of growth and product teams because you can build a funnel in minutes and see exactly where users drop off. On G2 it holds a strong 4.5-star rating across roughly 1,289 verified reviews.
✅ Why Did We Choose This Tool?
- Funnel analysis: Build and compare conversion funnels fast.
- Retention and cohorts: Segment by plan, platform, geo, and release.
- Flow analysis: Maps real user journeys and drop-off points.
- Alerts: Keeps stakeholders aligned on key metric shifts.
- Easy dashboards: Readable for non-technical and exec audiences.
😊 Best For
Product and growth teams that want event-level funnel and retention insight without a data team. For founders comparing options, our guide to e-commerce analytics platforms adds useful context.
📊 Reviews
"The funnel analysis features make it simple to uncover user behavior patterns, and the dashboards are customizable enough to fit both quick checks and deep dives."
— Verified User, Mixpanel G2 Verified Review
"Mixpanel completes the picture where our BI tools fall short, notably helping us understand our users much better, including their path to churn."
— Verified User, Mixpanel G2 Verified Review
1.4 Amplitude
Amplitude is a deep behavioral analytics platform known for cohort analysis, journeys, and predictive features. It is built for data-oriented product people who want to slice behavior many ways. It carries a 4.5-star rating from roughly 3,749 verified G2 reviews.
✅ Why Did We Choose This Tool?
- Behavioral cohorts: Deep, flexible cohort building for product teams.
- Journeys and paths: Visualizes how users move through the product.
- Predictive analytics: Surfaces likely behaviors before you ask.
- AI guidance: Helps orient new users through a complex interface.
- Experimentation: Ties behavior to A/B test outcomes.
😊 Best For
Data-mature product teams wanting granular behavioral cohorts and prediction. Teams focused on launches can pair it with our product management workflows.
📊 Reviews
"It often answers my needs before I even realize them, and it genuinely feels like it was built for data-oriented product people."
— Verified User, Amplitude G2 Verified Review
"Sometimes it feels overly complicated. I also used to dislike the deep root analysis because it took ages and then bombarded me with charts."
— Verified User, Amplitude G2 Verified Review
1.5 Fullstory
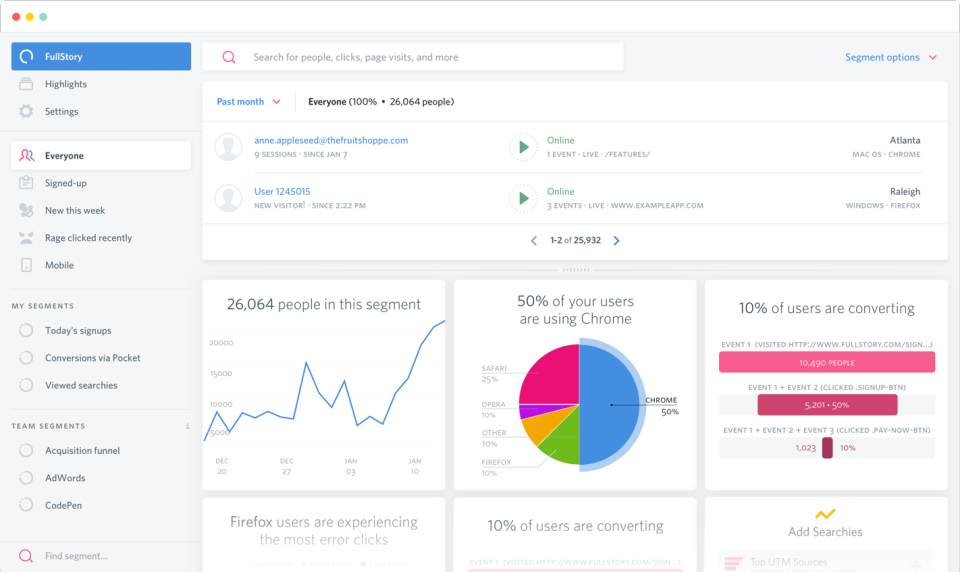
Fullstory is a digital experience platform built on autocapture session replay. It records everything by default, so you can replay sessions and spot friction without pre-tagging events. Pricing is quote-based and lands in the enterprise range, often $80,000 to $200,000+ annually for high session volumes.
✅ Why Did We Choose This Tool?
- Autocapture replay: Captures sessions without manual event setup.
- Heatmaps: Visualizes clicks, scrolls, and attention.
- Frustration signals: Detects rage clicks and dead clicks.
- Behavioral search: Find sessions matching specific behaviors.
- Churn signal detection: Surfaces friction that precedes churn.
😊 Best For
Mid-market and enterprise teams wanting rich session replay with minimal tagging.
📊 Reviews
"Fullstory's autocapture means we don't have to decide in advance what to track. We can go back and answer questions we didn't know we had."
— Verified User, Fullstory G2 Verified Review
"It is genuinely powerful, but the pricing is opaque and negotiable, and overage fees can add 20 to 40% to annual spend if you underestimate sessions."
— Verified User, Fullstory G2 Verified Review
1.6 Hotjar
Hotjar is the go-to affordable behavior tool for heatmaps, session recordings, and on-site feedback. It is light to install and easy to read, which makes it popular with smaller DTC stores. A free tier plus low entry pricing keeps it accessible.
✅ Why Did We Choose This Tool?
- Heatmaps: Click, move, and scroll maps out of the box.
- Recordings: Watch real sessions to spot friction.
- Surveys and feedback: Capture voice-of-customer on the page.
- Funnels: See where visitors drop in key flows.
- Ease of setup: Minimal technical lift to start.
😊 Best For
Small to mid-size DTC stores wanting affordable heatmaps and qualitative feedback. For deeper measurement, see our breakdown of e-commerce website analytics.
📊 Reviews
"Hotjar is brilliant for quickly seeing where people get stuck on a page. The heatmaps and recordings are easy for the whole team to understand."
— Verified User, Hotjar G2 Verified Review
"It is great for qualitative insight, but it is not built for deep quantitative segmentation, so we still need another tool for funnels and cohorts."
— Verified User, Hotjar G2 Verified Review
1.7 Heap
Heap is an autocapture analytics platform, now part of Contentsquare, that records every user action without manual tagging. You define events retroactively, so you can answer questions you did not plan for. On G2, roughly 95% of reviewers rate Heap around 4.3 out of 5 stars.
✅ Why Did We Choose This Tool?
- Autocapture: Tracks every click and pageview without code changes.
- Retroactive events: Define funnels after data is already collected.
- Journeys: Maps how users actually move through the site.
- Segmentation: Slice behavior by cohort and property.
- Contentsquare tie-in: Pairs quantitative data with replay.
😊 Best For
Teams that want tag-free autocapture and flexible, retroactive analysis.
📊 Reviews
"Heap saves a ton of time because we don't have to instrument every event up front. It just captures everything and we query later."
— Verified User, Heap G2 Verified Review
"It does everything well, but the volume of captured data can get overwhelming, and the pricing moves quickly once you scale event counts."
— Verified User, Heap G2 Verified Review
1.8 Glassbox
Glassbox is an enterprise digital experience platform built around struggle detection and compliant session capture. It is heavily used in regulated sectors because it records sessions while supporting privacy controls. For e-commerce, it shines at flagging where users fight the checkout.
✅ Why Did We Choose This Tool?
- Struggle detection: Auto-flags rage clicks, errors, and dead ends.
- Session replay: Full replay of real customer sessions.
- Journey analytics: Tracks paths across sessions and channels.
- Compliance controls: Built for privacy-sensitive industries.
- Frustration scoring: Quantifies where friction costs revenue.
😊 Best For
Enterprise retailers needing struggle analytics with strong compliance controls. Brands weighing data governance can review our privacy policy for how clean data handling should work.
📊 Reviews
"Glassbox surfaces exactly where customers struggle in our checkout, and the compliance features mean our legal team is comfortable with the recordings."
— Verified User, Glassbox G2 Verified Review
"It is powerful enterprise software, but it is heavy to deploy and the cost is hard to justify for a smaller store."
— Verified User, Glassbox G2 Verified Review
1.9 Smartlook
Smartlook is a session replay and heatmap tool that covers both web and mobile apps, which sets it apart from web-only rivals. Its mobile recording is a genuine strength for app-led brands. It holds a 4.4 out of 5 G2 score across roughly 200 reviews, with a free tier and paid plans from about $55 per month.
✅ Why Did We Choose This Tool?
- Web and mobile replay: Records sessions across both surfaces.
- Heatmaps: Click, scroll, and movement maps.
- Events and funnels: Track custom actions and drop-off.
- Crash reports: Catches mobile app failures.
- Segmentation: User segmentation on paid tiers.
😊 Best For
Brands with a mobile app that need web and app behavior in one tool.
💰 Pricing
Free ($0), Business ~$199 / Month, with Enterprise custom.
📊 Reviews
"The mobile app recording is the real reason we picked Smartlook. We finally see what happens inside our app, not just the website."
— Verified User, Smartlook G2 Verified Review
"It does the job for replays and heatmaps, but the deeper analytics features feel less mature than dedicated product analytics tools."
— Verified User, Smartlook G2 Verified Review
1.10 Mouseflow
Mouseflow is a budget-friendly behavior analytics tool best known for its friction score, which ranks pages by how much users struggle. It bundles heatmaps, recordings, and funnels at an accessible price. That makes it a practical pick for smaller DTC teams.
✅ Why Did We Choose This Tool?
- Friction score: Ranks pages by struggle automatically.
- Heatmaps: Click, scroll, movement, and attention maps.
- Recordings: Replays individual visitor sessions.
- Funnels: Shows drop-off across key steps.
- Form analytics: Pinpoints where forms lose people.
😊 Best For
Smaller stores wanting friction scoring and heatmaps on a modest budget.
💰 Pricing
Around $31 to $399 / Month, depending on traffic and retention.
📊 Reviews
"The friction score is genuinely useful. It tells us which pages to fix first instead of guessing."
— Verified User, Mouseflow G2 Verified Review
"Recordings and heatmaps are solid for the price, but the dashboard feels dated and reporting is fairly basic."
— Verified User, Mouseflow G2 Verified Review
1.11 Pendo
Pendo combines product analytics with in-app guides and feedback, so you can both measure behavior and act on it inside the product. It is most at home with apps and subscription products rather than pure storefronts. For DTC brands with a logged-in app experience, that combination is handy.
✅ Why Did We Choose This Tool?
- Product analytics: Tracks feature usage and paths.
- In-app guides: Nudge users with tooltips and walkthroughs.
- Feedback capture: Collect requests and sentiment in-app.
- Segmentation: Group users by behavior and attributes.
- Retention views: See where engagement fades.
😊 Best For
App-led and subscription brands wanting analytics plus in-app guidance. Stores tracking revenue alongside usage can lean on our sales performance tools.
📊 Reviews
"Pendo lets us see how people use the product and then guide them right there with tooltips. The two together are powerful."
— Verified User, Pendo G2 Verified Review
"The analytics are good but not as deep as a dedicated tool, and pricing climbs fast as you add seats and features."
— Verified User, Pendo G2 Verified Review
1.12 Crazy Egg
Crazy Egg is one of the simplest, most affordable behavior tools, focused on heatmaps, scrollmaps, recordings, and lightweight A/B testing. It is built for SMBs and marketers who want quick wins without a steep learning curve. It holds a 4.2 out of 5 G2 rating, with plans from $29 to $599 per month, billed annually.
✅ Why Did We Choose This Tool?
- Heatmaps and scrollmaps: See clicks and how far people scroll.
- Recordings: Replay visitor sessions.
- A/B testing: Run simple page tests.
- Surveys: Collect on-page feedback.
- No overages: Flat pricing with no surprise usage fees.
😊 Best For
SMBs and marketers wanting simple heatmaps and tests at a low price. To see how an AI-native option compares, read what Luca AI is.
📊 Reviews
"Crazy Egg is easy and affordable. At around $99 a month it covers what our small team needs for heatmaps and basic testing."
— Verified User, Crazy Egg G2 Verified Review
"It is great for simple heatmaps, but it lacks the deeper segmentation and journey analysis that larger stores eventually need."
— Verified User, Crazy Egg G2 Verified Review
Q2: How Did We Score These Platforms? (Our Selection Criteria) [toc=2. Selection Criteria]
We scored each platform on five weighted criteria that total 100%: Behavioral Depth (30%), Intelligence and Insight Quality (25%), Setup and Usability (20%), Pricing Transparency (15%), and User Reviews (10%). Tools scoring 0 to 20 earn 1 star, 21 to 40 earn 2, 41 to 60 earn 3, 61 to 80 earn 4, and 81 to 100 earn 5. Luca AI scores 5 stars.
📊 The Five Weighted Criteria
I want this rubric out in the open so you can argue with it. A ranking you cannot inspect is just an opinion in a nicer font. Here is exactly how we weighted things.
⚠️ Why Behavioral Depth and Intelligence Dominate
Behavioral depth carries the most weight because behavior is where DTC (direct-to-consumer) profit hides. A tool that cannot segment, map journeys, and signal in real time is half-blind. So it caps low no matter how pretty the dashboard looks.
Intelligence and Insight Quality sits second for a blunt reason. A descriptive chart you must interpret for three hours is worth less than a prescriptive answer in three minutes. That gap, the dashboard paradox, is what separates a reporting tool from a thinking one, and it is why founders end up drowning in data.
✅ How Luca AI Tops the Intelligence Axis
This is where Luca AI scores highest, and I will be straight about why. Luca reasons over your data warehouse, finding root cause, influencing components, and running scenario simulations, rather than rendering another chart for you to decode. It moves from "what happened" to "what to do," which is the criterion most tools underbuild, and it is the foundation of our data analysis and research approach.
I could be wrong on the exact weights, and reasonable operators will shift them. If pricing certainty matters more to you than depth, bump that 15% up.
⭐ How to Read the Star Column
The star column in the ranking is just these five scores rolled up and banded. Five stars means a tool cleared 81 points across all criteria, not that it won a popularity contest. Crucially, we never print the raw number, only the band, because a single point should not feel like a verdict.
💰 Reviews That Shaped the Scores
Verified reviews fed the 10% reviews weight, and the patterns mattered more than any single quote. For more context, see our roundup of the best Shopify analytics apps.
"The funnel analysis features make it simple to uncover user behavior patterns, and the dashboards fit both quick checks and deep dives."
— Verified User, Mixpanel G2 Verified Review
"It is genuinely powerful, but the pricing is opaque and negotiable, and overages can add 20 to 40% to annual spend."
— Verified User, Fullstory G2 Verified Review
Q3: What Is Customer Behavior Analytics, and How Do Its Core Methods Work? [toc=3. CBA Foundations & Methods]
Customer behavior analytics is the practice of collecting and interpreting how customers interact across your store, including clicks, scrolls, sessions, purchases, and drop-offs, to explain why they act, not just what they did. It spans four layers: descriptive, diagnostic, predictive, and prescriptive. Its core methods are segmentation (including RFM cohorts), heatmaps and session replay, journey mapping, funnel analysis, and real-time behavioral signals. Most tools stop at descriptive; the value is prescriptive.
🧭 The "Why" vs "What" Ladder
Think of descriptive analytics as your car's speedometer. It tells you what is happening right now: sessions up, conversion flat. Useful, but it does not tell you where to turn.
Prescriptive analytics is the GPS. It tells you what to do next based on where you are headed. The four layers climb from what happened (descriptive), to why (diagnostic), to what will happen (predictive), to what to do (prescriptive). Most tools park you at the speedometer, as our guide to e-commerce analytics platforms explains.
👥 Segmentation and RFM Cohorts
Segmentation groups customers by shared behavior so you stop treating a one-time buyer like a loyalist. RFM (recency, frequency, monetary value) cohorts are the workhorse here, ranking customers by how recently and often they buy, and how much they spend.
Here is the payoff in practice. On real Shopify data, what jumped out was that anyone who buys body care often climbs 50 to 100% in lifetime value, a relationship no founder would guess by staring at one metric. That is the Van Gogh problem: judge a painting by a single brushstroke and you miss the picture. Tracking it well is the heart of strong unit economics.
🔥 Heatmaps, Replay, Journeys, and Funnels
These four methods answer where customers struggle.
- Heatmaps: Color-map clicks, scrolls, and attention to show which page elements pull or repel.
- Session replay: Replays a real visit so you watch the friction instead of guessing.
- Journey mapping: Stitches multi-session paths to reveal how someone actually reaches checkout.
- Funnel analysis: Quantifies drop-off at each step, so you fix the leak that costs the most revenue.
Each one trades guesswork for evidence. A rage click on a broken size selector is worth more than a hunch, and it feeds directly into your wider e-commerce website analytics.
⏰ Real-Time Behavioral Signals
Real-time signals are the sentry layer most tools underbuild. They watch behavior continuously and flag the moment something breaks, before your weekly report even loads.
This is where Luca AI operates differently. It runs at the prescriptive layer as an AI layer over your warehouse, scanning 24/7 to surface root cause and areas of improvement, not a dashboard you babysit. That is cohort-level vigilance without building a cohort-level dashboard, which is exactly how agentic AI for e-commerce founders should work.
Q4: Which Platform Fits You, and How Do You Choose Without Wrecking Privacy Compliance? [toc=4. Choosing & Compliance]
Choose by what is broken and who is asking. Product analytics measures in-app events; customer behavior analytics spans every touchpoint and folds product analytics in. Marketing teams lean on segmentation and journey mapping; product teams lean on funnels and replays. For budget heatmaps choose Hotjar or Crazy Egg; for deep events, Mixpanel or Amplitude; for enterprise journeys, Contentsquare or Glassbox. Whatever you pick, demand first-party, consent-based, cookieless tracking.
🧩 Behavior Analytics vs Product Analytics
The scope is the real difference. Product analytics watches what happens inside your app or site; customer behavior analytics watches the whole relationship and includes product analytics as a subset.
✅ Scenario-Based Recommendations
Pick by stage, budget, and team, not by who has the loudest ads.
- If you are pre-$1M and budget-tight, choose Hotjar or Crazy Egg for affordable heatmaps.
- If you are a product-led team needing deep events, choose Mixpanel or Amplitude.
- If you are enterprise with big traffic and compliance needs, choose Contentsquare or Glassbox.
- If you have a mobile app, choose Smartlook for web and app replay in one place.
- If you are a scaling DTC brand wanting cross-functional reasoning, choose Luca AI.
I will recommend a competitor without flinching when the use case is narrow. A candle brand doing $30K a month does not need enterprise journey analytics, though it can still benefit from a leaner e-commerce tech stack.
🔒 The 2026 Privacy and Compliance Checklist
Here is the part most tool comparisons skip, and it is the part that can sink you. Third-party cookies are unreliable in 2026, so durable tracking has to be first-party and consent-based.
Run any shortlist through this checklist before you sign, and check it against our privacy policy for a clean-data benchmark.
- Consent first: Tracking fires only after explicit opt-in.
- First-party, cookieless: Data collected from your own domain, not third-party cookies.
- Anonymization: PII (personally identifiable information) masked in replays by default.
- Data residency: You control where data is stored (EU, US).
- Clean ingestion: Data normalized and governed on entry, not patched later.
That last point is where Luca AI fits the privacy story. It normalizes and standardizes data on ingestion, so a scaling DTC brand gets cross-functional reasoning over governed, first-party data that stays defensible, which supports tighter financial management down the line.
💬 What Operators Actually Say
"Heap saves a ton of time because we do not have to instrument every event up front."
— Verified User, Heap G2 Verified Review
"It is great for simple heatmaps, but it lacks the deeper segmentation and journey analysis that larger stores eventually need."
— Verified User, Crazy Egg G2 Verified Review
Q5: How Do You Turn Behavioral Signals Into Profit and Prevent Churn Before It Happens? [toc=5. Signals to Profit & Retention]
Profit and retention hide behind blended averages. Allocate behavioral and cost data down to the SKU (stock-keeping unit, a single product) and a "72% gross-margin best-seller" can collapse to 8% real contribution once every cost is counted. The same behavioral layer predicts churn early: rising rage clicks and stalled re-orders surface friction weeks before any cancellation. The goal is finding the 10% of signals driving 90% of profit, then acting fast.
😩 The Dashboard Janitor Trap
Picture a founder at her desk on a Tuesday night. She has a 25-page summary open, she has exported four CSVs, and she still cannot answer one question: which product actually makes money?
That is the dashboard janitor trap. You spend your week cleaning and stitching data instead of deciding anything. The reports pile up; the answers do not. It is the core reason founders end up drowning in data.
📉 The Invoice That Changed Her Mind
I sat with an operator who slid a P&L across the table, proud of a 72% gross-margin hero product. Twenty minutes later, once we layered in returns, the heavy customer-support load, and freight, her actual contribution margin was 8%.
The same product drove 42% of her support tickets, roughly $1.45 of hidden cost per unit. Blended averages had hidden a money-loser inside a "best-seller." Margin is a story; contribution is the truth, which is why tracking real unit economics matters.
💰 SKU-Level Allocation and the 90/10 Rule
The fix is allocating every real cost, including returns, support, shipping, and ad spend, down to the individual SKU. Once you do, the picture flips and you see true contribution per product.
This is where Luca AI earns its keep as an analytics layer. It computes true SKU-level contribution and surfaces the small set of signals driving most of your profit, then pushes the alert to Slack or email before that invoice ever reaches the table. You chase the 10% that matters, not all 100%, which is the heart of strong true profitability.
⏰ Catching Churn Before the Cancellation
Churn rarely announces itself. Behavioral signals lead the cancellation by weeks: rising rage clicks, stalled re-orders, and slowing session frequency. Fullstory's own analysis notes that friction signals often precede the moment a churn-risk score moves, which is exactly why a behavioral sentry beats a lagging revenue metric.
The practical move is a sentry model: watch every session at scale and flag the precursors automatically. Catch the friction at signal one, not at the refund request, the way agentic AI for e-commerce founders is meant to work.
💬 What Operators Say
"Heap saves a ton of time because we do not have to instrument every event up front."
— Verified User, Heap G2 Verified Review
"Fullstory's autocapture means we can go back and answer questions we did not know we had."
— Verified User, Fullstory G2 Verified Review
Q6: Native Built-In AI or a Dedicated Reasoning Layer, Which Should You Trust? [toc=6. Native AI vs Reasoning Layer]
It depends, but high-growth operators are right to be wary of bolt-on native AI. Built-in vertical AI has been caught hallucinating and "telling fibs," forcing teams to switch it off, while a dedicated reasoning layer over your data warehouse tends to outperform expensive proprietary builds. Judge a platform by whether AI is its foundation or a sticker, and never let the AI be your QA (quality assurance, the final accuracy check).
🤔 The Common View: "Just Turn On the Native AI"
The popular take is simple. Your tool added an AI button, so press it and let it forecast.
I think the standard read gets this backwards. A native AI feature bolted onto a reporting tool is only as good as the narrow domain it was trained on. That is a sticker, not a foundation, as our look at what Luca AI is explains.
❌ Where Bolt-On AI Breaks
I have watched a platform ship its own AI forecasting feature that was, bluntly, rubbish. It hallucinated numbers, told confident fibs, and the team had to shut it down.
The failure mode is predictable. One brand let AI auto-pick a product image and shipped the wrong bike to a catalog, because nobody checked. Do not let the AI be the QA. A founder I respect spent close to $10M on a proprietary build and learned the same lesson the expensive way, a cautionary tale for any e-commerce tech stack.
✅ The Better View: A Reasoning Layer Plus Human QA
A dedicated reasoning layer sits over your full data warehouse, not one narrow domain, and reasons across it. Pair it with a human check and you get speed without the silent errors.
Here is the analogy I trust. A brilliant new PhD hire is useless on day one until you onboard them on your business. Luca AI is built that way: it is AI-native, a reasoning layer over your warehouse, because most analytics tools added AI while Luca is AI, and it self-onboards on your data rather than guessing. That foundation powers our data analysis and research work.
💬 What Operators Say
"The mobile app recording is the real reason we picked Smartlook. We finally see what happens inside our app."
— Verified User, Smartlook G2 Verified Review
"Amplitude often answers my needs before I even realize them, but sometimes the deep root analysis feels overly complicated."
— Verified User, Amplitude G2 Verified Review
Q7: If You Need Growth Capital, How Does Luca Compare on Rate, Speed, and Terms? [toc=7. Capital: Rate, Speed & Terms]
If you are evaluating growth capital, judge any provider on the numbers that matter: effective rate, time to disbursal, repayment flexibility, and total fees. Luca offers fast disbursal and transparent, flexible repayment terms that compare directly against revenue-based financing (RBF, funding repaid as a share of sales) providers like Wayflyer and Clearco. Compare the rate, the speed, and the fine print, not the marketing.
💰 The Four Capital Metrics That Matter
Forget the brochure language and read four numbers. They decide whether capital helps you or quietly squeezes your cash.
- Effective rate: The true all-in cost, not the teaser fee.
- Time to disbursal: How fast cash actually lands in your account.
- Repayment structure: Fixed daily debits versus flexible, sales-linked draws.
- Total fees: Every charge, including what triggers on early or partial draws.
The trap is the gap between the offer and the contract. One operator was approved in writing, then watched Wayflyer reverse the decision at the last minute, wrecking their cash flow. Modeling that risk is core to sound cash flow forecasting.
📊 Luca vs Revenue-Based Financing Providers
Here is how the capital experience compares on those exact metrics, using verified operator complaints as the contrast.
⚠️ Read the Fine Print Before You Sign
The recurring pattern in these reviews is not the headline rate. It is repayment that drifts from the signed terms after the cash lands. For alternatives, see our roundup of Wayflyer alternatives.
"They pulled funds far faster than the contract stated thereby increasing the effective interest rate significantly."
— Thomas Bishop, Clearco Trustpilot Verified Review
"I have used Wayflyer on a number of occasions, only to be told we no longer fit their criteria. I could no longer recommend Wayflyer."
— Joshua Hannan, Wayflyer Trustpilot Verified Review
So my advice is blunt: model the cash-conversion-cycle impact before you sign, and demand that the repayment terms in the contract match the offer. Aligning capital with growth is what our work on financial management is built for.

.webp)
.svg)
.webp)

.png)
