.svg)
.svg)

Q1. What is ecommerce customer analytics, and why does revenue hide the truth? [toc=What It Is]
Last month a founder doing $480K a month messaged me at 11pm. Her Shopify dashboard was green. Her bank balance was not. That gap, between what the numbers show and what the business actually feels like, is the real subject of ecommerce customer analytics.
Ecommerce customer analytics is the discipline of collecting behavioral, transactional, and financial customer data, then converting it into decisions across acquisition, conversion, and retention. Done right, it answers one question: which customers and journeys actually create profit. Done wrong, it produces dashboards full of descriptive noise while revenue growth quietly masks negative cash flow and unsustainable acquisition costs.
📉 The "green dashboard, empty bank account" problem
Operators feel this before they can name it. You are flying blind, bombarded with a torrent of disjointed data, and somehow scaling unhappiness instead of profit. Revenue climbs while cash gets tighter, and nobody can tell you why in plain English.
Trust in the default tools is thin. One mid-market retail buyer put it bluntly on G2.
"The change to GA4 has been for the worse... it is really difficult to trust it 100% and it complicates decision-making."
Verified User in Retail Google Analytics G2 Verified Review
On the Shopify side, operators say the same thing in their own threads. Keep it simple, use the built-ins, and do not pay for fancy apps until you know what you are measuring.
"Keep it simple first, use Shopify's built-ins to spot where people drop off, and try basic bestsellers/related blocks before paying for fancy apps."
u/nu55mgg, r/ShopifyeCommerce Reddit Thread
💸 Why gross margin lies to you
Here is the reframe I push on every operator. Gross margin is a lie. It only tells you what it costs to make the thing. It tells you nothing about what it costs to sell the thing.
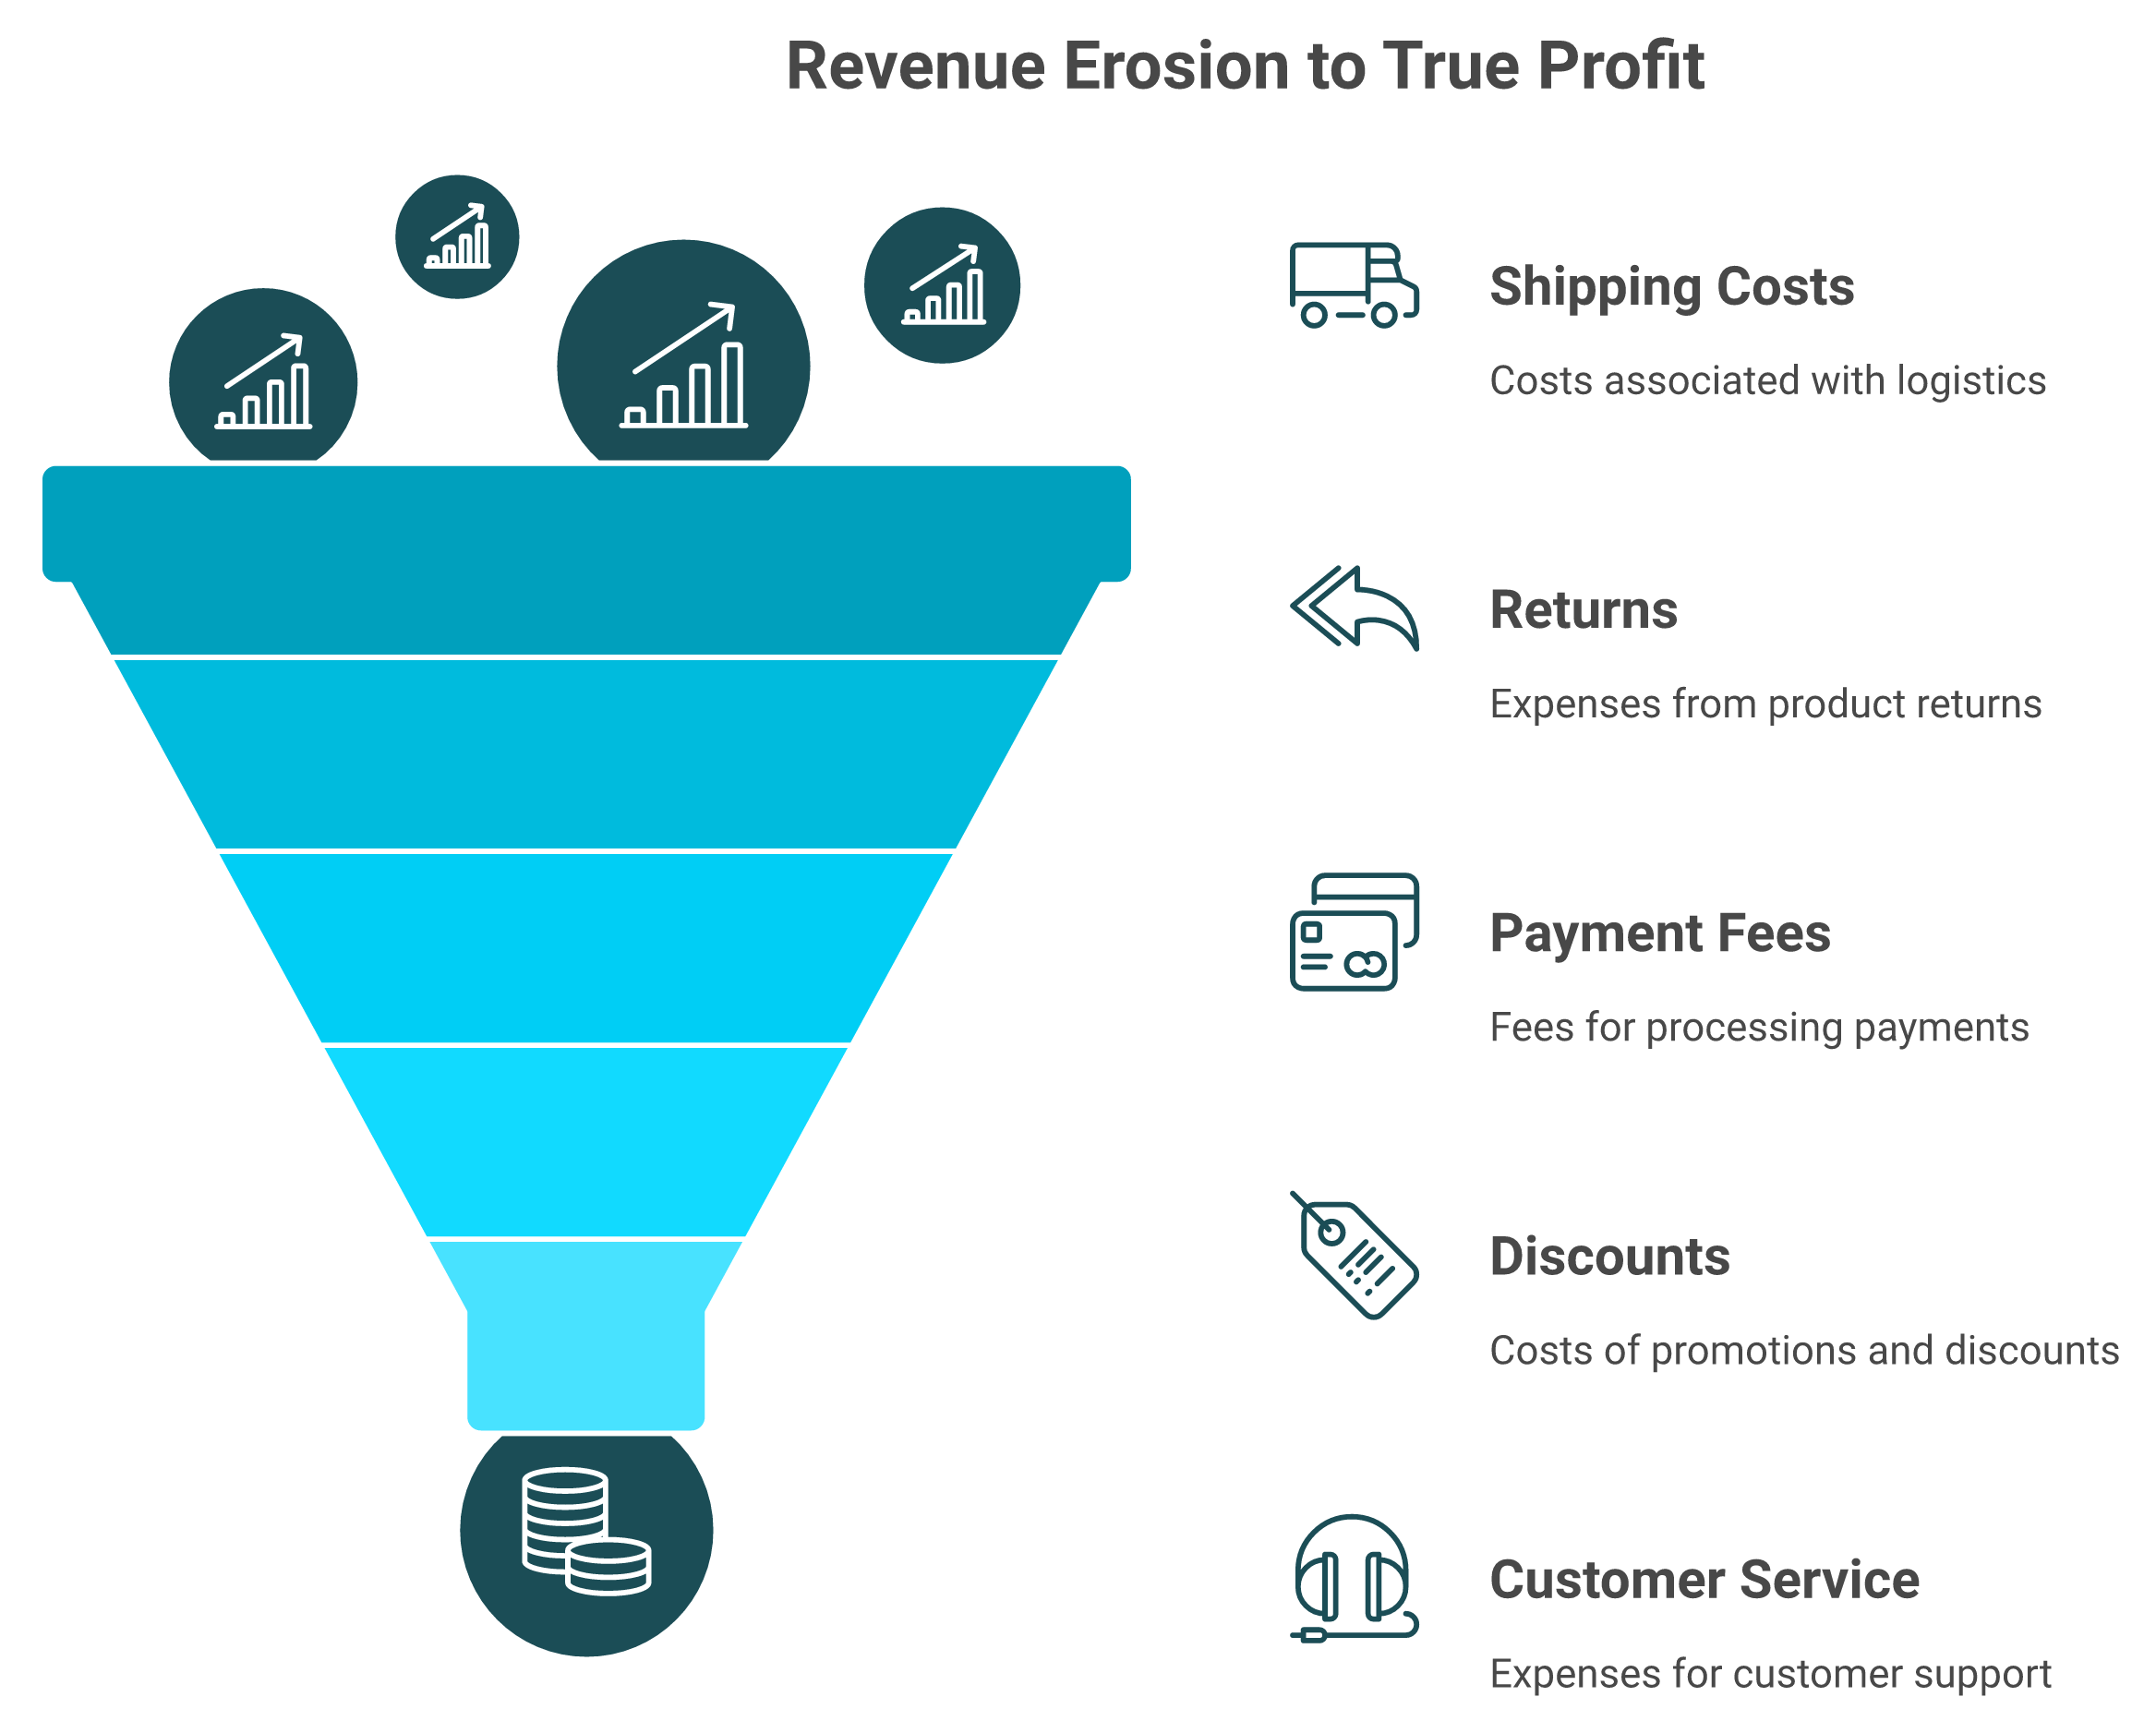
The eight costs between the supplier invoice and actual profit, like shipping, returns, payment fees, discounts, and customer service, are where businesses bleed. Customer analytics done properly is contribution-margin discovery, not chart building. It finds the 10% of your customer journey that creates 90% of your profit.
✅ From "what happened" to "what to do"
The shift that matters is descriptive to prescriptive. A report that says revenue fell 6% is trivia. An insight that says revenue fell because your best cohort's repeat rate dropped after a shipping change is a decision.
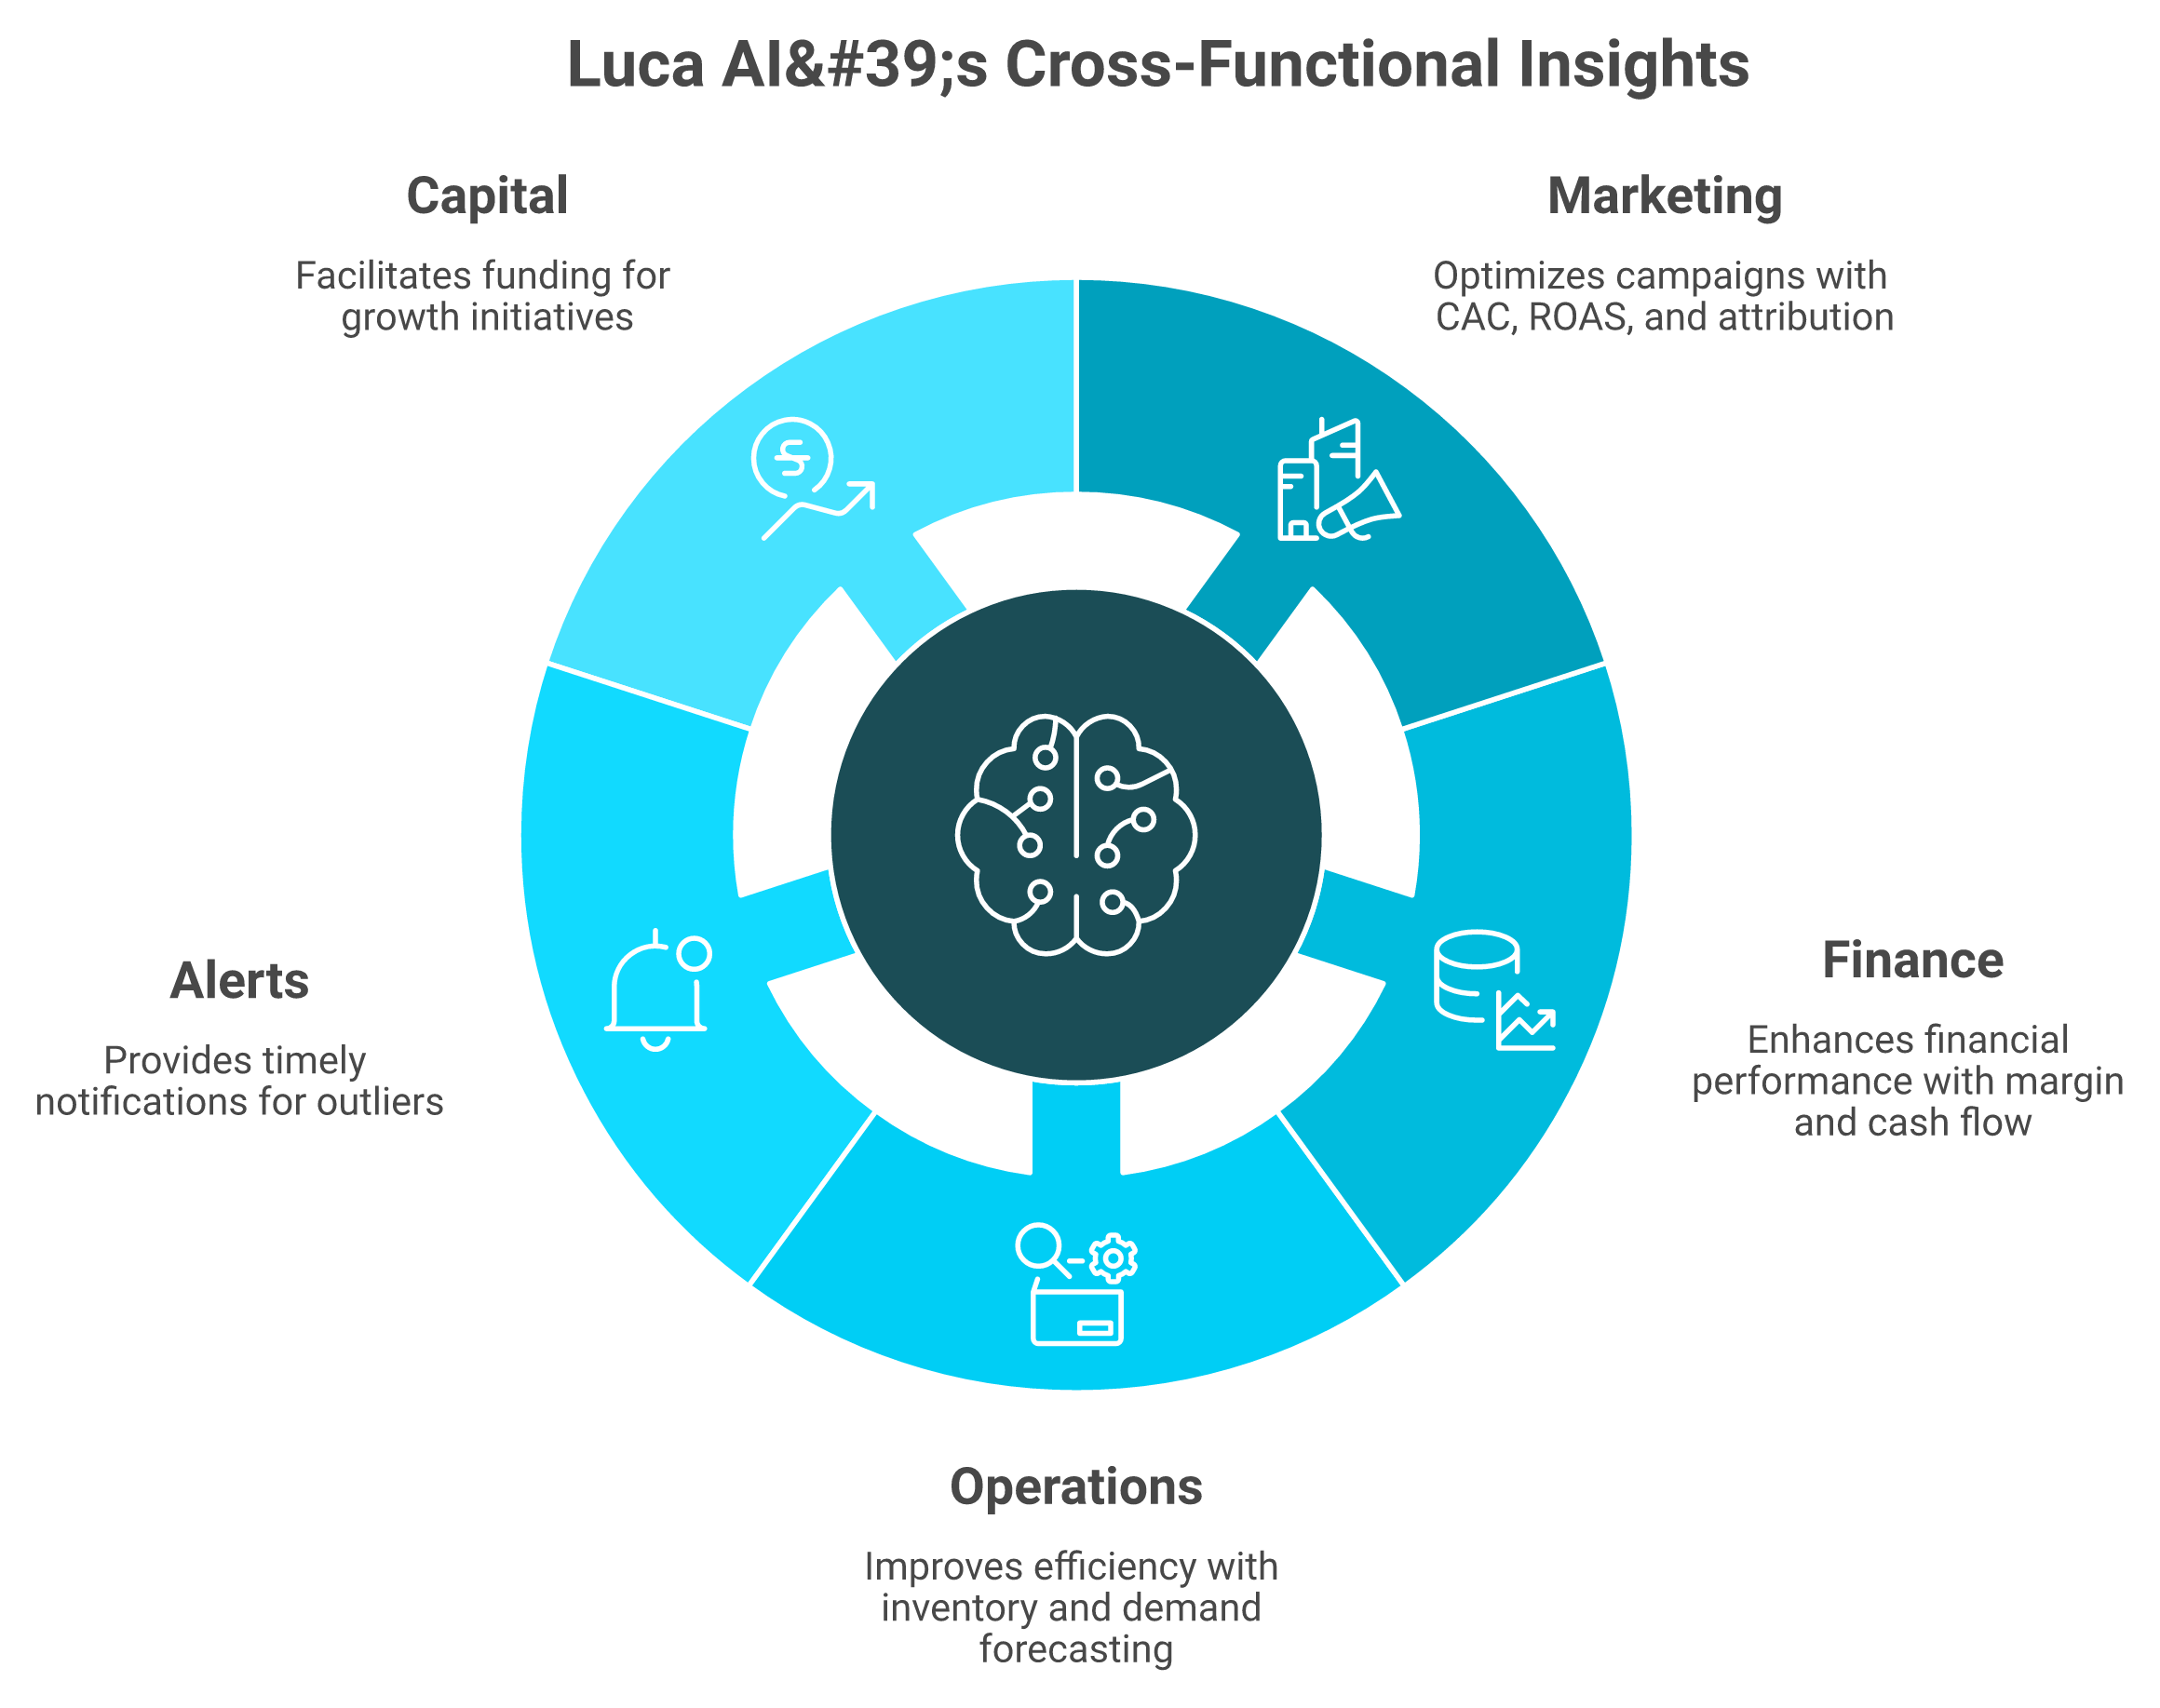
This is the gap we built Luca AI to close. It sits as an AI layer over your data warehouse, reasoning about contribution margin per customer, not just top-line revenue. You ask in plain English, and it answers with the why.
Q2. Which customer metrics actually matter, and which ones lie to you? [toc=Metrics That Matter]
I once sat across from a founder who slid an invoice across the table. "This is our best seller, 72% gross margin." Twenty minutes later, after we calculated true contribution margin line by line, she was nearly in tears. The real number was 8%. She had scaled a money pit for two years.
The metrics that matter are contribution margin per order, customer lifetime value (LTV), customer acquisition cost (CAC) and its payback period, repeat-purchase rate, retention and churn by cohort, average order value (AOV), and net promoter score (NPS). The ones that lie are gross margin, blended ROAS, and raw traffic. A counterintuitive finding from operator data: LTV is driven less by purchase frequency and more by product-category diversity.
🧮 The metric taxonomy that protects margin
Each metric below answers a question your P&L cannot. Define them once, track them weekly, and you stop guessing. For a deeper breakdown, see our guide on the best way to track e-commerce unit economics.
⏰ The 12-month cash trap
Here is the number that scares operators awake. The average time to break even on a new customer is roughly 12 months for many ecommerce companies. If your CAC payback runs longer than your cash runway, growth itself becomes the threat.
I might be slightly off on the exact month for your category, but the principle holds. You can be "profitable" on paper and insolvent in practice, which is why cash flow forecasting matters as much as the metric itself.
🔀 The LTV insight most founders miss
From what surfaces when you actually run the data, the leading driver of LTV is not frequency. It is category diversity. Get a single-category buyer to purchase a second category, and LTV can jump 50% to 100%.
That insight only appears when you join order data, product data, and customer data together. Most stores never run that join because it sits across three disconnected tools. That cross-table reasoning is exactly the kind of query Luca AI answers over a unified warehouse, in plain English, without an analyst.
Q3. How does the customer lifecycle map to an analytics maturity ladder? [toc=Lifecycle and Maturity Ladder]
A founder asked me last quarter which metric she should "finally fix." Wrong question. Fixating on one metric is like studying a Van Gogh through a magnifying glass locked on one square inch. You miss how the colors work together.
The customer lifecycle moves through five phases: awareness, acquisition, conversion, retention, and advocacy. Your analytics should mature in that order. Stage one tracks the Big Five (traffic, conversion rate, AOV, LTV, retention). Stage two layers cohort and margin views. Stage three adds prediction and prescription. Most stores fail by chasing stage-three dashboards before they trust stage-one numbers.
🪜 The three-rung maturity ladder
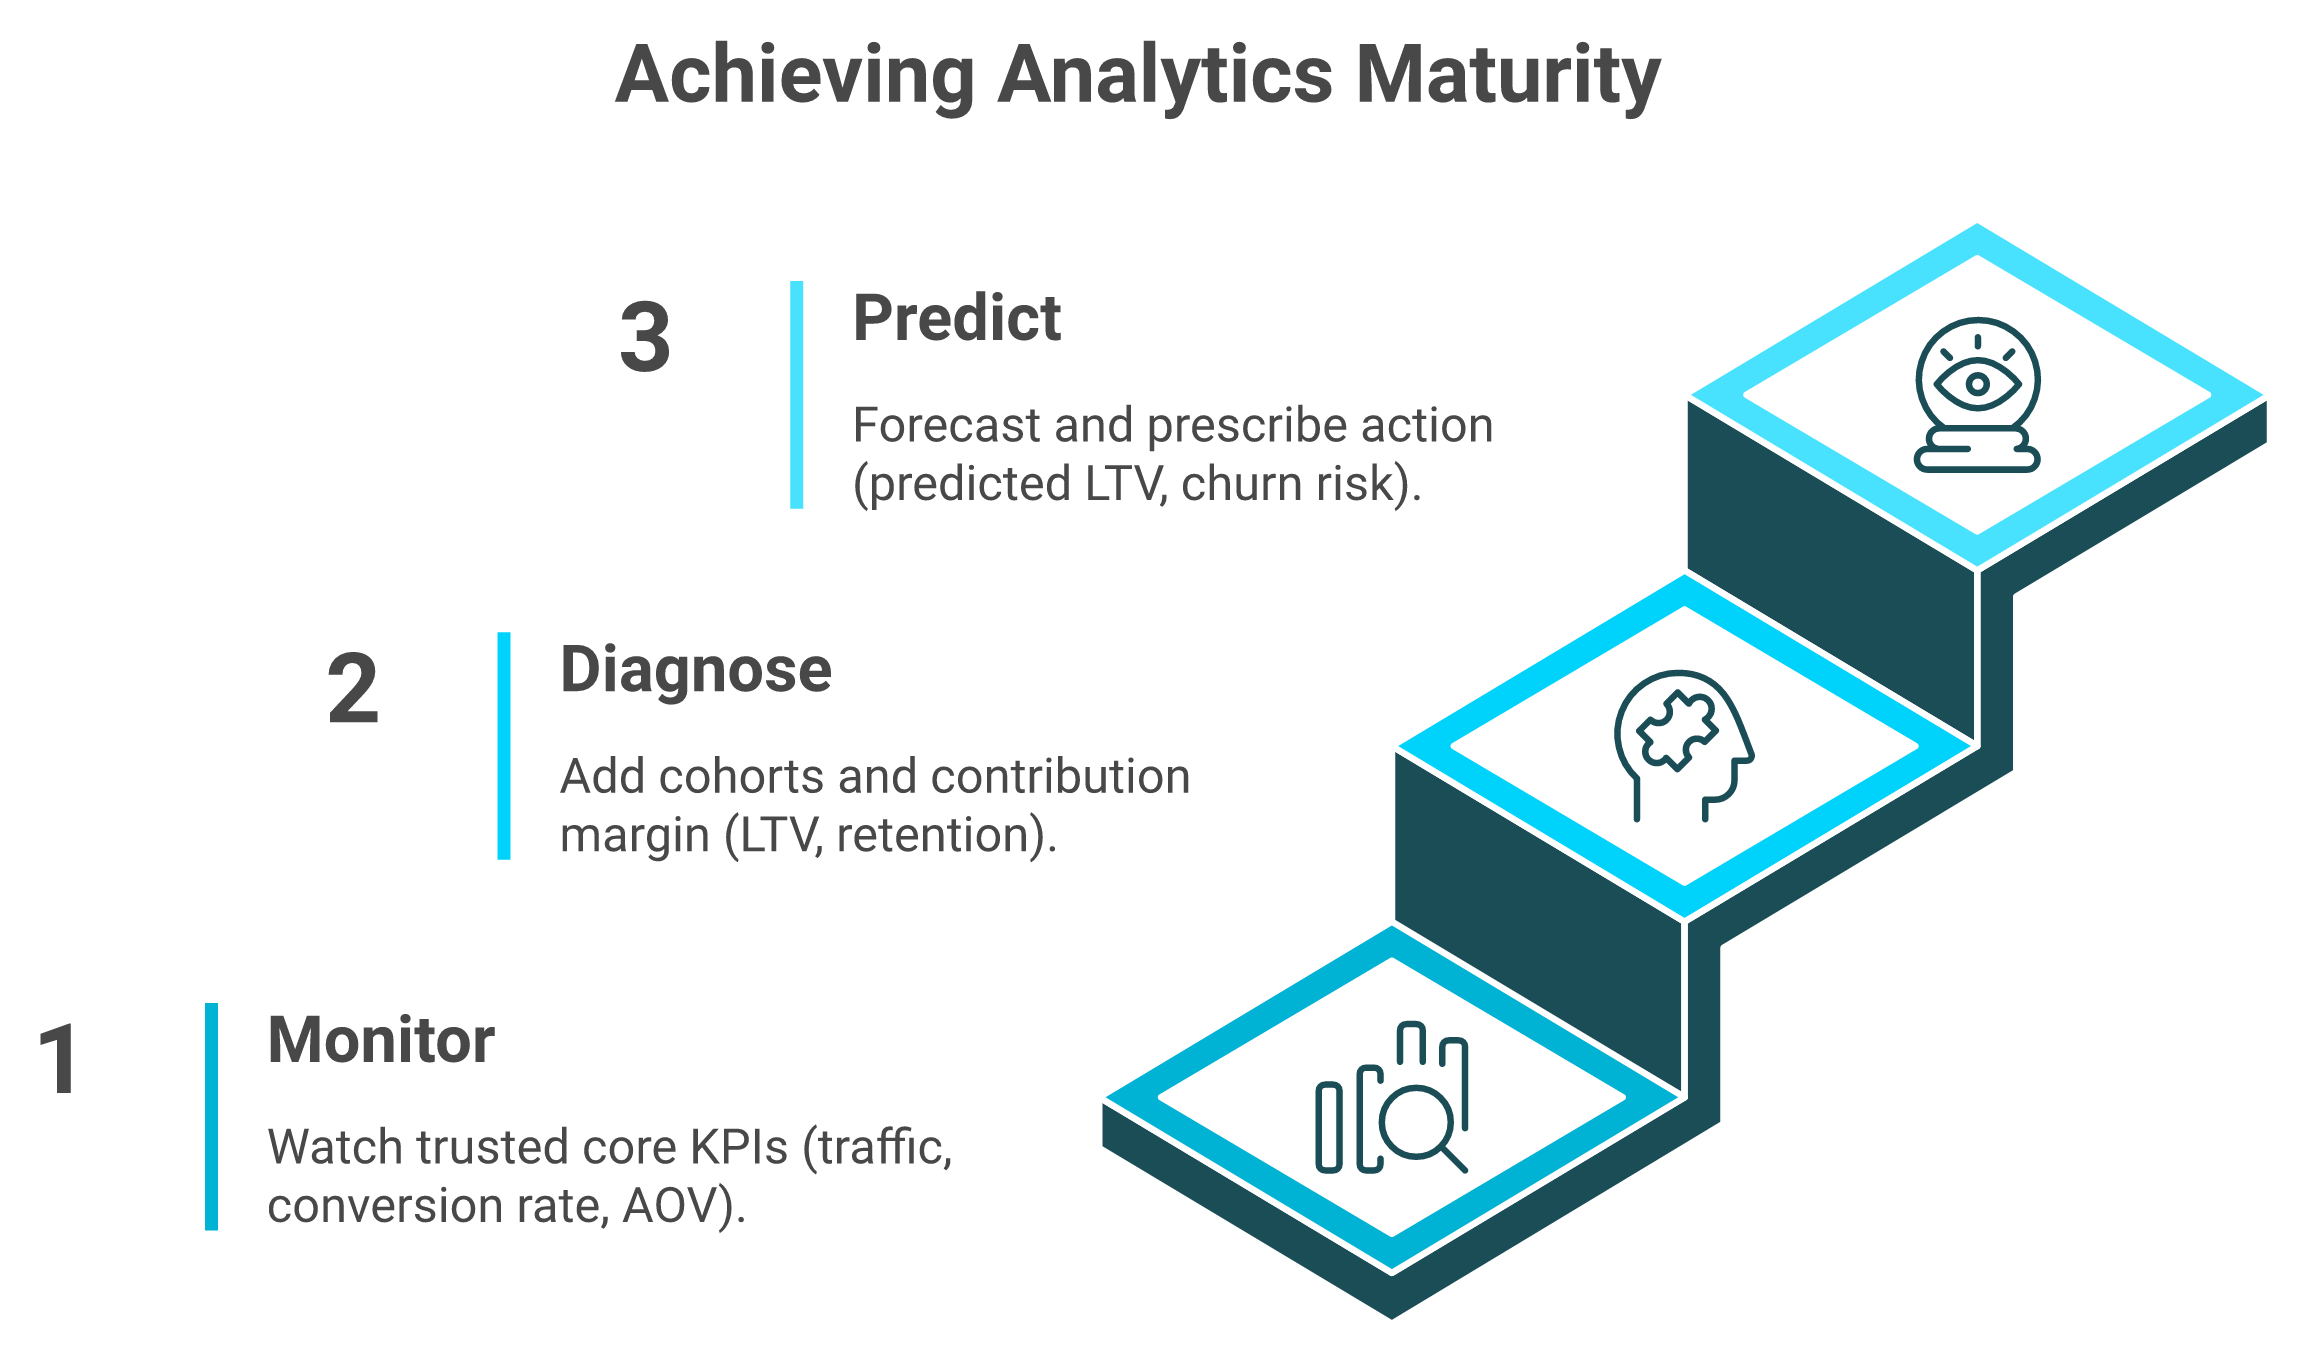
Think of analytics maturity as climbing, not collecting. Each rung earns the next. Our overview of ecommerce analytics platforms maps neatly onto these stages.
A 2026 BigCommerce metrics guide frames this same Big Five as the KPI core that scales with you, and Salesforce describes ecommerce analytics as lifecycle study across the full funnel, not a single snapshot.
🎯 Maturity is "monitoring to recommending"
Here is the part the category gets backwards. Maturity is not measured by how many dashboards you own. It is measured by how quickly data turns into a recommended action.
I have watched stores add their fifth dashboard and get slower, not smarter. The standard read says "more visibility equals more control." In practice, more charts often means more staring and less deciding, a trap we unpack in our piece on the best Shopify analytics apps.
🤖 Where an AI layer sits on the ladder
The top rung, prediction and prescription, is where most teams stall. It needs clean joins, historical depth, and someone to interpret the pattern at 2am when ROAS tanks.
That top rung is where Luca AI lives. It reasons over your warehouse to predict where a cohort is heading and simulate what happens if you shift spend, so you are not stuck monitoring a chart waiting for the bad news to arrive.
Q4. How do you segment customers with RFM and cohort analysis without drowning in dashboards? [toc=Segmentation and Cohorts]
A founder told me he had "20 executive summaries, each 25 pages long," pulling the most interesting intel from Klaviyo, Meta, and Google. Then he asked the only question that matters: "Okay, how do I actually use this?" That is the trap this section solves.
RFM segmentation scores customers on recency, frequency, and monetary value to isolate high-value and at-risk groups. Cohort analysis tracks how each acquisition group behaves over time. The trap is building beautiful dashboards you must babysit daily. The fix is a sentry that pings you only when a cohort's retention or ROAS breaks a threshold.
📊 Run RFM in four steps
RFM is the fastest segmentation you can run this week. You only need order history.
- Score each customer 1 to 5 on recency (how recently they bought).
- Score 1 to 5 on frequency (how often they buy).
- Score 1 to 5 on monetary value (how much they spend).
- Combine the scores to flag champions, at-risk, and lapsing groups.
🧊 Set up cohorts that catch leaks
A cohort is simply a group of customers who first bought in the same window, like "January new customers." You then watch how much each cohort spends in months two, three, and four.
Watch for the drop. If your March cohort retains worse than January, something changed: a shipping delay, a discount that attracted bad-fit buyers, or a product quality dip. Cohorts turn a vague "churn feels high" into a dated, fixable event you can run through marketing analysis and automation.
⚠️ The dashboard paradox
Here is the uncomfortable math. The same review that takes three hours staring at dashboards takes three minutes done conversationally. Dashboards are often a silent killer of insight because they hand you descriptive noise, not a prescriptive recommendation.
Operators feel this even with paid tools. One reverted to raw sources after the dashboards failed.
"Unable to deliver on the promise to provide any insights or accurate data to our business, and we end up reverting back to direct data sources like Meta, Shopify, Recharge."
Matt Huttner Triple Whale Trustpilot Verified Review
And the simplest fix is often the cheapest, per operators themselves.
"Keep it simple first, use Shopify's built-ins to spot where people drop off, and try basic bestsellers/related blocks before paying for fancy apps."
u/nu55mgg, r/ShopifyeCommerce Reddit Thread
🛰️ Vigilance over visualization
My read right now is that the goal is cohort-level vigilance without the cohort-level dashboard. You want a sentry, not another screen to check. Something that scans 24/7 and only interrupts you when ROAS dips, CAC spikes, or inventory crosses a threshold.
This is where agentic AI earns its place. Luca AI runs RFM and cohort logic over your warehouse, then pushes customized reports to Slack or email on a schedule, with the reasoning attached, so you move from monitoring to acting.
Q5. What can you actually do with customer analytics: segmentation, personalization, churn prediction, and demand forecasting? [toc=Core Use Cases]
A founder told me he reviews "maybe five session recordings a week" when he gets around to it. Imagine an engine watching 5,000 a day and surfacing what no human on his team could. That gap is where customer analytics stops being reporting and starts paying rent.
Four use cases drive most of the return: segmentation activation (route spend to high-LTV groups), personalization (recommendations that lift basket size), churn prediction (intervene before a cohort lapses), and demand forecasting (buy inventory you will actually sell). The test for each is identical. Does it change a decision and protect margin, or just produce another chart?
🎯 Use case 1.1: Segmentation activation
Segmentation is only useful when it moves money. You take your high-LTV group and route ad spend, email frequency, and offers toward them, away from low-value buyers.
The activation step is the point. A segment that sits in a dashboard does nothing; a segment that reallocates 20% of Meta spend toward your top decile changes your CAC. This is the heart of effective marketing analysis and automation.
🛒 Use case 1.2: Personalization and recommendations
Personalization means showing the right next product, not a generic "you may also like" row. The highest-leverage version pushes a first-time buyer into a second product category.
From what surfaces when you actually run the data, that category jump can lift LTV by 50% to 100%. One operator case study of data-driven DTC brands reported personalization driving roughly a 25% retention lift, which tracks with what I see in the field.
⏰ Use case 1.3: Churn prediction
Churn prediction flags a customer or cohort drifting toward lapse before they are gone. You watch for the slowdown, then intervene with a win-back offer or a service touch.
This matters because the average time to break even on a new customer runs near 12 months in ecommerce. Lose them at month four, and you never recoup the CAC you already spent. This is where Luca AI earns its keep: it studies months of behavior, senses when a pattern breaks, and pings you with a suggested action instead of waiting for you to notice.
📦 Use case 1.4: Demand forecasting
Demand forecasting tells you what to buy and how much, so cash does not get trapped in dead inventory. One sharp tactic is ranking SKU velocity from a year of sales, then slotting your warehouse by it.
That single exercise, deciding what goes at hip height versus the back shelf, can save months of guesswork. Luca handles this prediction layer by reasoning over your full order history, simulating reorder scenarios, and flagging the SKUs about to stock out or overstock, the kind of work that keeps your working capital free.
"It centralizes data on traffic sources, user behavior, and conversion events, which helps us measure marketing performance and identify what is working and what is not."
Aman S., Performance Marketing Head Google Analytics G2 Verified Review
I could be off on the exact lift for your category. But the pattern is consistent: the brands that win pick two or three of these use cases and run them hard, instead of admiring all four on a screen.
Q6. How accurate is your data really, and what breaks ecommerce analytics? [toc=Data Accuracy and Breakage]
I have watched a founder make a $40K reorder decision off a dashboard that was double-counting orders. The data looked confident. It was wrong. You cannot act on numbers you do not trust, and most ecommerce data breaks quietly.
Your analytics are only as trustworthy as your data foundation, and that foundation breaks constantly. Operators report GA4 over-counting through sampling, attribution tools crediting fake conversions from external marketplaces, and non-standard retail calendars breaking multi-channel reports. Even page speed corrupts the dataset. A one-second load delay can cut conversions by about 7%.
⚠️ The three breakages nobody warns you about
These are the failures I see most when I open a brand's stack. Each one silently poisons every downstream metric, a problem we explore in our guide to ecommerce website analytics.
- Sampling: GA4 estimates from a slice of traffic, so the same question can return two different answers.
- Fake attribution: tools credit marketplace orders that never touched your store.
- The convention bottleneck: retail-week conventions (554, 4-4-5) differ across brands, so multi-channel reports never line up.
The receipts are loud. On sampling, one enterprise analytics lead was blunt.
"When we switched to an enterprise web analytics solution that does no sampling, we found that Google Analytics was telling us we had twice as much traffic as we actually do... the data just cannot be trusted."
Gitai B., Web Analytics Lead Google Analytics G2 Verified Review
On attribution, a multi-channel seller documented months of phantom conversions.
"Triple Whale shows orders from external marketplaces as if they were real conversions even though these orders never go through our Shopify store... Completely fake data."
XTRA FUEL Triple Whale Trustpilot Verified Review
🛰️ Fix the schema on ingestion
Here is the move most teams skip. You standardize and normalize data as it lands, before it ever hits your reporting layer.
The standard read says "clean the data later." My read right now is that "later" becomes a lost year. This is the one architectural choice behind Luca AI: it normalizes and standardizes data on ingestion, so the answer is trustworthy the first time you ask. Skip the data-cleanup year, plug in, ask, act.
Q7. Can AI agents replace your analytics team, or just your dashboards? [toc=AI Agents vs Dashboards]
A founder I know gave Claude terminal access to his Shopify APIs and a dozen personality profiles, then named it "Atlas." His words: "It literally starts talking the way that I talk. I message it in the morning, and it's like, let's go, bro." That is the shift. AI is replacing the dashboard, not the operator.
Founders now point reasoning engines at their Shopify, Meta, and finance data and just ask questions. But native, bolt-on AI often disappoints. One operator called their inventory tool's built-in forecasting "rubbish" that "hallucinated and told fibs." Use AI for reasoning, and keep humans for empathy and QA.
🤖 Where AI wins, and where it faceplants
The line is not "AI good, humans bad." It is about which job you hand it. We break this down further in our look at agentic AI for ecommerce founders.
The native-AI pain shows up across operator threads. Shopify's own assistant gets roasted regularly.
"Spinning in circles and telling you it can do things that it can't. AI is a great tool. Sidekick just acts like a tool."
u/o4hy5m7, r/shopify Reddit Thread
"I tried getting it to build some category sales analytics, but it failed miserably."
u/nv1x5p0, r/shopify Reddit Thread
🧠 Onboard it like a PhD hire
Think of AI like a brilliant PhD generalist on day one. Smart, but useless until you onboard it with your context.
Do not let the AI be the QA. A brand the size of Specialized once shipped a homepage bike image with mechanically impossible parts. The lesson sticks: AI drafts, humans approve.
✅ Reasoning engine, not chatbot
This is the distinction behind Luca AI. Most analytics tools added AI; we built the reasoning engine first. It works as a sentry over your warehouse, runs root-cause analysis, simulates scenarios, and pushes scheduled reports to Slack or email, instead of a chatbot that agrees with you and forgets the question. See how this compares in our roundup of the best AI tools for Shopify owners.
Q8. How do you turn a customer insight into funded action? [toc=Insight to Funded Action]
I have sat beside a founder during Q4 inventory panic, holding a clear insight, a winning SKU about to sell out, and no cash to act on it. An insight you cannot fund is just trivia. Data needs action, and action needs capital.
The workflow is simple to say, hard to live. Surface the pattern, prove it with the cheapest possible smoke test, then deploy capital fast. The friction is brutal. Revenue-based financiers reverse approved offers at the last minute and cut funding mid-growth. When capital is on the line, what matters is the rate, the disbursal time, and whether the terms hold.
🧪 Prove it with a smoke test first
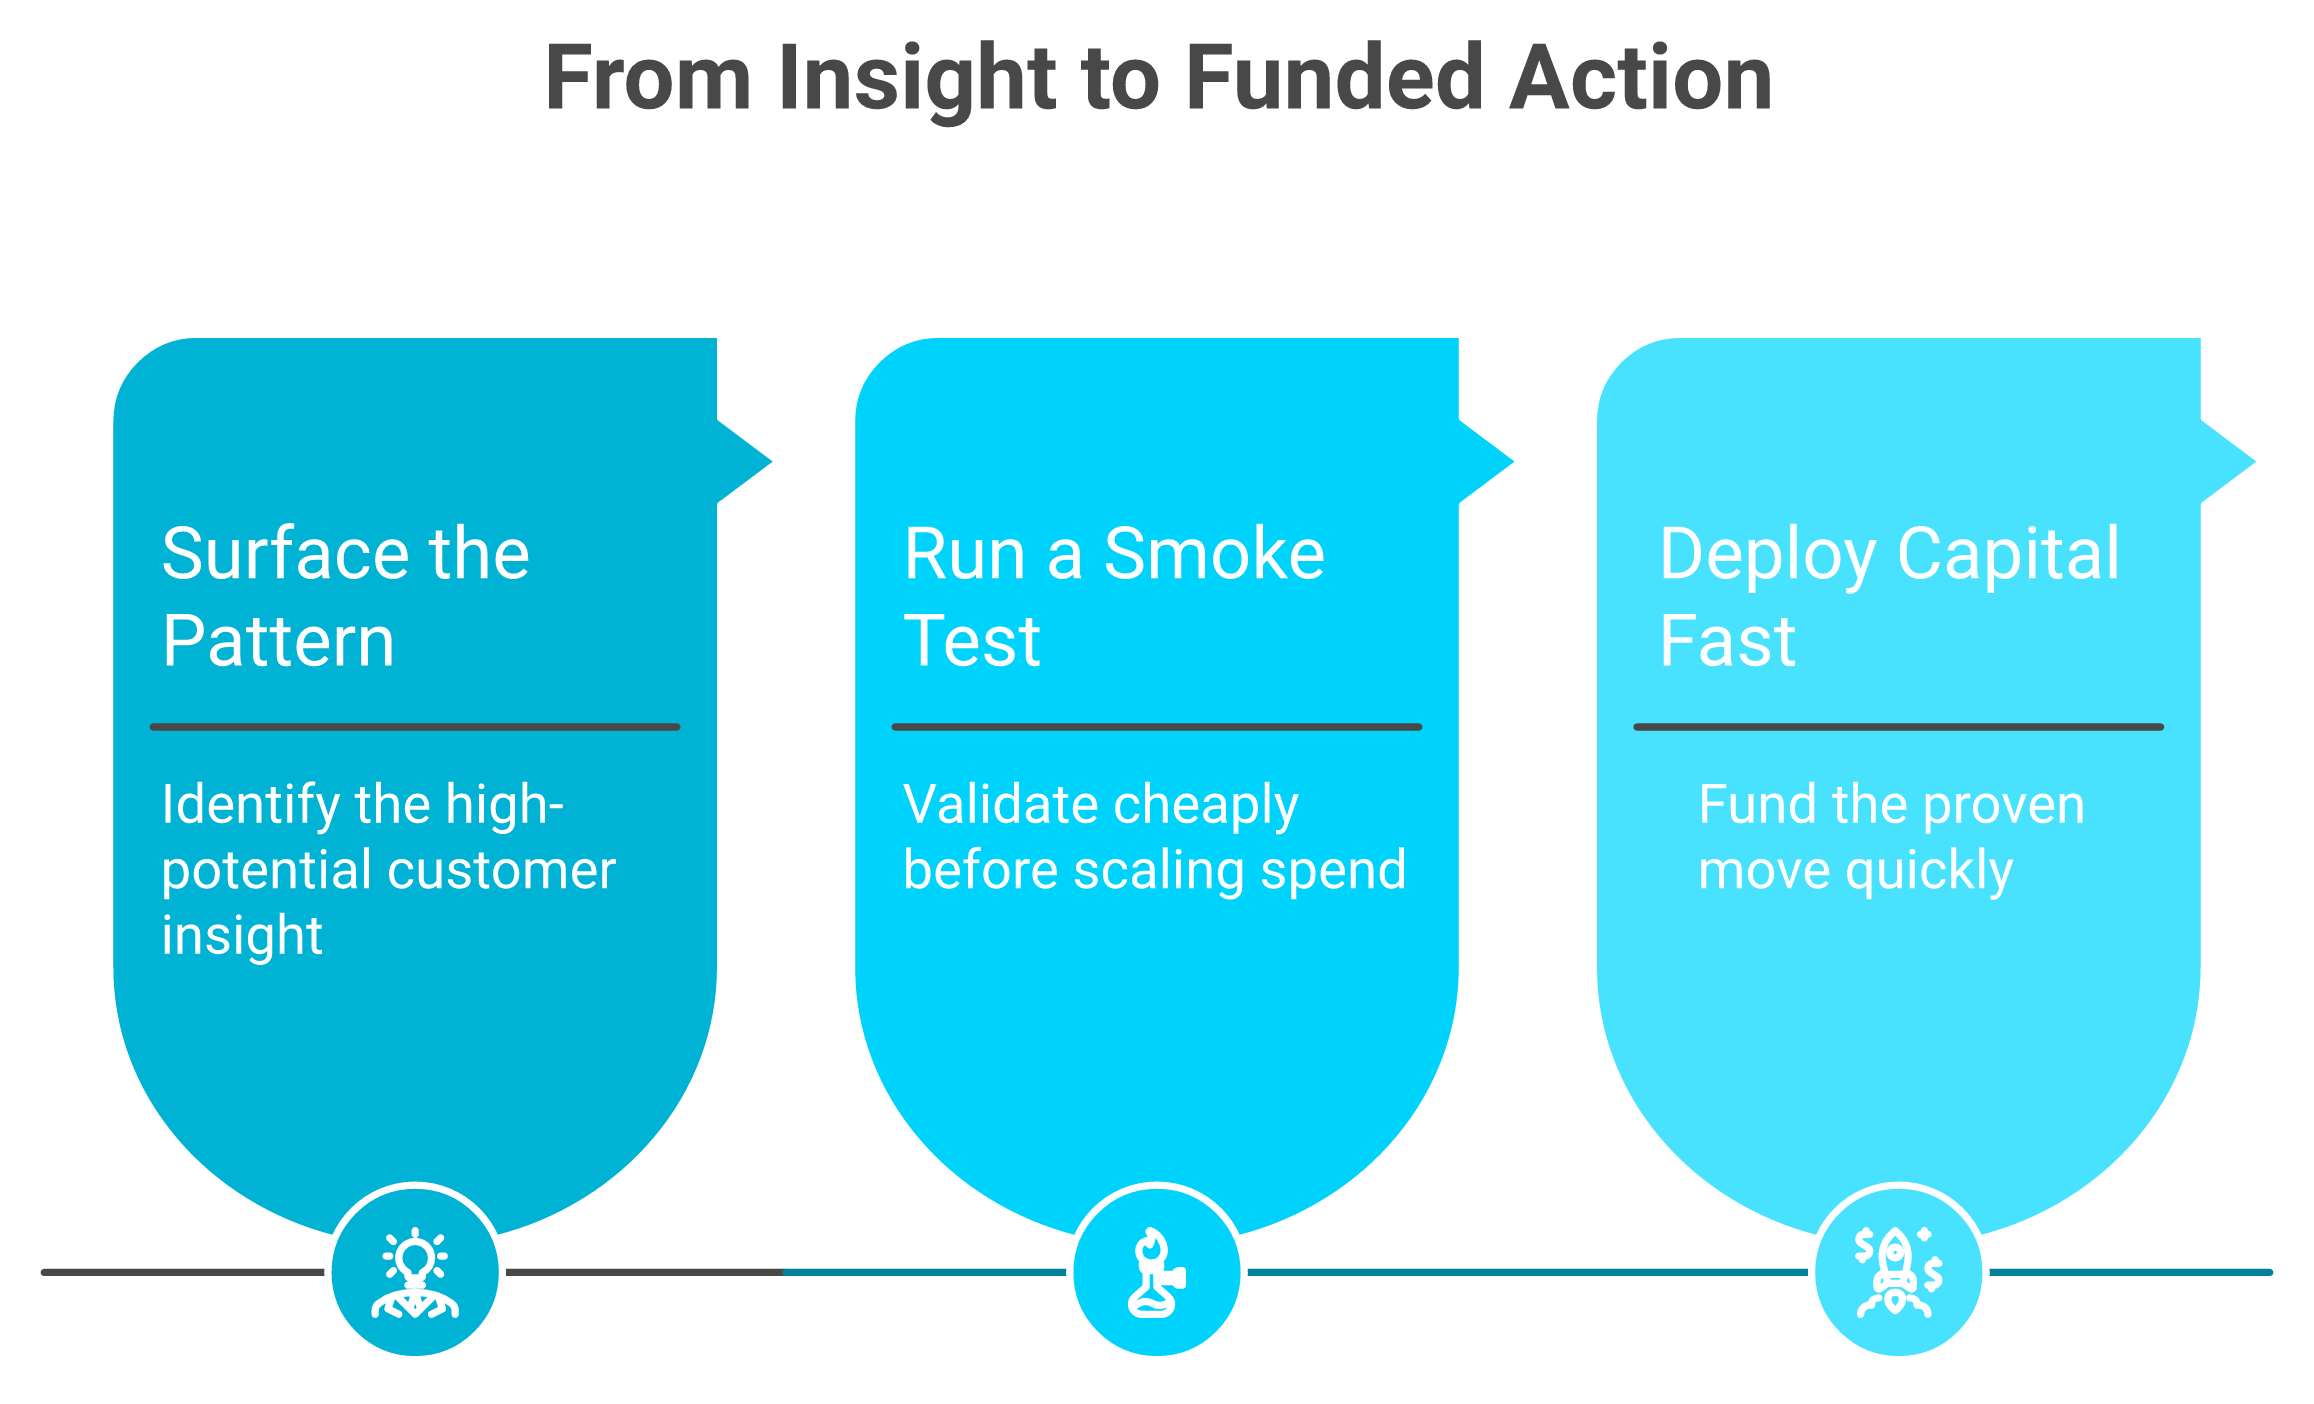
Before you fund anything at scale, run the cheapest possible test. A small ad set, a single email segment, or a limited inventory buy.
This is one of the simplest, most overlooked systems for a Shopify brand. You earn the right to spend big by proving the insight small. Cash is real, finite, and probably already sitting in inventory right now, which is why funding to scale campaigns should follow proof, not precede it.
💸 The financing trap below $5M GMV
Here is the part the "revenue-based financing is founder-friendly" pitch hides. Below roughly $5M GMV, the experience often breaks at the worst moment. The receipts are everywhere, as we document in our list of Wayflyer alternatives.
"We signed a 3M loan deal, only for them to come back two weeks later saying our C-suite decided to focus on Amazon deals, slashing our funding to 1M. Then, months later, right as we hit our 5% EBITDA margin, they cut it again to 350K."
Xin Shui Uncapped Trustpilot Verified Review
"After being offered funding in writing with specific amounts and confirmation that the deal was approved, Wayflyer abruptly reversed their decision at the last minute."
Geoff Brand Wayflyer Trustpilot Verified Review
"I have used Wayflyer on a number of occasions... only to be told we no longer fit their criteria... no-one reached out to us sooner."
Joshua Hannan Wayflyer Trustpilot Verified Review
💰 Judge capital on capital metrics
When money is the question, judge providers on three things only: the rate you pay, how fast cash hits your account, and whether the approved terms actually hold. Pretty dashboards are irrelevant here.
This is where Luca AI competes directly: fast disbursal, transparent rates, and offers that do not get yanked the week you need them. Capital-backed insights mean you can fund the move without leaving the conversation, so the insight and the cash close the loop together.
Q9. What is the best ecommerce customer analytics stack for 2026, and when is GA4 enough? [toc=Best Stack 2026]
A founder asked me last week, "Just tell me the best tool." Wrong question. The honest answer nobody selling software wants to give is that there is no single best tool. There is a best stack for your stage.
GA4 is enough for sub-$50K-per-month stores that need directional traffic data. Scaling DTC brands need margin-aware, warehouse-level analytics, and most outgrow attribution-only tools because of integration and data-trust complaints. The 2026 shift is toward AI layers over the data warehouse that reason, predict, and prescribe, for operators who need decisions, not dashboards.
📊 The 2026 stack, by stage
Match the tool to where your business actually sits, not where you wish it sat. Our roundup of ecommerce analytics platforms goes deeper on each option.
⚠️ When GA4 is genuinely enough (and when it poisons you)
I will defend GA4 for early stores. If you just need to know which channel sends traffic, it is free and fine, and our walkthrough on Google Analytics for ecommerce covers the setup. The trouble starts at scale, when sampling estimates reality badly.
"Fine for Small Businesses, Poison for Enterprise... Google Analytics was telling us we had twice as much traffic as we actually do."
Gitai B., Web Analytics Lead Google Analytics G2 Verified Review
And attribution-only tools draw real complaints once data accuracy matters, a pattern we track in our list of Triple Whale alternatives.
"Broken Integrations, Fake Attribution for External Marketplaces... daily revenue totals are wrong, entire order blocks are missing."
XTRA FUEL Triple Whale Trustpilot Verified Review
Pricing friction is also real on the premium end.
"Disappointed with Customer Support... it is nearly impossible to speak with a real person."
Team All Fresh Seafood Northbeam Trustpilot Verified Review
🧠 The category shift, stated honestly
Here is my read, and I will own the bias. Most analytics tools added AI as a feature. Luca AI is AI, an engine built to reason over your warehouse, not a chatbot bolted onto a dashboard.
I will also be straight about fit. If you are a sub-$50K-per-month pre-traction store, Luca is overkill; use Shopify-native and grow into the rest. The right stack is the one matched to your stage, not the one with the loudest pitch, which is the same logic behind our ecommerce tech stack guide.
Q10. Your Monday-morning ecommerce customer analytics workflow [toc=Monday-Morning Workflow]
Most articles end with a summary. I would rather hand you something to do before your coffee gets cold. Here is the exact sequence I walk founders through when they are tired of flying blind.
Start here this week. Connect your order, product, ad, and finance sources into one normalized layer. Build a six-metric scorecard led by contribution margin and LTV, not revenue. Set sentry alerts for cohort retention and ROAS thresholds. Run one smoke test on your highest-potential insight. Define the decision rule for when to deploy capital.
✅ The five-step starting checklist
Run these in order. Each step earns the next, and none of them require an analyst.
- Ingest and normalize. Pull Shopify, Meta, Google, and your finance data into one place, standardized on the way in. Plug in, ask, act.
- Build a six-metric scorecard. Lead with contribution margin and LTV. Add CAC payback, repeat rate, retention, and AOV. Drop vanity metrics.
- Set sentry alerts. Stop babysitting dashboards. Get pinged only when ROAS dips, CAC spikes, or inventory falls below threshold.
- Run one smoke test. Take your best insight and prove it cheaply before scaling spend. Your cash is finite; respect it.
- Define your capital rule. Decide in advance: at what proven return do you deploy capital, and how fast can you get it?
An optional advanced step, once those five are humming, is slotting your warehouse by SKU velocity to free trapped cash, a tactic tied to smart product management.
💬 What I am still sitting with
Here is the question I keep turning over for 2027. As reasoning engines get cheaper, does the junior data analyst role disappear, or does it move up into judgment work that AI cannot touch?
I do not have a clean answer yet. My current read is that the operators who win will pair an always-on reasoning layer with their own gut. If steps one and five feel impossible with your current stack, that is the exact gap Luca AI was built for. Tell me what you are building, and where you are flying blind, and let us pressure-test it together on a quick call.
References [toc=References]
Organized by source tier: real reviews first, then operator threads, then platform data.
Reviews
- Gitai B. "Fine for Small Businesses, Poison for Enterprise." G2, Nov 22, 2016. https://www.g2.com/products/google-analytics/reviews/google-analytics-review-198713
- Verified User in Retail. "Increasingly more modeled and less performance and fidelity." G2, Feb 14, 2024. https://www.g2.com/products/google-analytics/reviews/google-analytics-review-9233654
- Aman S., Performance Marketing Head. "Steep learning curve and complex reporting." G2, Dec 24, 2025. https://www.g2.com/products/google-analytics/reviews/google-analytics-review-12136867
- Matt Huttner. "Extremely frustrating and largely terrible." Trustpilot, 2026. https://www.trustpilot.com/reviews/698a294cc7d3432a68883eb4
- XTRA FUEL. "Broken Integrations, Fake Attribution for External Marketplaces." Trustpilot, Nov 10, 2025. https://www.trustpilot.com/reviews/6910c5dac0f413a9a5cc8adb
- Team All Fresh Seafood. "Disappointed with Customer Support." Trustpilot, Jan 21, 2026. https://www.trustpilot.com/reviews/6970d84d455eb78a577fb8f2
- Xin Shui. "Funding slashed from $3M to $350K." Trustpilot, Oct 2025. https://www.trustpilot.com/reviews/68e08525fc069875427a5248
- Geoff Brand. "Wayflyer abruptly reversed their decision at the last minute." Trustpilot, Oct 2025. https://www.trustpilot.com/reviews/68f73d58d18488d7a62a838b
- Joshua Hannan. "Told we no longer fit their criteria." Trustpilot, Oct 2025. https://www.trustpilot.com/reviews/68fb899c6a39671735b97f3d
Operator threads (Reddit)
- u/nu55mgg. "Keep it simple first, use Shopify's built-ins." r/ShopifyeCommerce. https://www.reddit.com/r/ShopifyeCommerce/comments/1pm0cz9/comment/nu55mgg
- u/o4hy5m7. "Spinning in circles and telling you it can do things that it can't." r/shopify. https://www.reddit.com/r/shopify/comments/1qzyq6y/comment/o4hy5m7
- u/nv1x5p0. "I tried getting it to build some category sales analytics, but it failed miserably." r/shopify. https://www.reddit.com/r/shopify/comments/1pldw7k/comment/nv1x5p0
Platform and secondary data
- BigCommerce. "Ecommerce Metrics and KPIs." 2026.
- Salesforce. "Ecommerce Analytics." 2026.

.webp)
.svg)
.webp)

.png)
