Channel Performance Analysis: How to Measure and Optimize Your Marketing Mix
mins read
TL;DR
Channel performance analysis ranks every channel on profit contribution using one metric set: contribution margin, CAC, MER, LTV:CAC, payback period, and revenue concentration.
Platform-reported revenue routinely exceeds settled revenue by 20 to 60 percent, so track a monthly reconciliation ratio instead of chasing perfect attribution.
Contribution margin starts at the order: subtract landed cost, storage, fulfillment, shipping, processing, returns, support, and that channel's CAC.
Judge awareness channels on new-customer CAC and branded search lift, and capture channels on coverage and cost per captured order.
Pre-commit evaluation windows of roughly 90 days for paid, 6 to 9 months for content, and 6 to 12 months for partner channels.
Price your measurement stack against net profit, not revenue, and cancel anything that has not changed a named decision in two months.
Q1. What is channel performance analysis, and what is it not? [toc=1. What It Means]
Channel performance analysis is the systematic comparison of every marketing channel by its contribution to profit, not clicks. You standardize one metric set across channels, usually contribution margin, CAC, MER, LTV:CAC, and payback period, then reallocate toward channels clearing your margin threshold. It is not reading Ads Manager channel by channel, and it is not customer-support channel reporting, which ranks for the same phrase.
🧭 The Sunday night version of this problem
Picture an operator selling woolen sweaters on Shopify. She does about $80,000 a month, mostly Meta, with a small Klaviyo list that quietly carries Q4.
It is Sunday night. She has Meta open in one tab, GA4 in another, and Shopify in a third. All three tell her a different story about the same two weeks, which is the exact problem ecommerce performance analytics exists to solve.
⚠️ Two different things share this keyword
Search the term and half the results are about support channels: email, chat, phone, and self-service ticket volume. Count's metric library and the Umbrex KPI library both rank on that reading.
That is a real discipline. It is just not yours. Your version asks a harder question, and one brief from a store owner put it plainly.
"How do I conduct a channel performance analysis across my marketing mix, reconciling Meta, Google, email, and organic channels, so I can evaluate true contribution margin per channel without getting lied to by self-attributing platform dashboards?"
📋 One metric set, applied the same way everywhere
The output of real channel analysis is a single ranked list. Every channel is scored on the same five lines, so you can compare paid social to email without arguing.
Contribution margin per order, revenue minus all variable costs including that channel's CAC
CAC, fully loaded, including agency fees and tooling
MER, total revenue divided by total marketing spend
LTV:CAC, measured on a fixed cohort window
Revenue concentration, what share one channel carries
💰 What the scorecard changes
The sweater store ran this and found email at a 7.4x return while Meta sat near 2.4x. The obvious move looked like shifting budget to email.
The real finding was different. Email was harvesting demand that Meta created, so cutting Meta would have shrunk both. That is the kind of mistake a shared metric set, built on the right ecommerce KPIs, catches early.
❌ What this analysis is not
Three things get confused with it constantly, and each one sends operators down an expensive path.
What Channel Performance Analysis Is Not
It is not
Why that matters
Reading each ad platform's dashboard
Every platform scores its own work, so totals overlap
Attribution modeling
Attribution assigns credit; this ranks profit
Channel-level optimization
Tuning a bad channel well still loses money
⏰ What I am skipping on purpose
I am not going to cover interest stacking, lookalike layering, or audience hacks. The algorithm already knows more about your buyer than your targeting does.
I am also not going to tell you which tool to buy. First you need a number you can defend. The rest of this article builds that number, then the decision rules that sit on top of it.
Q2. Why do your Meta, Google, and Shopify numbers never agree? [toc=2. Numbers Don't Reconcile]
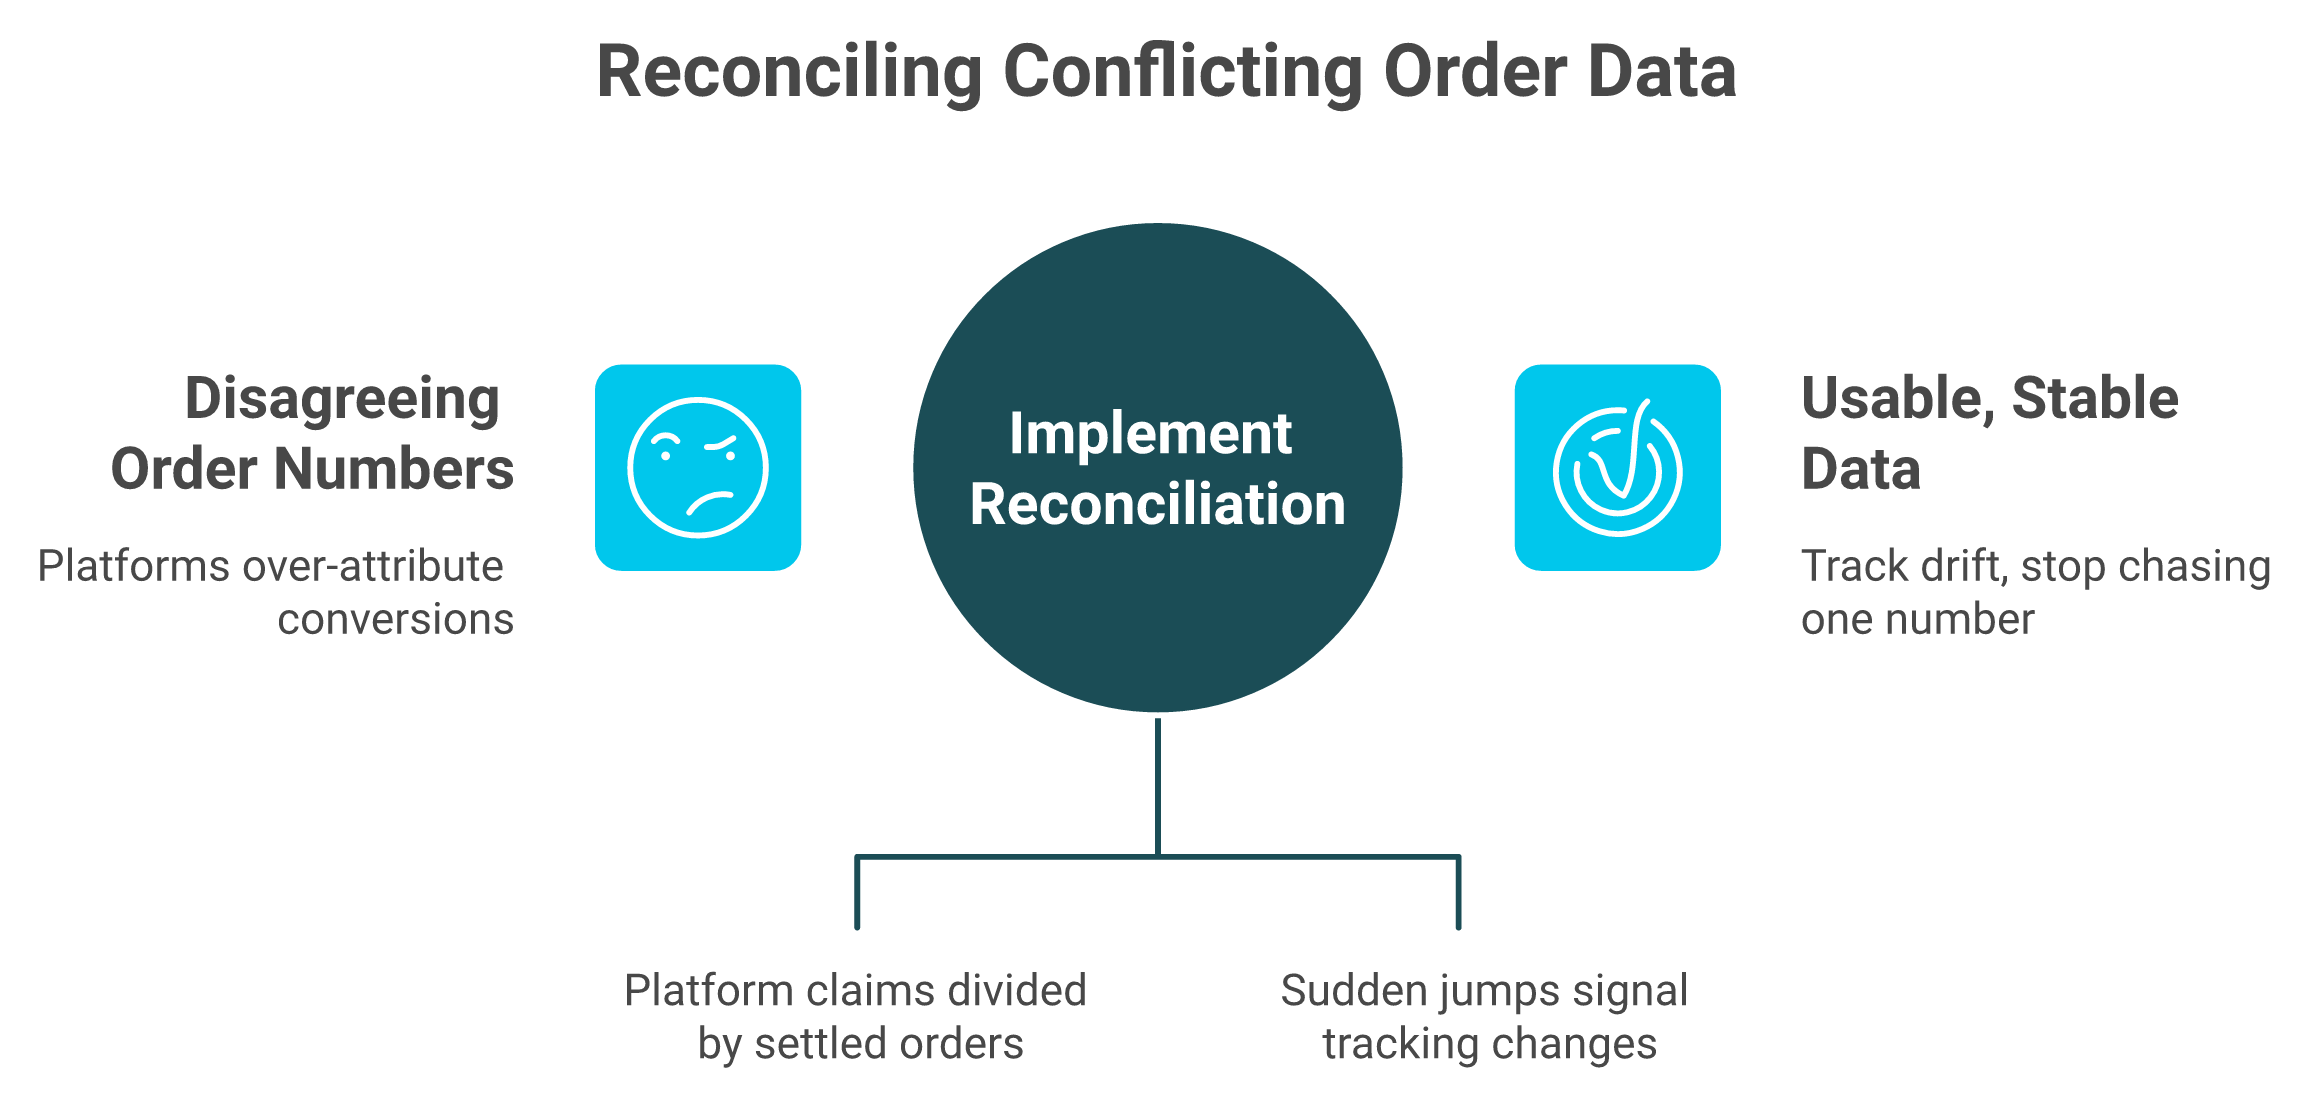
Because every platform marks its own homework. Meta claims any conversion it touched, GA4 defaults to last click, and Shopify records only what settled. A 20 to 60 percent gap between platform-reported ROAS and blended reality is normal, and 15 to 30 percent of orders land unattributed. The fix is arithmetic, not a better pixel: divide summed platform-attributed conversions by settled orders monthly. A 1.4 ratio means 40 percent over-claiming. A jump to 2.1 means a window or pixel changed, not that performance improved.
😤 The screen share every operator has done
One store owner recorded his own account and said the quiet part out loud.
"My amount spent is 3,000 but my purchase conversion value is only 1.6K. If you go over to my Shopify, look how much sales I've made. This figure is only like 20% of my sales, which is actually terrible."
He is not being gaslit by one bad platform. He is watching three systems answer three different questions and reporting them in the same column, which is why declining platform ROAS and true profitability have drifted apart.
🔍 Why the numbers diverge by design
Meta attributes any conversion in its window, even when email sent the buyer. GA4 defaults to last click in its attribution model settings, so it hands credit to whoever was last in line. Shopify only knows what cleared payment.
Ad platforms and analytics tools each score their own work. The settled-order number is the only one that cleared payment, which is why the reconciliation ratio beats chasing perfect attribution.
📊 This shows up in reviews, not just rants
Buyers of the big analytics platforms report the same gap, even when they like the product.
"Some data we still notice discrepancies between platforms, for example, tracking ads, and differences in the reported metrics like revenue. Triple Whale will attribute more revenue to the email that was sent out, but the platform will attribute more revenue to the SMS." — Verified User, Mid-Market Marketing, Triple Whale - G2 Verified Review, 4/5, April 20, 2023
"When we switched to an enterprise web analytics solution that does no sampling, we found that Google Analytics was telling us we had twice as much traffic as we actually do." — Gitai B., Marketing, Web Analytics, and Testing Lead, Google Analytics - G2 Verified Review, 1/5, November 22, 2016
⚠️ Windows break more than pixels do
Attribution window mismatch is the cheapest unforced error here. Research cited by Reddit for Business found that incorrect attribution windows can misattribute up to 73 percent of conversions.
Align click and view windows across platforms before you blame tracking. Then re-pull last month and compare again, ideally inside a single cross-channel analytics view.
✅ Stop chasing truth, start tracking drift
My position: reconciliation beats attribution for stores under roughly $5M. You will never make these three systems agree. You can make their disagreement stable and legible.
Log three numbers every month. Settled orders from Shopify, summed platform-attributed conversions, and the ratio between them.
📈 The ratio is the signal
A steady 1.4 is workable. You know platforms over-claim by about 40 percent, so you discount accordingly and move on.
A jump to 2.1 is the alarm. Something changed in a pixel, a window, or a feed, and your channel ranking is now wrong.
Luca AI is an AI layer over your store's data, not an attribution tool and not a replacement for one. It normalizes Shopify, ad platform, email, and accounting data on ingestion, so you ask for the reconciliation ratio in plain English and get back which source moved and when the drift started. That is the difference between ecommerce data integration and another dashboard.
Q3. Which measurement approach should you trust: attribution models, MMM, or incrementality tests? [toc=3. Attribution vs Incrementality]
Each answers a different question. Attribution models answer which touchpoints got credit, so use them for tactical in-channel decisions while knowing they only track clicks. MMM answers how much each channel contributed at the portfolio level, so use it for quarterly budget splits. Incrementality tests, geo holdouts, and pause tests answer the only question that matters for a kill decision: would this revenue have happened anyway. Luca AI reasons over already-collected store data to simulate spend changes and isolate which components moved margin, and it does not assign conversion credit to touchpoints.
🧪 The three approaches, side by side
Pick based on the decision in front of you, not on which one sounds most advanced.
Attribution Models vs MMM vs Incrementality Testing
Approach
Question it answers
Minimum to run it
Main failure mode
Attribution models
Which touchpoint got credit
A working pixel and consistent UTMs
Only sees clicks, overlaps across platforms
Marketing mix modeling
What each channel contributed overall
Two to three years of clean weekly data
Expensive, slow, over-trusted at small scale
Incrementality testing
Would this revenue exist anyway
One channel, two weeks, a holdout region
Needs enough volume for a clean read
Luca AI
What changed, why, and what a shift would do
Connected data sources
Reasons over history, does not assign credit
⚠️ Multi-touch attribution is not journey tracking
This distinction gets blurred in sales calls. One industry critique put it cleanly: multi-touch attribution tracks what customers click on and distributes that mathematically across campaigns, while customer journey analytics describes how a customer actually interacts with your brand.
So MTA is a budgeting input. It is not an understanding of your buyer. Treat it accordingly.
Operators notice the cost of the alternative too, which is paying for modeling they cannot interpret.
"You don't need to spend money on software. You can use R, for example, which is basically free and can do extremely advanced analyses." — Commenter, r/marketing Reddit Thread.
⏰ The two-week holdout any store can run
My read: if you are under $1M in revenue, do not buy MMM. Run one holdout a quarter on your largest-spend channel instead.
Pick two comparable regions with similar historical revenue
Hold spend flat in one, cut it to zero in the other
Run 14 days, no creative or budget changes elsewhere
Compare total settled revenue, not platform-reported revenue
Repeat on the next largest channel next quarter
✅ What to do with the result
If the dark region holds revenue, that spend was not incremental. If revenue drops sharply, you just priced the channel honestly for the first time.
Write the result down with the dates. One holdout is a data point. Four across a year is a measurement system, and that is where predictive analytics for ecommerce starts to earn its keep.
Luca AI sits in the layer after the test: it simulates a spend shift against your own history, isolates which components influenced a margin move, and flags areas already well optimized. Done with you, not for you. The decision and the execution stay yours.
Q4. Which metrics belong on a channel scorecard, and why are ROAS and CTR the wrong scoreboard? [toc=4. Metrics That Matter]
Use platform ROAS for in-platform tuning and MER for portfolio health, because MER survives long lead times, repeat purchases, and cookie loss. CTR proves attention, not margin. With median DTC contribution margin at 15 to 20 percent after shipping, processing, returns, and CAC, a 2.5x platform ROAS can still lose money per order. The scorecard that settles arguments: contribution margin per order, MER, blended CAC, LTV:CAC, payback period, and revenue concentration.
⭐ The claim, stated plainly
One operator with real scale put it harder than I would.
"You need to look at what's going on beyond ROAS because ROAS doesn't exist. Any media buyer that you have needs financial competence to see the real impact of ad dollars on profit. You want to know how much profit per order per day was made. CTR and ROAS are meaningless."
I would soften that slightly. ROAS is fine for deciding which ad to pause this afternoon. It is useless for deciding which channel deserves next quarter's money, which is a contribution margin question.
📉 Why ROAS broke, specifically
Three things happened. Platform self-attribution inflated the numerator, iOS tracking changes shrank observable conversions, and repeat purchase behavior started landing outside attribution windows.
MER absorbs all three because it uses total revenue and total spend. Nothing in that ratio depends on a pixel firing correctly.
Contribution margin and MER govern where budget goes. Platform ROAS belongs at the top of the stack, useful for tuning an ad and useless for allocating a quarter.
📋 Metric to question mapping
Each metric settles exactly one argument. Using the wrong one is how channel owners talk past each other.
Channel Scorecard Metrics and What Each One Settles
Hold your numbers against that before you declare a channel broken. Triple Whale's benchmarks dashboard, built on aggregated data from thousands of stores, lets you filter by industry and revenue tier for a closer comparison.
🧮 The LTV finding I did not expect
One operator analysis found product category diversity, not purchase frequency, was the leading driver of lifetime value. Customers who added a second category jumped 50 to 100 percent in LTV.
That changes which channel looks good. A channel that acquires cross-category buyers can carry a worse CAC and still win on customer lifetime value.
⚠️ Readable beats sophisticated
Operators abandon scorecards they cannot interpret, and reviews of the major platforms show it.
"I love how seamlessly it connects our ad platforms and CRM data, showing exactly where our conversions come from. Occasionally, metrics between sources need a quick manual check to ensure alignment." — Verified User, Marketing, Triple Whale - G2 Verified Review, 5/5, October 9, 2025
Luca AI answers the scorecard as a question rather than a build, including which metric moved and what moved it, so the six lines stay current without a weekly spreadsheet rebuild. That is what conversational analytics changes about reporting.
Q5. How do you calculate true contribution margin per channel? [toc=5. Contribution Margin Math]
Start at the order, not the channel. From revenue per order subtract landed cost, storage, pick-pack-fulfillment, shipping, payment processing, allocated returns, allocated support, then that channel's CAC. What remains is contribution margin. Most operators stop before the last three lines, which is why channels look profitable while the bank account disagrees. A $49.99 product carrying $71.30 of cost including $31 CAC loses $21.31 per order. Luca AI retrieves these cost lines from connected Shopify, ad platform, 3PL, and accounting sources, then reports margin per channel.
🧮 The eight lines nobody wants to add up
Here is a real unit economics build an operator shared, for a kitchen knife set selling at $49.99.
Full Unit Economics Build on a $49.99 Order
Line item
Amount
Revenue
$49.99
Landed cost
$17.75
Storage
$0.65
Pick, pack, and fulfill
$4.10
Shipping
$8.40
Payment processing
$1.75
Returns, allocated
$6.20
Customer service, allocated
$1.45
Customer acquisition cost
$31.00
Total cost
$71.30
Total cost exceeds revenue by $21.31. She was paying $21 for the privilege of each sale, which is exactly what tracking unit economics is supposed to catch.
💸 Where each number actually lives
The first six lines sit in three systems. Landed cost comes from your purchase orders or accounting tool, fulfillment and storage from your 3PL invoice, and processing from your payment statements.
Returns and support are the two most operators guess at. Use a trailing 90-day rate, not last month's, so one bad week does not distort the whole stack.
If your numbers sit far below those ranges, you have probably left a cost in overhead, which quietly flatters your ecommerce profit margins. Luca AI reads these lines from the sources already connected, so the stack refreshes without a rebuild.
⚠️ Allocating CAC when attribution is contested
This is the step that stalls people. You cannot assign CAC perfectly, so assign it defensibly and keep the method fixed.
Pull total spend per channel for the period, including agency fees and tooling
Divide by new customers acquired, using your own order data rather than platform claims
For channels without a clean new-customer count, use the spend-weighted share of new customers overall
Write the method down and reuse it every month
Correct the method with holdout results, not with intuition
✅ My position: CAC is a variable cost
One operator said it sharper than any accountant would.
"If you have to spend money to acquire a customer to sell that unit, it's a variable cost of that sale. You can argue about where it goes on the P&L, but you cannot make good decisions if you're not including it in your product level math."
I agree, with one caveat. For statutory accounts, your accountant may park marketing in operating expense, and that is fine.
⭐ Two sets of books, on purpose
Keep the accounting view for filings and a management view for decisions. The management view loads CAC into the order, which is the practical difference between contribution margin and gross margin.
Luca AI's read is that the standard advice gets this backwards: operators are told to simplify the P&L, when the per-order view is what actually changes a budget. I might be overweighting that, since the stores we see are mostly $1M to $5M, where a single bad channel can eat the quarter.
Luca AI sits over the warehouse where landed cost, fulfillment, support volume, and ad spend already live, so the margin stack is a retrieved and reasoned answer. Ask which cost line moved margin last month and it isolates the component instead of handing you six charts to compare.
Q6. How do you compare paid, organic, and email channels fairly? [toc=6. Paid vs Organic]
Load every channel with its fully loaded cost, then judge it on its job. Organic looks free until you add content salaries, SEO tooling, and agency fees. It usually looks expensive early and efficient once the fixed build cost amortizes. Awareness channels create demand, so judge them on new-customer CAC and branded search lift. Capture channels intercept demand someone else created, so judge them on coverage and cost per captured order. Scoring both on last-click ROAS guarantees you cut the wrong one.
🧾 Building the real cost of organic
Organic has no media invoice, so operators treat it as a rounding error. Then they compare its return to Meta and declare content a miracle.
Load it properly instead. Add the content salary or freelance spend, the SEO and design tooling, any agency retainer, and a share of your own time at market rate.
💰 What that does to the comparison
A store spending $4,000 a month on content and generating $18,000 in organic revenue is running a 4.5x return, not infinity. That is still good. It is just comparable now.
The shape matters too. Organic carries a heavy fixed cost early and gets cheaper as traffic compounds, while paid cost rises as you scale into worse audiences.
🎯 Awareness versus capture, and why it changes the KPI
One operator framing I use constantly: Meta is an awareness channel, because it puts your product in front of people who are not searching. Google Search is a capture channel, because it intercepts people already looking.
Judging both on last-click return is how good awareness channels get killed. The capture channel always wins that test, because it stands closest to the checkout, and a single omnichannel analytics view is the only way to see both jobs at once.
Channel Jobs and the KPI That Matches Each One
Channel
Its job
Score it on
Do not score it on
Meta, TikTok
Create demand
New-customer CAC, branded search lift
Last-click ROAS
Google Search, brand terms
Capture demand
Coverage, cost per captured order
New-customer share
SEO, content
Create and capture demand
Fully loaded cost per order, assisted revenue
First-click revenue alone
Email, SMS
Harvest and retain demand
Revenue per recipient, repeat rate
Standalone ROAS
⚠️ The leak most stores never notice
Here is the trap. You educate a buyer with a great guide, they leave, and weeks later they search the category on Google.
One operator described exactly that: customers get educated on the site, forget where they learned it, and then shop on Google where the brand is not bidding, or not bidding enough. Your content paid for a sale a competitor closed.
✅ The cheapest growth on this list
My read is that paying for the demand your own content created is the most underpriced move in DTC right now. Pull your top organic pages, list the terms they rank for, and check your paid coverage on those exact terms.
Run this before you change a single budget. It is the fastest fairness check I know.
Build the fully loaded cost for every non-paid channel
Assign each channel its job, awareness or capture
Score each one on the KPI that matches its job
Flag any channel scored on the wrong metric for the last quarter
Check paid coverage on terms your organic pages already rank for
Most stores find at least one channel they have been judging with the wrong ruler for a year.
Q7. What review cadence keeps a channel from lying to you for a full month? [toc=7. Review Cadence]
Three loops. Intraday, check spend against forecast and scale only when profitable, resetting at day end so tomorrow's audience does not inherit an inflated budget. Weekly, reconcile platform-claimed revenue against settled orders and refresh contribution margin by channel. Monthly, reallocate. Luca AI pushes scheduled CAC and margin reports to Slack, email, or in-app on a set cadence, and alerts when a metric moves outside a defined threshold. Hold every channel owner to a plus or minus 10 percent band on spend and revenue, and the ownership fights stop.
⏰ The intraday loop, and why the reset matters
One operator pattern I like runs four checkpoints. At 9am you look at spend against return and raise budgets only if the day is profitable.
Then 12pm, then 6pm, each a smaller step. At midnight you pull budgets back down near their baseline, because you have no idea whether tomorrow's audience will behave.
⚠️ When hourly reporting is overkill
Some teams run hourly. At one high-spend brand, buyers report every hour, seven days a week, on spend, return, and ending capital.
That is correct at $1M a month in spend. Below roughly $500,000 a month in revenue, hourly reporting mostly manufactures anxiety. Weekly reconciliation plus daily spend checks covers it.
📋 The weekly loop that catches drift
Weekly is where reconciliation lives. Three numbers, every Monday, no exceptions.
Settled orders and revenue from Shopify for the prior week
Summed platform-attributed conversions across every ad platform
The ratio between them, logged in the same sheet each time
Then refresh contribution margin per channel using your fixed CAC method. Luca AI can deliver that weekly CAC and margin report with the reasoning attached, so the loop does not depend on someone remembering, which is the whole promise of automated data reporting in ecommerce.
Three nested loops plus one accountability rule. The band is what ends the arguments about which channel drove the sale.
❌ Why dashboards alone break this loop
Operators who rely on a dashboard to run cadence end up babysitting the dashboard. Reviews of the major platforms show the pattern.
"Mobile limitations and the platform isn't a plug-and-play solution, it requires time and effort to learn its advanced features. There are instances that certain integrations are not yet fully functioning so you have to always check with Customer Support." — Charlene R., Head of Operations, HR & Culture, Polar Analytics - G2 Verified Review, 5/5, November 25, 2024
✅ The accountability band that ends the arguments
Cadence without accountability is just more meetings. One portfolio agency solved this with a rule rather than a dashboard.
Before: executives argued over whether to plan against a 50th or 75th percentile revenue target, while channel managers quietly buried underperformance. The turn: every manager was held to a plus or minus 10 percent band on both spend and revenue against forecast.
📈 What the band produced
After the rule, that portfolio held spend and revenue within 5 to 6 percent across the organization. The fights over who drove the sale faded, because the band became the scoreboard.
Set your bands monthly, per channel, on both lines. A channel owner who misses the band twice has a forecasting problem, not a luck problem, and that is a reporting cadence question before it is a staffing one.
Luca AI's agentic side covers the cadence a small team cannot staff: continuous monitoring, a scheduled weekly report with the components that moved margin, and an alert the moment a channel breaks its band. The analysis arrives without you opening anything. Deciding and executing stay with you.
Q8. Should you master one channel or diversify, and when does that answer flip? [toc=8. Concentration Risk]
Below roughly $30,000 a month, master one channel. Three paid channels at that scale buys incompetence in all of them. Above it, concentration becomes the bigger risk. Median DTC brands pull about 55 percent of revenue from one channel, and one account ban can remove the business. The flip point is a share number more than a revenue number: when a single channel crosses about half your revenue, the second channel stops being a distraction and becomes insurance.
⭐ The focus case, at full strength
The strongest argument for focus is attention, not budget. One operator put it directly: get genuinely good at one channel, tune it until it scales, then diversify.
Try everything at once and you end up mediocre at four things. I have watched stores split $20,000 a month across Meta, TikTok, Google, and a creator program, then wonder why nothing worked.
💸 Why thin spend fails
Each paid channel has a learning cost before it produces usable data. Spread thin, no channel ever exits that phase.
So below $30,000 a month, I would pick one acquisition channel and one owned channel. Meta plus email, or short-form organic plus email. That is the whole stack, and it keeps your ecommerce growth strategy narrow enough to execute.
⚠️ The fragility case, with numbers
The counter-argument is blunt, and operators who have been banned say it loudest: single-channel advertising is gambling, because one algorithm change or account suspension ends the growth engine overnight.
The data supports treating this as a tracked risk. The 2026 DTC benchmark compilation found median single-channel concentration at 55 percent of revenue, and noted Amazon-dependent sellers compressing 3 to 5 margin points a year.
📉 The pivot nobody plans for
One founder described paid social costs going vertical until the math stopped working. The brand moved to partner and B2B2C channels instead, and described going from high CAC to effectively zero CAC, with margin given to the partner instead.
That trade is real. You give up gross margin and gain stability. At a certain concentration level, that is a good trade.
✅ Make concentration a scorecard line
My position: stop treating diversification as strategy talk and make it arithmetic. One number, updated monthly.
Divide each channel's revenue by total revenue. When your largest channel crosses 50 percent, start building the second one, whether or not it feels urgent.
❌ What adding a channel actually costs
Nobody warns you about the data cost. Every new channel means another source to connect, reconcile, and trust, which is why ecommerce API integrations decide how fast you can launch one.
Operators run into this immediately.
"We've been attempting to get a handful of other data sources connected (ShipHero and Walmart at this moment) and the process has been long and drawn out because it can take up to a week to hear back from the Polar team." — Ben S., Director of Commercial Operations, Polar Analytics - G2 Verified Review, 4/5, September 30, 2025
"I've reported an issue with inventory levels, as our inventory is multiplied with 6, since we have 6 different shopify stores connected to the same warehouse. Not really rocket science. But it has taken them closer to 1,5 month, and I've still not received a solution." — Maja, Ecommerce Brand Operator, Polar Analytics - Trustpilot Verified Review, November 7, 2025
Budget for that friction before you launch channel number two. Luca AI connects store data sources natively and normalizes them on ingestion, which is the part that usually delays a channel launch.
Luca AI can hold revenue concentration as a standing threshold alert rather than a quarterly realization, pinging you when one channel's share crosses the line you set. That is the difference between finding fragility in a board deck and finding it in week two.
Q9. Once the analysis is done, do you scale, reallocate, or kill? [toc=9. Scale, Shift, or Kill]
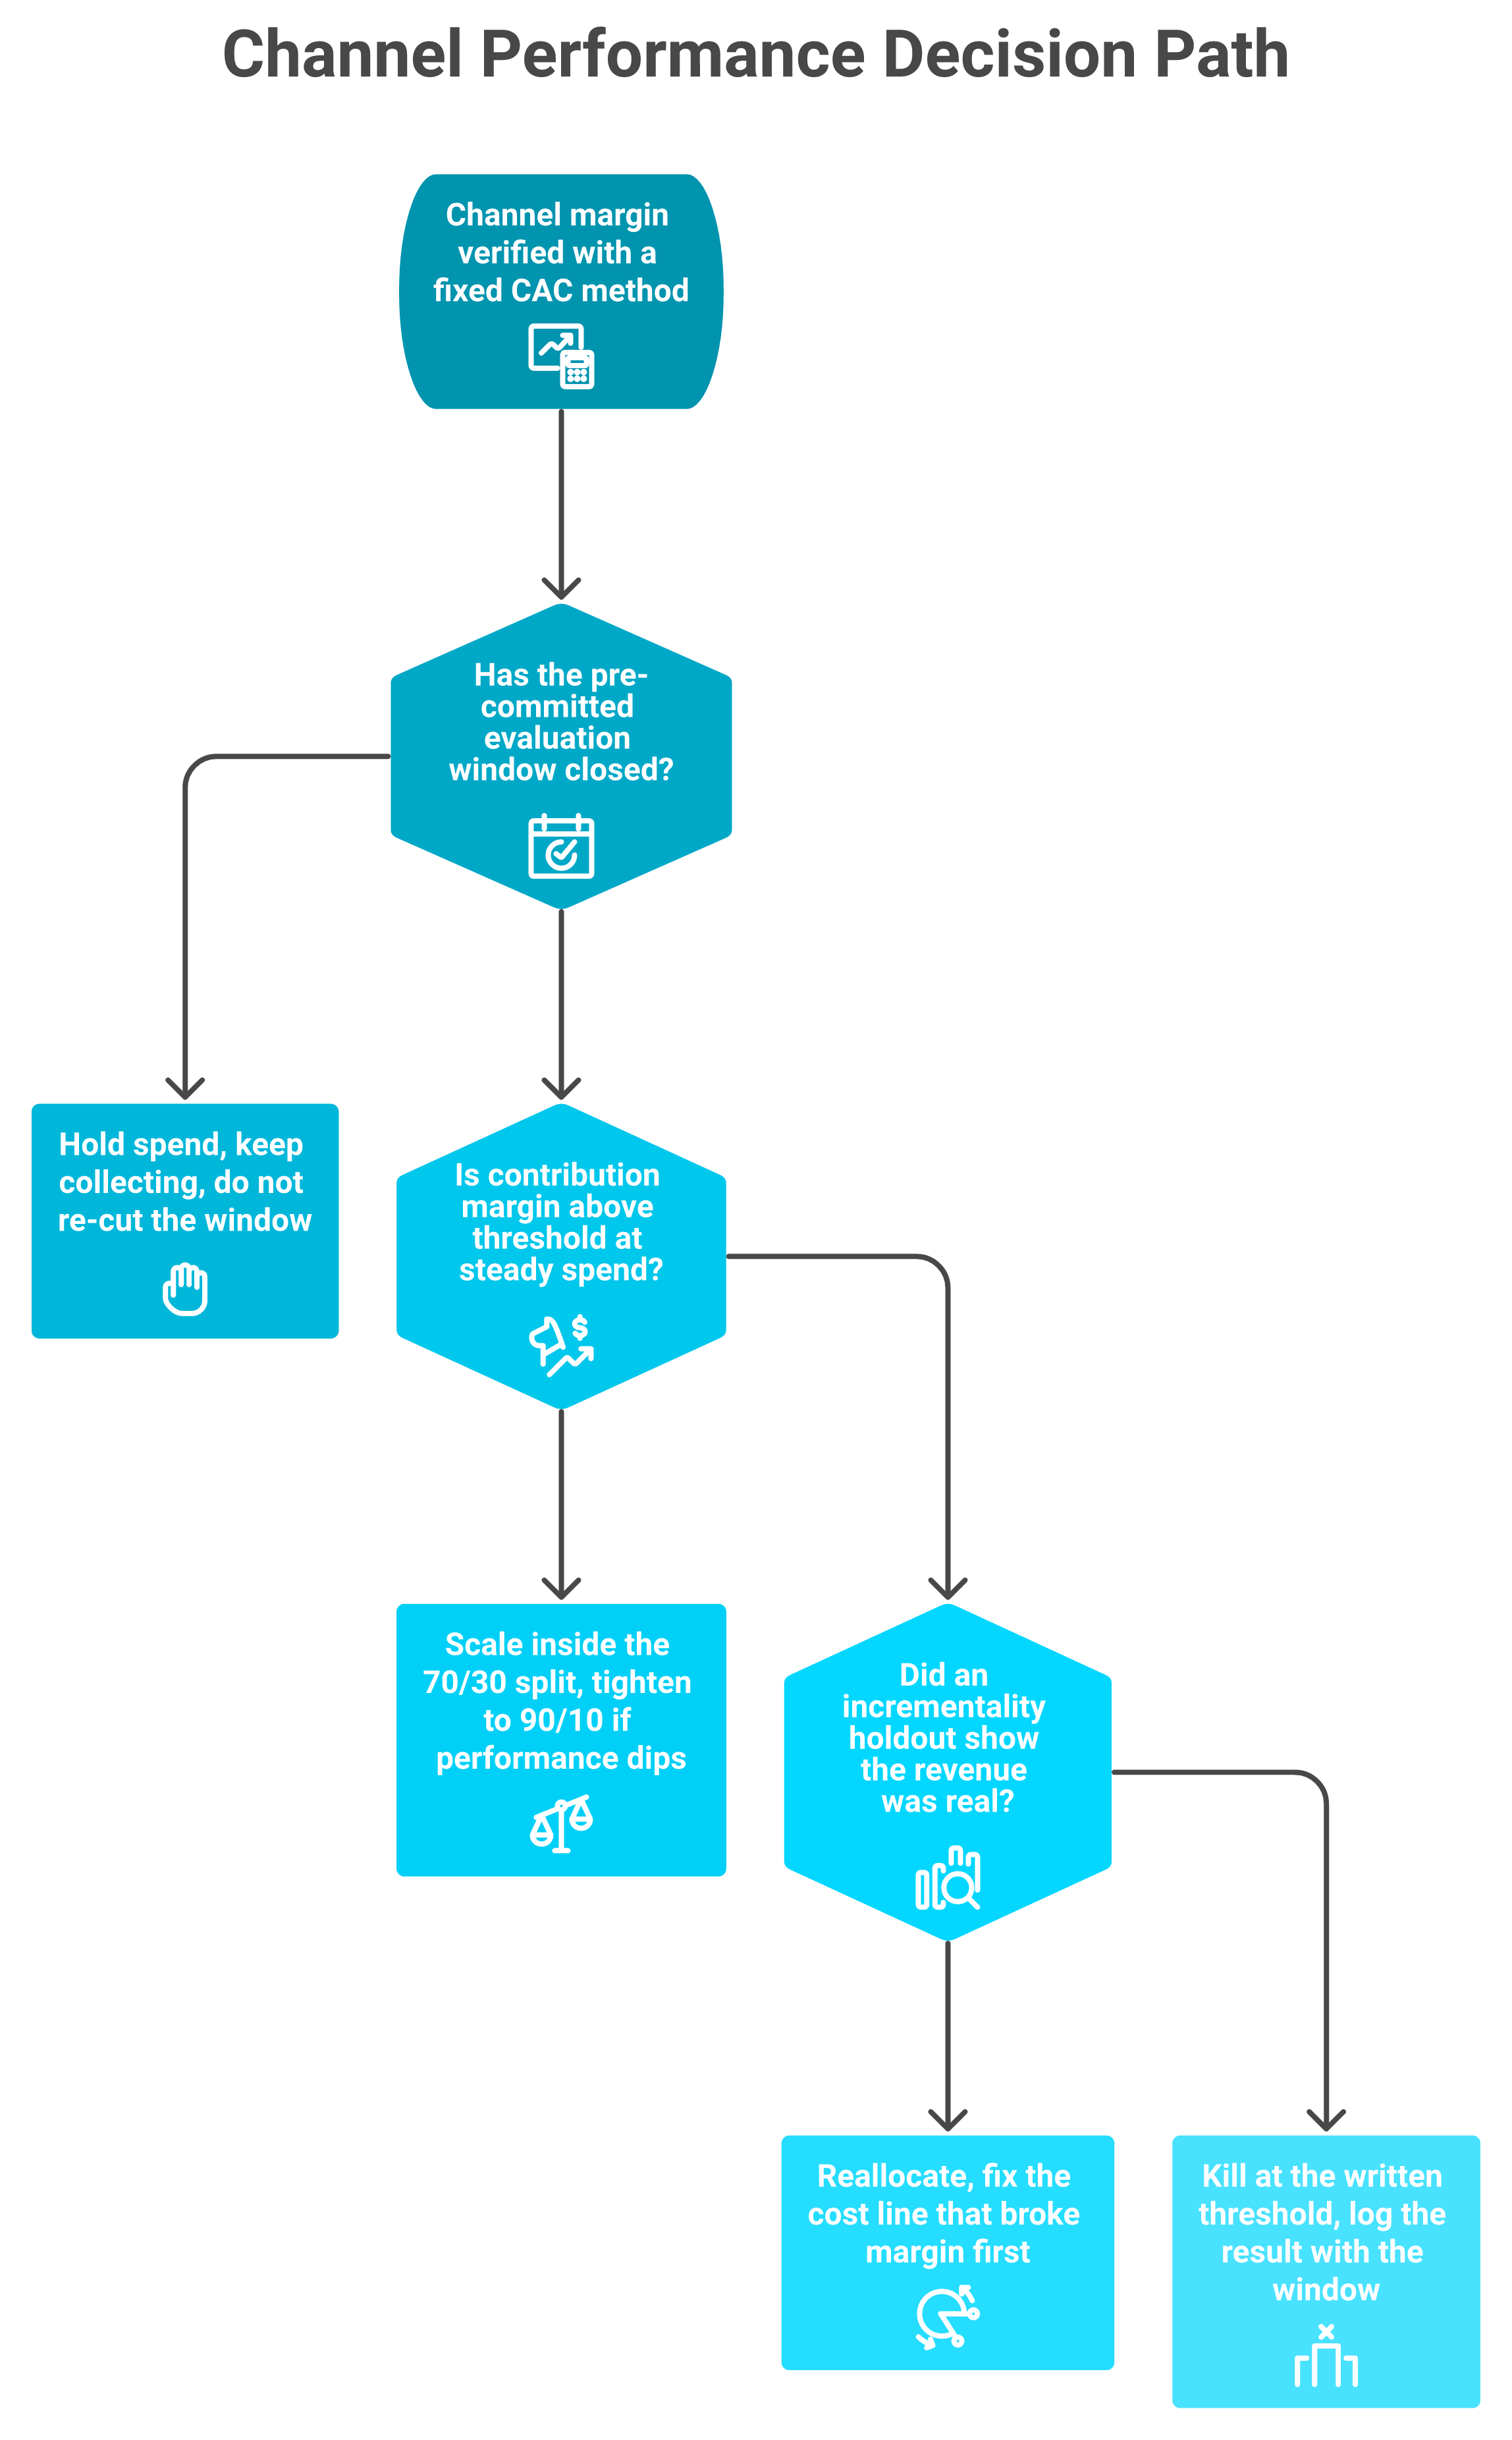
Decide on rules set before you look. Hold about 70 percent of spend on proven winners and 30 percent on cheap tests, tightening to 90/10 when performance dips. Treat contribution margin surplus as investment capital for longer-payback channels, not margin to bank. Pre-commit evaluation windows: roughly 90 days for paid, 6 to 9 months for SEO and content, 6 to 12 months for referral and partner. Luca AI simulates a proposed spend shift against a store's own historical data and identifies which cost and revenue components moved margin.
⏰ Write the windows down before you launch
Kill decisions go wrong because the window gets invented after the fact. Set it at launch, in writing, with the threshold attached.
Evaluation Windows and Kill Thresholds by Channel Type
Channel type
Evaluation window
What ends the test
Paid social, paid search
90 days
Contribution margin below threshold at steady spend
SEO, content
6 to 9 months
No ranking or assisted revenue movement
Referral, partner, affiliate
6 to 12 months
Partner volume below floor
Email, SMS
60 days
Revenue per recipient flat after list cleanup
💰 The 70/30 rule, and what it replaced
One brand's before state will sound familiar: $5,000 poured into a cinematic video ad that flopped, then performance collapsing again two weeks later when creative fatigued.
The turn was a portfolio rule. Seventy percent of budget on proven winners, 30 percent on cheap smoke tests, tightening toward 90/10 or 100/0 whenever performance dipped. That store scaled to roughly $5M a month across Meta, Google, TikTok, and influencers, which is the kind of decision loop decision intelligence tools are built to shorten.
Three questions decide the fate of every channel. Write the window and the threshold at launch so the flowchart, not the mood of the month, makes the call.
💸 What to do with a good month
Here is the move most operators miss. When contribution margin lands above forecast, the surplus is not margin to bank. It is investment capital.
One portfolio operator described allocating that excess into top-of-funnel and longer-payback channels specifically so next month's result is already underwritten. Luca AI can flag that surplus the week it appears, rather than at month end when it is already spent, which is a cash flow forecasting habit as much as a media one.
⚠️ Fixed annual budgets are the expensive habit
One agency team watched clients lock media spend into standardized annual windows regardless of market signal. Then they wired real-time weather and category velocity data into their reporting.
The result was a $50,000 opportunistic surge during European heatwaves, buying cheap impressions exactly when demand spiked. Signals move faster than planning cycles, and Luca AI monitors the store's data continuously so the signal arrives before the window closes. That is the practical case for ecommerce monitoring tools over quarterly reviews.
❌ Decide on reliable data, not convenient data
Kill and scale decisions amplify whatever data quality you had. Operators learn that the hard way.
"The free version is not reliable. Sessions are a vague statistic that do not help define the quality or quantity of your web traffic. Far too often, people rely on the free version as a main hub for their website traffic reporting, it's a mistake." — Verified User in Marketing and Advertising, Mid-Market, Google Analytics - G2 Verified Review, 0.5/5, August 1, 2018
My favorite reframe on this came from an operator running real volume: treat ad spend as an education budget, not rent money. Rent is survival. Education is a cost you plan for.
That brand spent $75,000 to $100,000 in its first quarter buying learnings before earnings. Scale the number to your store, but keep the principle. A test budget you did not plan is a loss. A test budget you planned is a research line.
Luca AI is where the reallocation question gets answered before the money moves: simulate a 20 percent shift from Meta to Google against your own history, see which components carry the margin, and get already-optimized areas flagged so you stop over-tuning them. The decision stays yours.
Q10. What does this measurement layer cost you, and when is it overpriced? [toc=10. Cost of Measurement]
Price it against net profit, not revenue. A $2,500 a month stack at $5M GMV is 0.6 percent of revenue but 7.5 percent of net profit at an 8 percent margin, and revenue-tied pricing grows fastest when margins compress. Some platforms need a 17.5 percent return lift at $1.5M revenue just to break even. Luca AI prices against the junior data analyst role it replaces, and fits operators with enough trading history to reason against rather than enterprises already running a data team.
💸 Run the percent-of-net-profit math
Revenue percentages make every tool look cheap. Net profit percentages tell you what you are actually giving up.
Analytics Stack Cost as a Share of Net Profit
Your revenue
Net margin
$2,500/month stack
Share of net profit
$1.5M
8 percent
$30,000/year
25 percent
$5M
8 percent
$30,000/year
7.5 percent
$15M
10 percent
$30,000/year
2 percent
At $1.5M, a quarter of your profit is going to visibility. That can still be correct, but only if the output changes decisions, which is the first question to ask of any ecommerce analytics platform.
⚠️ The breakeven question nobody asks in the demo
Published operator math on attribution platforms puts the breakeven lift at roughly 17.5 percent at $1.5M revenue, falling as you scale. Per-seat charges of $40 to $80 a month stack on top once your team grows past the included seats.
So ask it directly. What return improvement does this tool need to produce to pay for itself at my revenue? If nobody on the call can answer, that is the answer.
📋 Operators say the quiet part in reviews
Pricing complaints in this category cluster around two things: the quoted price changing, and support quality once you have paid.
"There were some discrepancy in the pricing. The pricing communicated when installing the app via Shopify was completely different from the one provided by sales after the installation (which was much higher). Nevertheless, the price is extremely high for a software like this." — Maja, Ecommerce Brand Operator, Polar Analytics - Trustpilot Verified Review, November 7, 2025
"The company is so lazy in their use of AI that Faizan J will use Mike S's email to send a pitch email to you addressing it to Mike, which isn't my name. If that is their modus operandi, how can you trust their results?" — Matthew Wong, Prospective Buyer, Polar Analytics - Trustpilot Verified Review, 1/5, May 21, 2025
💰 Consultants are the hidden line item
Software is rarely the whole bill. One brand described paying a digital marketing consultant between $5,000 and $15,000 a month to manage Google and Meta budgets.
The money was not the complaint. The debriefs were. The founder's summary of each meeting was a blunt "what did he just say?" Analysis you cannot act on costs full price and delivers nothing, which is the argument for self-service analytics over outsourced interpretation.
✅ The agency fee trade-off, stated fairly
Performance fees tie the agency to contribution margin, LTV, and CAC rather than hours. That alignment is real, and I generally prefer it.
The honest counter comes from agency operators: some creative will simply not perform, so pure performance fees can be unfair and tend to produce short relationships. A hybrid, modest retainer plus a margin-linked bonus, holds up better.
❌ The one test that settles it
Each month, name the decision the output changed. A budget shift, a kill, a restock, or a price change.
If you cannot name one for two months running, cancel it. Luca AI's read is that most stores at $1M to $5M are not underserved by tooling; they are overserved by analytics dashboards nobody reads.
Luca AI prices against the junior analyst you would otherwise hire to pull these numbers, which is the honest comparison for this line item. It does not fit enterprises with a data team, or stores too early to have usable history. Say that out loud before buying anything here.
Q11. You found the profitable channel and you are out of cash. What are your funding options? [toc=11. Funding the Winner]
Compare on four numbers only: total cost of capital expressed as an annualized rate rather than a flat fee, time from application to funds landing, repayment structure (fixed instalment versus revenue share), and what the lender takes security over. A cheap-impression window closes in days, so a facility quoting a low fee but funding in three weeks costs more than its headline rate. Luca AI surfaces capital options as an output of the store's own trading data, with terms quoted per store rather than by revenue band.
💰 The four-metric comparison
Ignore the marketing. Put every option in one table and fill all four columns before you sign anything.
Growth Capital Options Compared on Cost, Speed, and Security
Option
Typical cost basis
Time to funds
Repayment and security
Luca AI capital access
Quoted per store from connected trading data
Stated upfront in the quote
Confirm structure and security in writing
Revenue-based finance
Flat fee on the advance
Days to weeks
Share of daily or weekly revenue
Card-sales advance
Factor rate
Often days
Fixed percentage of card receipts
Inventory or PO facility
Rate plus fees
Weeks
Secured against the inventory
Bank line of credit
Annualized interest rate
Weeks to months
Often personal guarantee
⚠️ Flat fees hide the real rate
A 6 percent flat fee repaid over four months is not 6 percent. Annualized, it is far higher, because you repay principal continuously while the fee stays fixed. The mechanics are worth reading in full before you compare quotes on revenue-based financing.
Always convert to an annual rate before comparing. Ask for the total dollars repaid, the expected repayment period, and the effective annual rate in writing.
⏰ Disbursal speed is part of the price
This is the number operators underweight. If your analysis says a channel is clearing margin and impressions are temporarily cheap, capital arriving three weeks later funds a different, worse opportunity.
One agency team priced a $50,000 heatwave surge precisely because they could move while the window was open. Slow money is expensive money, even at a good rate, which is why speed belongs in any funding provider comparison.
❌ Get the terms in writing, including from me
I want to be straight about evidence here. The approved review set I work from contains no verified first-hand reviews of revenue-based financing providers, so I am not going to characterize their terms from memory.
What the review record does show is that quoted pricing and actual pricing diverge often enough to assume nothing.
"The pricing communicated when installing the app via Shopify was completely different from the one provided by sales after the installation (which was much higher)." — Maja, Ecommerce Brand Operator, Polar Analytics - Trustpilot Verified Review, November 7, 2025
✅ The five questions to send every provider
Send these by email, not on a call, so you have the answers on record.
What is the total amount repaid, and the effective annual rate?
What is your median time from application to funds landing?
Is repayment a fixed instalment or a share of revenue?
What security or personal guarantee is required?
What happens if revenue drops 30 percent next quarter?
💸 When not to borrow at all
Do not fund a channel whose margin you have not verified with the method in the earlier sections. Capital applied to an unprofitable channel just accelerates the loss.
And if your contribution margin surplus can fund the move, use that first. Cheapest capital in your business is the margin you already earned, a point worth revisiting alongside your cash flow forecasting tool.
Luca AI's capital access sits downstream of the intelligence, not beside it: the store's own connected data informs what is offered, and the terms are quoted per store rather than from a flat revenue-band multiple. Hold it against any other quote on rate and days-to-funds. That is the only fair test.
FAQ's
What is channel performance analysis, and how is it different from reading your ad platform dashboards?
Channel performance analysis is the systematic comparison of every marketing channel by its contribution to profit, not by clicks or platform-reported return. You apply one standard metric set across all channels, then reallocate budget toward the channels clearing your margin threshold.
The difference from dashboard reading is structural:
Dashboards score their own work. Each ad platform claims conversions it touched, so the totals overlap and sum to more than your deposits.
Analysis uses one ruler. Contribution margin per order, CAC, MER, LTV:CAC, payback period, and revenue concentration, applied identically to paid social, search, email, and organic.
The output is a ranked list, not six separate reports you mentally average at 11pm on a Sunday.
It is also not customer-support channel reporting, which ranks for the same phrase but measures ticket volume across email, chat, and phone.
Luca AI sits over a store's connected data and answers these questions in plain English, which is a different job from attribution. We built it as an ecommerce performance analytics layer: it retrieves the relevant slice of your data, explains what moved, and names the component responsible, rather than displaying another chart for you to interpret.
Why do Meta, Google Analytics, and Shopify report completely different revenue numbers?
Because each system answers a different question and scores its own work. Meta attributes any conversion inside its window, GA4 defaults to last click, and Shopify records only what actually settled.
A 20 to 60 percent gap between platform-reported return and blended reality is normal after iOS tracking changes, and 15 to 30 percent of orders typically land in direct or unattributed. Chasing a single true number is wasted effort.
What works instead is arithmetic you repeat monthly:
Pull settled orders and revenue from Shopify for the period.
Sum platform-attributed conversions across every ad platform.
Divide the second by the first and log the ratio.
A steady 1.4 means platforms over-claim by about 40 percent, so you discount consistently. A jump to 2.1 means a pixel, feed, or attribution window changed, and your channel ranking is now wrong.
Luca AI normalizes Shopify, ad platform, email, and accounting data on ingestion, so the ratio is a question you ask rather than a spreadsheet you rebuild. It is explicitly not an attribution pixel and does not replace one. If reconciling platform claims against banked revenue is your weekly pain, our breakdown of declining platform ROAS versus true profitability covers the mechanics in depth.
Should I optimize for ROAS or MER when comparing channels?
Use platform ROAS for in-platform tuning and MER for portfolio health. They answer different questions, and treating them as interchangeable is how channel owners talk past each other.
Platform ROAS tells you which ad or campaign to pause this afternoon. It overlaps across platforms and inflates totals.
MER is total revenue divided by total marketing spend. It survives long lead times, repeat purchases, and cookie loss, because nothing in that ratio depends on a pixel firing.
Contribution margin per order is the tiebreaker. With median DTC contribution margin at 15 to 20 percent after shipping, processing, returns, and CAC, a 2.5x platform return can still lose money per order.
The diagnostic worth running: if MER falls while every channel's reported ROAS looks healthy, your platforms are double-counting the same orders.
Luca AI reasons across spend, revenue, and cost lines together, so the answer to "which channel actually cleared margin last month" arrives with the component that moved it attached. We think most stores under $5M get further by fixing their metric hierarchy than by buying more precision, and our guide to the ecommerce KPIs worth tracking sets out the full scorecard.
How do I calculate true contribution margin for each marketing channel?
Start at the order, not the channel. From revenue per order, subtract every variable cost, then that channel's acquisition cost:
Landed product cost
Storage
Pick, pack, and fulfillment
Shipping
Payment processing
Allocated returns, using a trailing 90-day rate
Allocated customer service
Customer acquisition cost for that channel
Most operators stop before the last three lines, which is why channels look profitable while the bank balance disagrees. One real build: a $49.99 product carrying $71.30 of total cost, including $31 CAC, lost $21.31 on every order.
For CAC allocation, perfection is unavailable, so be defensible and consistent. Take total channel spend including agency fees and tooling, divide by new customers from your own order data, and keep the method fixed month to month. Correct it with holdout test results, never with intuition.
Treat CAC as a variable cost of the sale, not overhead. Your statutory accounts can park marketing in operating expense; your management view cannot.
Luca AI pulls landed cost, fulfillment, support volume, and ad spend from already-connected sources, so the margin stack refreshes without a rebuild. If the distinction trips up your team, start with contribution margin versus gross margin.
How long should I run a channel before deciding to scale or kill it?
Set the window before you launch, in writing, with the kill threshold attached. Windows invented after the fact always flatter whichever decision you already wanted.
Reasonable defaults:
Paid social and paid search: about 90 days, ending if contribution margin stays below threshold at steady spend.
SEO and content: 6 to 9 months, ending if neither rankings nor assisted revenue move.
Referral, partner, and affiliate: 6 to 12 months, ending if partner volume stays below your floor.
Email and SMS: 60 days, ending if revenue per recipient stays flat after a list cleanup.
Two rules make those windows affordable. Hold roughly 70 percent of spend on proven winners and 30 percent on cheap tests, tightening toward 90/10 when performance dips. And budget early spend as an education line rather than rent, because unplanned test spend reads as loss while planned test spend reads as research.
Before the money moves, pressure-test the shift. Luca AI simulates a proposed reallocation against your own trading history, isolates which components carry the margin, and flags areas already well optimized so you stop over-tuning them. Decisions and execution stay with the operator. Our work on predictive analytics for ecommerce explains how that simulation reads historical patterns.
Enjoyed the read? Join our team for a quick 15-minute chat — no pitch, just a real conversation on how we’re rethinking Ecommerce with AI - Luca
Loading Schedule...
Your AI Co-Founder is here.
Here’s why:
Shopify, Meta, Xero - one brain.
"Should I scale?" Answered with real data.
Growth capital. No applications. One click.
Thank you! Your submission has been received! Please book a time slot for the Meeting
Oops! Something went wrong while submitting the form.