8 Best Decision Intelligence Tools for Ecommerce - AI Native and Ecommerce-Specific Tools Covered
14
mins read
TL;DR
The eight tools covered are Luca AI, Triple Whale, Polar Analytics, Daasity, Prescient AI, Peel Insights, Tellius, and Pecan AI, scored on five weighted criteria.
Decision intelligence differs from BI by one test: the session ends with a decision you can approve, not a chart you still have to interpret.
Enterprise platforms run roughly $225,000 to $1,225,000 per year fully loaded, while ecommerce tools sit between $99 and $1,899 per month.
Four decisions carry the money: channel budget split, reorder quantity per SKU, price and promo depth, and retention spend by cohort.
Gross margin is the wrong input. One founder scaled a product at 72% gross margin that carried only 8% contribution margin.
Pilot in 30 days: connect sources, replay last quarter's decisions blind, run live inside guardrails, then score margin impact against cost.
Q1. What Are the 8 Best Decision Intelligence Tools for E-commerce in 2026? [toc=1. The 8 Tools]
The 8 best decision intelligence tools for ecommerce in 2026 are Luca AI, Triple Whale, Polar Analytics, Daasity, Prescient AI, Peel Insights, Tellius, and Pecan AI. Luca AI leads because it sits as an AI layer over your connected store data, pulls the exact slice that answers your question, finds the root cause and the influencing metrics, then pushes the recommendation to Slack or email.
Most operators I talk to do not lack data. They lack a decision. A founder doing $300K a month can name their MER but cannot tell me why last month's contribution margin slipped four points without opening four exports on a Sunday night. That gap is what decision intelligence software is supposed to close, and only some of these eight actually do it. Below is the list, the pricing, and who should skip each one.
🧾 The shortlist
Luca AI, Best for cross-functional store intelligence and plain-English root cause analysis
Triple Whale, Best for DTC marketing attribution and blended ROAS
Polar Analytics, Best for Shopify-native reporting without a data team
Daasity, Best for omnichannel warehouse builds and fully loaded contribution margin
Prescient AI, Best for media mix modeling and forward-looking spend decisions
Peel Insights, Best for cohort and retention analytics on Shopify
Tellius, Best for AI-native automated root cause across any dataset
Pecan AI, Best for predictive modeling without hiring data scientists
📊 Side-by-side comparison
Decision Intelligence Tools for E-commerce Compared (2026)
Tool
Key capabilities offered
Best For
Pricing
Luca AI ⭐⭐⭐⭐⭐
200+ native connectors, plain-English querying, root cause and influencing-metric detection, predictive reorder and sales forecasts, scheduled agentic reports to Slack, email, or app
$1M to $5M revenue stores with piling data and no analyst
Data teams needing DI across non-ecommerce datasets too
Custom quote
Pecan AI ⭐⭐⭐
Predictive modeling on raw tables, churn and LTV prediction, no-code model deployment
Teams with clean warehouse data and a modeling use case
Custom quote
1.1 Luca AI [toc=1.1 Luca AI]
Luca AI executes approved actions on ads, flows, pricing, and reports inside guardrails you set
⭐ Why did we choose this tool?
I built Luca AI, so I will be direct about why it sits first. Luca AI is the only tool on this list that reasons across marketing, sales, product, profit, customer, and operations data in one place, instead of owning a single channel view. Ask it why margin dropped, and it names the influencing metrics, not just the chart. It runs 24/7 and pushes what changed, which is closer to a junior analyst than a dashboard. If you want attribution modeling as your primary job, Triple Whale suits you better.
🔧 Solutions offered
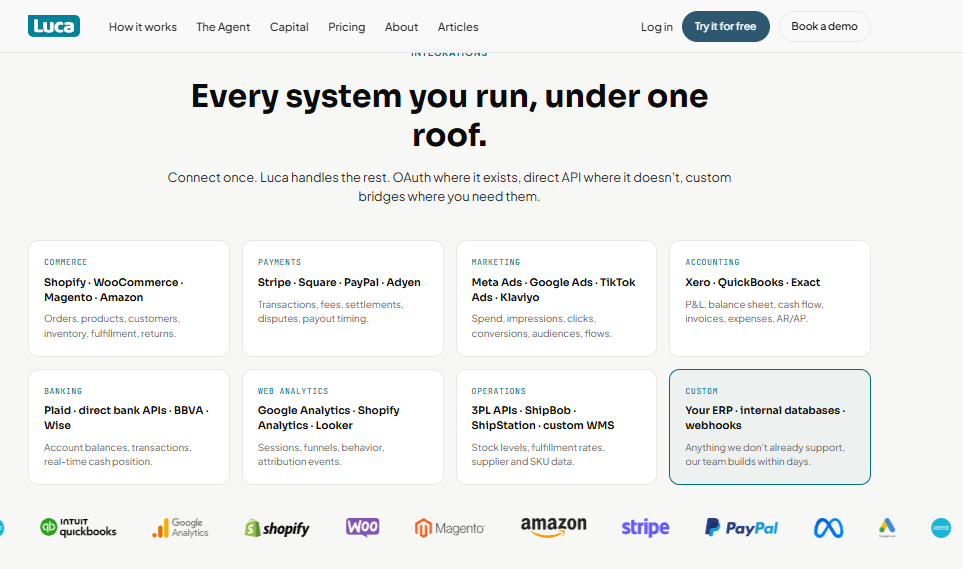
Connectors: 200+ native sources including Shopify, Meta, Google, and Klaviyo, covering ecommerce data integration end to end
Querying: plain English, no SQL, no dashboard building, no analyst
Intelligence: root cause analysis, influencing components, and outlier detection
Prediction: reorder alerts, sales forecasts, and product-level analytics
Agentic reporting: weekly or monthly reports with reasoning to Slack, email, or app
💰 Pricing
[ Starter, €299 / Month | Growth, €499 / Month | Scale, Custom Pricing ]. Current tiers are listed on the Luca AI pricing page.
😊 Best for
Shopify and multi-channel stores in the $1M to $5M revenue band.
Teams with no data analyst and no appetite for a warehouse project.
Operators whose data is already piling up across eight or more tools in their ecommerce tech stack.
📈 Case study
What was the problem: A European skincare brand, roughly €2.4M annual revenue, sold across Shopify and Amazon. Their reorder decisions lived in one spreadsheet, rebuilt by the founder every Sunday. Returns sat in a separate system, so margin by SKU was always a guess.
How Luca AI helped: Luca AI connected Shopify, Meta, Google, Klaviyo, and their accounting stack, then normalized the data on ingestion. We set two standing tasks: a weekly margin report with reasoning, and threshold alerts on stock and CAC, the kind of automated data reporting that removes the manual pull.
What was the outcome: The Sunday spreadsheet stopped. Reorder timing moved to an alert instead of a hunch. Two SKUs the team believed were profitable turned out to carry most of the returns cost, and both were repriced within a month.
1.2 Triple Whale [toc=1.2 Triple Whale]
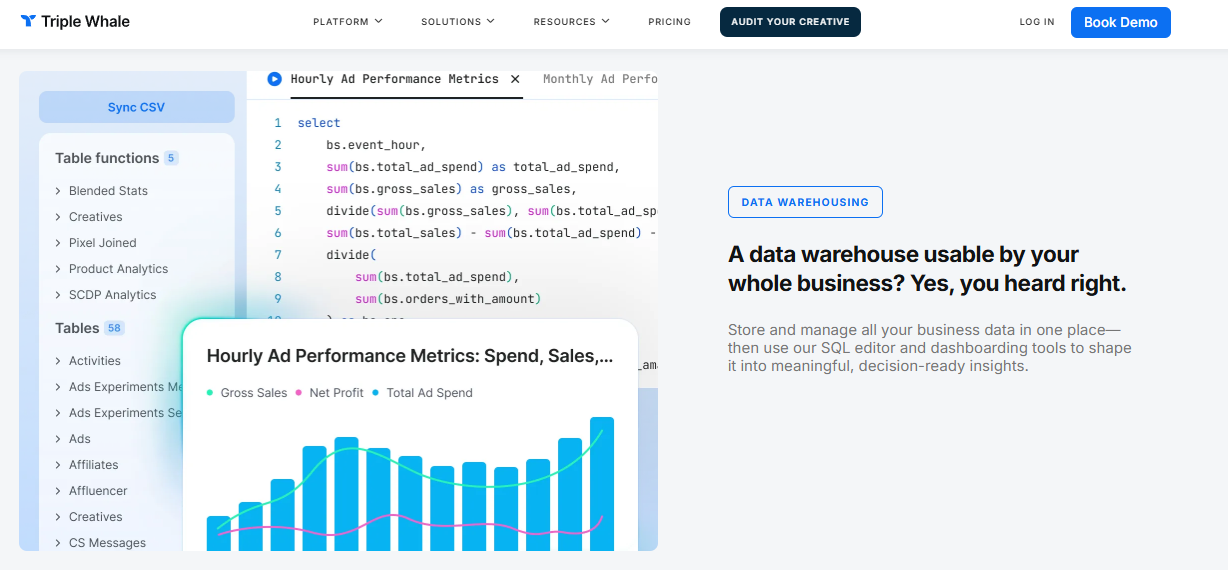
Triple Whale adds a queryable warehouse, though SQL work still lands on your team
⭐ Why did we choose this tool?
Triple Whale earned its place because it solved a real problem well. Its first-party pixel gives paid media teams a view that platform reporting cannot, and blended ROAS plus MER in one screen changed how DTC teams budget. Moby, its AI agent layer, automates some analysis work. The honest limit is scope. Independent 2026 comparisons place Triple Whale at gross-margin-level P&L depth, while warehouse-first tools reach fully loaded contribution margin. That matters if your real question is profit, not attribution, which is why some teams end up reviewing Triple Whale alternatives.
🔧 Solutions offered
Triple Pixel first-party tracking independent of platform attribution
Multi-touch attribution plus marketing mix modeling for budget allocation
Blended ROAS, MER, and daily profit summary views
Creative and campaign-level performance reporting
Moby AI agents for automated analysis workflows
💰 Pricing
Tiered by order volume, quote-based, with cost scaling as store volume grows.
😊 Best for
DTC brands where paid social is the dominant acquisition channel.
Growth teams that need daily campaign decisions, not quarterly reporting.
"Triple Whale is very user-friendly and easy to navigate to find the data you need across multiple channels. Relevant channels like emails, ads, organic, etc are already broken down for you and when looking at the specific channel, you have the option to customize the table displaying the data to choose which metrics are most relevant for your needs." On the downside: "Some data we still notice discrepancies between platforms, for example, tracking ads, and differences in the reported metrics like revenue." , Verified G2 Reviewer, 4/5 Triple Whale - G2 Verified Review
"Its very easy to use and works good for a multichannel solution." And the dislike: "Sometimes it does not update the numbers correctly and has errors with synchronisation." , Verified G2 Reviewer, 3/5 Triple Whale - G2 Verified Review
The sync complaint is worth sitting with. If you plan to automate decisions, an unresolved number dispute becomes an unresolved decision, which is the same trap operators describe in this r/shopify_geeks Reddit Thread on dashboard sprawl.
Luca AI takes the opposite architectural bet: it normalizes and standardizes every source on ingestion, so the reasoning layer works from one reconciled dataset rather than four platforms arguing about revenue. That approach is explained further in how Luca thinks, and applied in practice across Luca AI use cases.
1.3 Polar Analytics [toc=1.3 Polar Analytics]
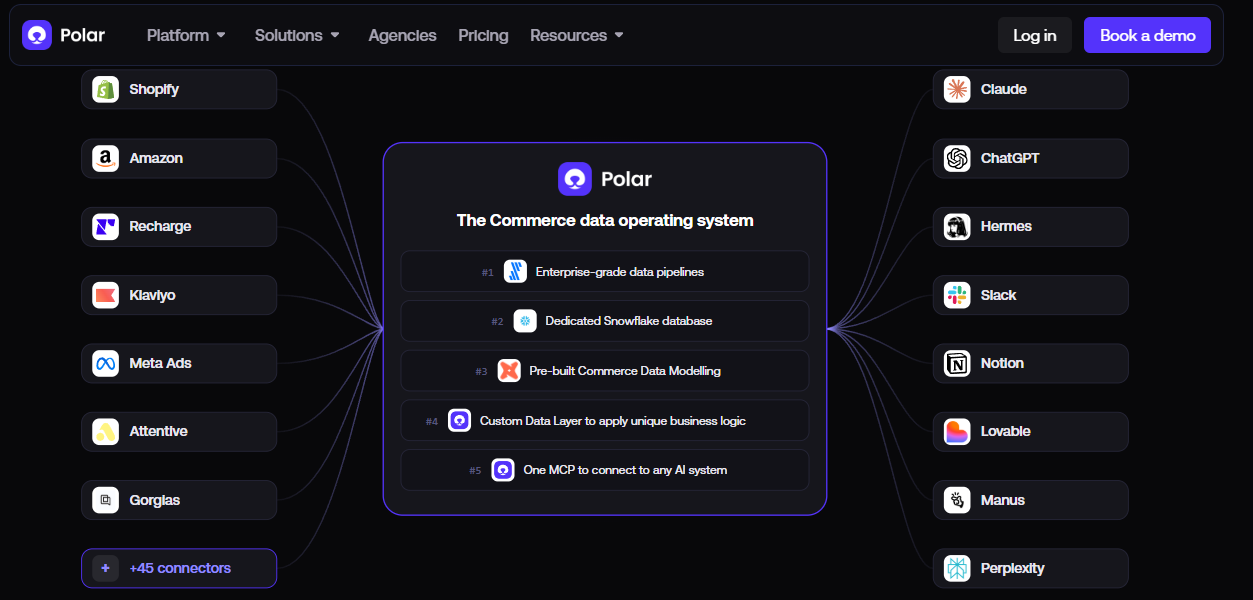
Polar pipes Shopify and Klaviyo data into a Snowflake layer that external AI tools can query
⭐ Why did we choose this tool?
Polar Analytics earns a place because it gets a lean team reporting fast. It installs on Shopify, pulls in 40+ sources, and gives you custom metrics without a warehouse project. For a brand doing $1M to $3M, that speed matters more than modeling depth. The honest limit is that it stays a reporting layer. It shows you the number moved. It rarely tells you which lever to pull next, and support consistency is a live complaint in 2025 and 2026 reviews.
🔧 Solutions offered
Shopify-native dashboards with 40+ marketing and commerce connectors
Custom metric builder without SQL
Automated alerts on metric thresholds
Peer benchmark comparisons for CAC and conversion
Multi-store consolidation for brands running several storefronts
💰 Pricing
Tiered by order volume, quote-based, with published app pricing differing from sales quotes in some reported cases.
Teams with no analyst who still need custom metric definitions.
Operators who want reporting first and modeling later.
💬 Reviews
Shortly after onboarding we were assigned an account manager. About a month later, she was laid off and we were never assigned a new account manager. I have the direct email of a support specialist, but the response time has been less than ideal, especially when real-time data is important for our team. , Ben S., Director of Commercial Operations, 4/5 Polar Analytics - G2 Verified Review
Sometimes the data takes time to update, and some ratios are more difficult to understand. , Juliette P., CEO, 4.5/5 Polar Analytics - G2 Verified Review
A third reviewer was blunter about pricing surprises: "The pricing communicated when installing the app via Shopify was completely different from the one provided by sales after the installation (which was much higher)."
The pricing communicated when installing the app via Shopify was completely different from the one provided by sales after the installation (which was much higher). , Maja, 2/5 Polar Analytics - Trustpilot Verified Review
1.4 Daasity [toc=1.4 Daasity]
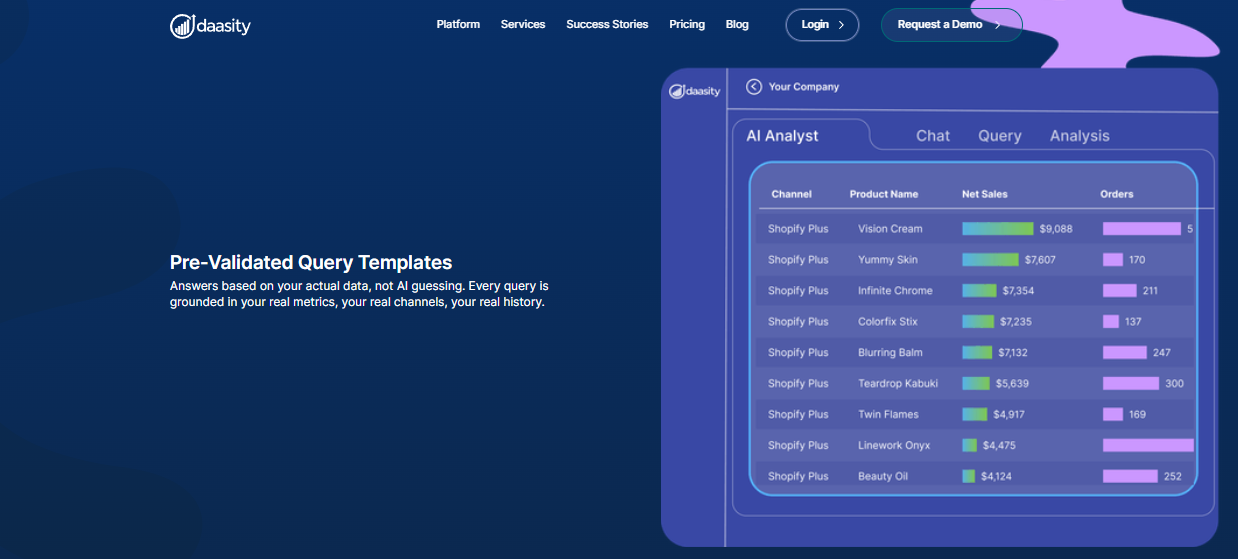
Daasity grounds every query in real channel data, keeping decision intelligence answers auditable for finance teams
⭐ Why did we choose this tool?
Daasity is on the list because it reaches the deepest P&L layer of any tool here. Independent 2026 rankings place Daasity at fully loaded contribution margin, while most competitors stop at gross margin. It builds you a real warehouse with an ecommerce data model on top. That depth costs time and money. You are buying a data platform, not an answer engine, and someone on your side has to own the reporting layer.
🔧 Solutions offered
Managed cloud data warehouse with ecommerce schema
Omnichannel ingestion across Shopify, POS, marketplaces, and wholesale
Fully loaded margin and profitability reporting, the kind of view covered in this guide to ecommerce profit margins
Custom dashboards in Looker, Power BI, or Tableau
Analyst services and implementation support
💰 Pricing
From roughly $1,899 / Month, plus implementation time and BI tooling costs.
😊 Best for
Omnichannel brands selling through retail, wholesale, and marketplaces, where omnichannel analytics matter most.
Companies past $10M revenue with someone owning data internally.
Teams that need one governed model, not fast answers.
💬 Reviews
There are a few platforms that are not yet automated (we market in a few unique channels), so at times there is manual entry to create an overall marketing performance. That said, Daasity has made progress in consistently adding more platforms into their automation. Finally, at times I wish a few reports would refresh in real time (they do overnight). , Verified G2 Reviewer Daasity - G2 Verified Review
1.5 Prescient AI [toc=1.5 Prescient AI]
⭐ Why did we choose this tool?
Prescient AI belongs here because it answers a forward-looking question. Most tools report what happened to your ad spend. Prescient models what happens next if you shift budget between channels. Media mix modeling, or MMM, uses statistical models instead of click tracking to estimate channel impact. That is genuinely decision-shaped work. The catch is spend threshold. Below roughly $150K monthly ad spend, the model has too little signal to be useful, and the price rarely clears the return.
🔧 Solutions offered
Media mix modeling across paid channels
Incrementality forecasts by channel and campaign
Forward-looking budget allocation recommendations
Marginal return curves for scaling decisions
Cross-channel measurement independent of pixel tracking, an approach compared in this look at cross-channel analytics tools
💰 Pricing
Custom quote, generally scaled to monthly media spend.
😊 Best for
Brands spending $150K or more per month on paid media.
Growth leads making weekly channel reallocation calls.
Teams that already trust their revenue data and want forecasting on top.
1.6 Peel Insights [toc=1.6 Peel Insights]
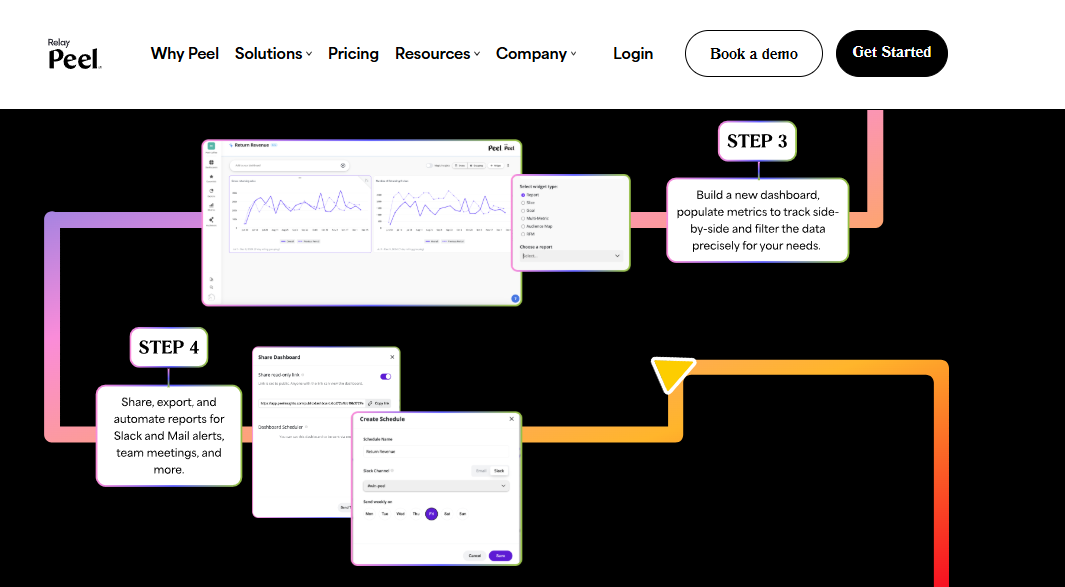
Peel automates cohort dashboards and pushes retention reports to Slack on a set schedule
⭐ Why did we choose this tool?
Peel Insights covers the retention side that most decision tools skim. It automates cohort analysis, which groups customers by first purchase date to track repeat behavior. It backfills your history on install, so you see LTV patterns without building anything. It holds a 5.0 rating across 35 Shopify App Store reviews, which is unusual. The trade-off is scope. Peel answers customer questions well and leaves acquisition and margin decisions to other tools.
One caution worth noting: independent sentiment tracking in 2026 flagged a merchant case where TikTok Shop revenue reconciled incorrectly into Shopify. Retention math is only as good as the revenue feeding it.
1.7 Tellius [toc=1.7 Tellius]
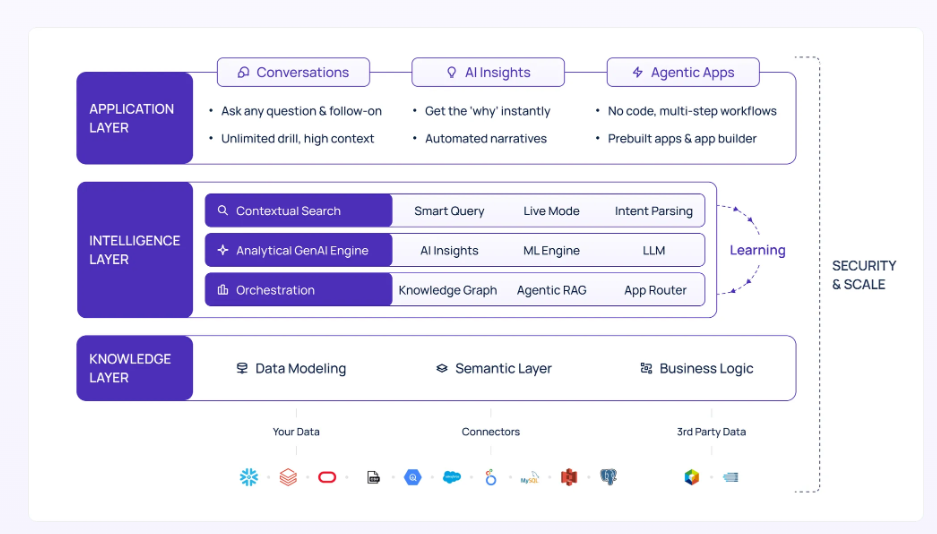
Tellius layers semantic modelling, AI insights, and agentic apps, the enterprise build most stores cannot staff
⭐ Why did we choose this tool?
Tellius is the most literal decision intelligence platform on this list. You type a question, and it runs automated root cause analysis across your data to explain what drove a change. It also flags anomalies without being asked. It holds a 4.3 average across 25 G2 reviews. The mismatch for ecommerce is that Tellius is data-agnostic. It knows statistics, not retail weeks, returns windows, or SKU hierarchies, so context work falls on you.
Custom quote, positioned for enterprise budgets rather than SMB.
😊 Best for
Companies analysing datasets beyond ecommerce, like finance or ops.
Teams with a data owner who can model the business context.
Enterprises that already have a warehouse in place.
💬 Reviews
One thing I don't like about Tellius is that it takes a little time to get comfortable with all its advanced features. The basic search is straightforward and easy to use, but some of the AI capabilities and customization options aren't very intuitive at first. , Verified G2 Reviewer Tellius - G2 Verified Review
It's pricey, and it requires you to organize your information really well in order to use it to its full potential. , Verified G2 Reviewer Tellius - G2 Verified Review
1.8 Pecan AI [toc=1.8 Pecan AI]
⭐ Why did we choose this tool?
Pecan AI made the list for one narrow strength. It builds predictive models on your raw tables without a data scientist, covering churn, LTV, and demand. That is real capability if you have a specific prediction to make. It is not an answer layer for daily operating questions. Pecan needs organised data going in, and it gives you a model coming out, which means someone still has to turn the prediction into a decision.
Custom quote, based on model count and data volume.
😊 Best for
Teams with clean warehouse data and one clear prediction target.
Brands with someone able to action a model output.
Companies replacing an external data science contractor.
✅ The two-camp verdict
Split these eight into two camps. AI-native reasoning layers, meaning Luca AI, Tellius, Pecan AI, and Prescient AI, are built to produce an answer. Ecommerce-specific platforms, meaning Triple Whale, Polar Analytics, Daasity, and Peel Insights, are built to produce a view of a domain.
Camp one risks knowing nothing about your business context. Camp two risks stopping at the chart. Choose based on which risk you can absorb, and read this breakdown of agentic AI for ecommerce founders before you commit.
💰 One pick per revenue band
$1M to $3M: Luca AI, or Polar Analytics if you only want dashboards.
$3M to $10M: Luca AI for cross-functional questions, Peel Insights added for retention depth.
$10M+: Daasity for the governed model, Prescient AI once spend clears $150K monthly.
Luca AI sits across those bands because it was built for the $1M to $5M operator with data piling up and no analyst to read it. Connect the sources, ask the question in plain English, and the reasoning arrives with the numbers attached. That is a different job than attribution, and I would not pretend otherwise. The same dashboard-sprawl problem shows up in this r/shopify_geeks Reddit Thread, and you can see how Luca AI use cases map to each band.
Q2. How Did We Score These Tools, and What Would Disqualify One? [toc=2. Scoring Methodology]
Five weighted criteria decided this list: Decision Depth 30%, Data Coverage and Integrations 20%, Usability and Plain-English Querying 20%, Pricing Transparency 15%, and Verified User Reviews 15%. Scores map to stars in 20-point bands. Luca AI scores 5 stars, Triple Whale and Polar Analytics 4, and Daasity, Prescient AI, Peel Insights, Tellius, and Pecan AI 3.
📊 Why these five, and my conflict of interest
I run Luca AI, so read this rubric with that in mind. I set the weights before scoring, not after, and I have published where our own product loses points.
Decision Depth carries the most weight for one reason. Descriptive dashboards tell you a number moved. They stop right before the part you actually need, which is what to do about it.
⚖️ The criteria, and how each was evidenced
Scoring Criteria and Weights for Decision Intelligence Tools
Criteria
Weight
What it measures
How it was evidenced
Decision Depth
30%
Root cause, influencing components, prediction, and a recommended action, not just a chart
Vendor documentation, product testing, published capability claims
Data Coverage and Integrations
20%
Number of native sources, and whether returns, accounting, and ops data land in the same place
Connector lists, review complaints about missing sources
Usability and Plain-English Querying
20%
Can a non-technical founder get an answer without SQL, an analyst, or dashboard building
G2 and Trustpilot reviews mentioning learning curve
Pricing Transparency
15%
Published pricing, quote consistency, and hidden implementation cost
Public pricing pages, reviewer reports of quote mismatches
Verified User Reviews
15%
Rating averages, review volume, and recency across G2, Trustpilot, and Shopify App Store
G2 and Shopify App Store review counts, 2024 to 2026
⚠️ What gets a tool disqualified
Two failures cost points regardless of feature depth. First, a tool that cannot show its reasoning. If you cannot audit why it recommended something, you cannot defend the decision to your CFO.
Second, a tool that needs a quarter of data cleanup before the first useful answer. Luca AI normalises and standardises data on ingestion, which is exactly the burden this criterion measures across vendors, and it is the same friction that makes ecommerce data integration projects stall.
💬 Where reviews moved a score
Reviews decided the Usability band more than any spec sheet. Two examples that cost points:
Mobile limitations and the platform isn't a plug-and-play solution, it requires time and effort to learn its advanced features and capabilities. , Charlene R., Head of Operations, HR & Culture, 5/5 Polar Analytics - G2 Verified Review
Very useful for top down view for a very fast reporting. Supports and tracks many different platforms as well. almost a no brainer for pulling out stats quickly. However, some stats are not so accurate in pulling in data; they do not tally with shopify. , Verified G2 Reviewer, 4/5 Triple Whale - G2 Verified Review
⭐ Where Luca AI loses points
Luca AI takes full marks on Decision Depth and plain-English querying, because the product is trained on the relationships between ecommerce KPIs rather than single-channel reporting. It loses points on Verified User Reviews, since Triple Whale has years more public review volume. It is also not an attribution pixel, so if attribution modeling is your primary job, our score should not persuade you.
Q3. What Separates a Decision Intelligence Tool From a Dashboard? [toc=3. DI vs Dashboards]
Decision intelligence tools combine data, analytics, and AI to support, automate, and augment decisions. Unlike BI dashboards that show what changed, they compute why a metric moved, forecast where it is heading, and recommend an action with a confidence level attached. The practical test is simple. Does the session end with a chart, or with a decision you can approve?
🧠 The seven capabilities that actually separate them
Gartner defines this category by three modes: support, automate, and augment decisions. Most tools sold as decision intelligence only cover the first.
Here is the capability set that decides which camp a tool sits in, and it is the same checklist worth applying to any ecommerce business intelligence purchase.
Seven Capabilities That Separate Decision Intelligence From Dashboards
Capability
What it does
Why it matters to a store
Plain-English querying
Ask a question without SQL or dashboard building
Removes the analyst bottleneck on Sunday nights
Automated root cause
Explains what drove a change
Turns "margin dropped" into "returns on two SKUs"
Influencing components
Names the metrics connected to the change
Shows the chain, not the symptom
Prediction on history
Forecasts sales, stock, and demand
Reorder timing stops being a feeling
Scenario simulation
Models what happens if you change a lever
Tests a budget shift before you spend
Prescriptive recommendation
States the action, not just the number
Ends the session with a decision
Scheduled agentic push
Sends findings without you logging in
Catches the problem on Tuesday, not month-end
🔍 Same MER drop, two very different outputs
Take a real situation. Your MER, which is total revenue divided by total ad spend, falls from 3.1 to 2.6 over three weeks.
A dashboard shows the line going down, plus channel splits you then compare by eye. Ask Luca AI the same question and it returns the driver, the connected metrics, and the specific spend or product change to make, which is the difference between reporting and true profitability analysis.
🎓 Treat the tool like a new hire, not a chatbot
The best frame I have heard for this came from an operator describing AI onboarding. You hired a brilliant PhD with zero context about your business, then told them to just get on with it. Even that person fails without an onboarding process.
That is why the AI chatbot framing misleads buyers. What you want is a reasoning sentry that already knows how your metrics relate, running whether or not you open the app, which is the premise behind agents for ecommerce.
⏰ The scale difference nobody prices
Here is the part operators underestimate. A marketer might review five session recordings a week, on a good week.
An AI layer can process thousands per day and report the pattern. The change is not speed on one task. It is the volume of evidence behind each decision.
Luca AI was built as the successor to the dashboard, not an addition to it. It pulls the relevant slice for the situation you describe, names the root cause and the influencing components, then tells you where to act. Reports arrive on a schedule in Slack, email, or the app, and you can see the reasoning approach in how Luca thinks.
Q4. Why Do Enterprise Decision Intelligence Platforms Fail E-commerce Brands, and What Do the Alternatives Cost? [toc=4. Enterprise vs Ecommerce-Native]
Enterprise decision intelligence platforms run roughly $225,000 to $1,225,000 per year fully loaded for 25 users, and most of that spread is labour rather than licence. Ecommerce-specific tools run about $99 to $1,899 per month. The enterprise tier fails DTC brands on cost, on implementation cycles that assume an in-house data team, and on decision models built for supply-chain planners.
💸 What the enterprise tier actually sells
Search "decision intelligence tools" and you get Palantir, Aera, SAS, and Pega. These are genuinely capable systems built for organisations with data engineers on payroll.
The licence is rarely the problem. The problem is that the value only appears after months of modeling work that someone has to do.
⚠️ Why labour is the real line item
A brand doing $4M in revenue has no spare analyst. The enterprise model assumes one exists, and the cost lands on the founder instead.
Reviewers say this plainly about tools in this tier. One G2 reviewer on Tellius put it bluntly:
It's pricey, and it requires you to organize your information really well in order to use it to its full potential. , Verified G2 Reviewer Tellius - G2 Verified Review
A generalist engine that has never heard of a retail week, a returns window, or a size-run commitment is a consultant who has never met your customer. Luca AI sits in the AI-native camp but is trained on ecommerce metric relationships specifically, which is the gap that camp usually leaves open, and it is why AI-powered BI tools built for ecommerce behave differently from horizontal platforms.
Run the arithmetic before the demo. A $3M brand at 30% contribution margin needs about $20,000 in incremental margin to justify €499 per month.
That is one avoided overstock or one repriced SKU. A $15M brand evaluating a $1,899 monthly warehouse tool needs roughly $76,000, which usually requires the tool to change a channel decision, not just report one, so track the maths against your ecommerce unit economics.
❌ When to skip all of this
A 1/5 G2 reviewer said something about Google Analytics that applies to this whole category:
The reverse is equally true. If you are under $1M in revenue, your data volume cannot support pattern detection yet. Marketplace-only sellers and pure B2B stores are also poor fits, and I would rather say that than sell into it.
Luca AI is scoped to $1M to $5M ecommerce operators and priced against the cost of a junior data analyst, at €299 to €499 per month with custom Scale pricing, listed on the Luca AI pricing page. For an enterprise that already employs a data team, the honest answer is that a platform like Palantir or Aera fits better.
Q5. Which Store Decisions Should a Decision Intelligence Tool Actually Own? [toc=5. Decisions Worth Automating]
Four decisions carry most of the money: how much budget goes to which channel this week, what quantity to reorder per SKU, what price and promo depth to run, and which cohorts deserve retention spend. A decision intelligence tool earns its licence only if it produces a defensible, explainable answer to at least three of them.
📊 Your decision inventory, priced
Run this audit before any demo. Write down each decision, how often you make it, and what it costs when you get it wrong.
The Four E-commerce Decisions and Their Dollar Exposure
Decision
Cadence
Data required
Dollar exposure
Channel budget split
Weekly
Ad spend, revenue, margin by channel
10 to 30% of monthly ad budget
Reorder quantity per SKU
Monthly
Sell-through, lead time, returns, cash position
Full purchase order value
Price and promo depth
Monthly or seasonal
Margin by SKU, elasticity, competitor pricing
Margin points across the catalog
Retention spend by cohort
Monthly
Repeat rate, LTV by first product, churn timing
Retention budget plus lost repeat revenue
Luca AI covers channel allocation, cohort targeting, and forecasting from historical patterns, then flags the outlier behind each one before you ask, which is the practical use of predictive analytics for ecommerce.
💰 The reorder nobody prices
An apparel operator described one denim buy to me like this. One style is a $6,000 commitment, because you stock sizes 23 to 32 across two locations.
Get that wrong and the money sits on a shelf for two seasons. That single decision carries more risk than a week of ad tests, and most brands make it in a spreadsheet instead of inside ecommerce inventory management.
📉 The channel call, with 2025 context
Channel allocation looks easy until the market moves under you. Triple Whale's Q1 2025 benchmark, drawn from $2.9 billion in tracked ad spend, showed Meta CPMs up 26% while new customer growth fell 5.1%.
That combination punishes brands who reallocate monthly instead of weekly. Ask a reasoning layer to compare channel margin, not channel ROAS, and the call changes, which is the core argument in this piece on AI marketing analytics for ecommerce.
✅ Which tool owns which decision
Decision Coverage by Tool
Decision
Best covered by
Channel budget split
Luca AI, Triple Whale, Prescient AI
Reorder quantity
Luca AI, Daasity
Price and promo depth
Daasity, Luca AI
Retention by cohort
Peel Insights, Luca AI
Nobody covers all four cleanly. Two tools is the realistic answer for most brands under $10M.
❌ The decisions to keep off the list
Taste is not a decision problem. One operator put the line well: AI cannot help you create taste, but it can dictate quantities.
Creative direction, brand voice, and category expansion still belong to you. Hand over the math, keep the judgment.
⏰ The finding you would never predict
One brand discovered that product category diversity, not discount depth, drove lifetime value. Customers who bought body care jumped 50 to 100% in LTV, the kind of pattern covered in this guide to ecommerce customer lifetime value.
No dashboard surfaces that. It requires a system looking for relationships across categories without being told where to look.
Luca AI runs this kind of cross-category pattern work continuously, since it is trained on how ecommerce metrics relate rather than on one channel's reporting. What we see most often is that the expensive decision was never the ad budget. It was the purchase order signed with no margin math behind it.
Q6. What Must You Feed the Engine Before You Trust Its Recommendations? [toc=6. Inputs and Data Trust]
Feed a decision engine gross margin and it will confidently tell you to scale a product that loses money. Gross margin covers what it costs to make the thing, not to sell it. Load contribution margin, then confirm four conditions: consistent SKU naming, one retail calendar, returns landing with revenue, and an attribution method you have stopped arguing about.
💸 The invoice that ended two years of work
A founder once slid a supplier invoice across the table and called the product her best seller at 72% gross margin. Twenty minutes later she was in tears.
Recalculated line by line, with every cost between the invoice and the bank account, the real contribution margin was 8%. She had spent two years scaling a product that barely broke even, which is exactly the gap explained in contribution margin vs gross margin.
📊 The margin definition that holds up
Common Thread Collective's Q1 2026 benchmark, covering 299 DTC brands with $1.01 billion in revenue and $231 million in ad spend, defines contribution margin as gross margin minus ad spend. That is the floor, not the finish line.
Load these eight lines before you trust any recommendation: landed product cost, inbound freight, duties, payment processing, pick and pack, outbound shipping, returns and refunds, and discounts. Luca AI reads accounting and payment sources alongside Shopify and ad platforms, which is what makes margin-aware reasoning possible.
✅ The four-item readiness test
Score each pass or fail. Three passes is enough to start.
SKU naming is consistent across Shopify, your 3PL, and your ad feeds.
One retail calendar is agreed, so week 554 and week 332 mean the same thing to everyone.
Returns and refunds land in the same place as revenue, not a separate export.
One attribution method is chosen, and the team has stopped relitigating it.
⚠️ Unresolved data disputes break automated decisions
This is where pilots quietly die. If two systems disagree on revenue, every recommendation built on that revenue is contestable, and no amount of ecommerce data management tooling fixes a definition dispute.
Reviewers describe exactly this problem across tools:
Some data we still notice discrepancies between platforms, for example, tracking ads, and differences in the reported metrics like revenue. Or with our emails/sms platforms about what revenue is attributed to which channel, for example, Triple Whale will attribute more revenue to the email that was sent out, but the platform will attribute more revenue to the SMS that was sent out. , Verified G2 Reviewer, 4/5 Triple Whale - G2 Verified Review
I've also reported an issue with inventory levels, as our inventory is multiplied with 6, since we have 6 different shopify stores connected to the same warehouse. Not really rocket science. But it has taken them closer to 1,5 month, and I've still not received a solution. , Maja, 2/5 Polar Analytics - Trustpilot Verified Review
⏰ Why manual reporting is the tell
One operator running £200 million in GMV described the early years as everything tied up in manual reporting, exports from Shopify, exports from the returns system. That workflow is the real cost of poor inputs, and it is why ecommerce reporting eats founder weekends.
My read is that most brands skip the hygiene work because it feels like admin. It is not admin. It is the difference between a recommendation you can act on and one you have to double-check.
Luca AI normalises and standardises data on ingestion, so the cleanup quarter that warehouse-first platforms require does not sit between you and the first useful answer. Connect the sources, ask, then act.
Q7. How Do You Pilot One in 30 Days Without Handing Over the Keys? [toc=7. Pilot and Guardrails]
Pick three recurring decisions, write down how you make them today and what they cost, then give the tool 30 days to beat that baseline. Week one connect sources, week two replicate last quarter's decisions blind, week three run live inside guardrails, week four score contribution margin impact against subscription cost.
📋 Capture the baseline first
Most pilots fail because nobody wrote down the starting point. Before you connect anything, record how long each decision takes and what it cost last quarter.
Shopify's own reports give you the raw activity data, but they stop at description. That gap is the thing your pilot is testing, and it is the limit mapped out in this Shopify analytics dashboard explainer.
⏰ The four-week schedule
30 Day Decision Intelligence Pilot Schedule
Week
Work
Owner
Expected output
1
Connect sources, verify revenue and returns match
Ops lead
One reconciled dataset
2
Ask the tool last quarter's questions, blind to your answers
Founder
Agreement or disagreement log
3
Run live with thresholds and approval rules set
Growth lead
Two or three acted-on recommendations
4
Score margin impact against cost
Founder or CFO
Keep or kill decision
Week two is the honest test. Ask Luca AI or any candidate the same questions you already answered, then compare.
🔍 Scoring and kill criteria
Score three things: time to answer, whether you could audit the reasoning, and margin moved. Kill the pilot if any of these appear.
The tool cannot explain why it recommended something.
Revenue still does not reconcile by week two.
You overrode more than half the recommendations for good reasons.
⚠️ The autonomy ladder
Do not jump straight to automation. Move up one rung at a time.
Monitor first, so the system watches without acting. Then recommend, then act with your approval, and only then act alone inside tight limits. Luca AI defaults to the middle rungs, pinging Slack, email, or app when ROAS dips, CAC spikes, or inventory falls below threshold, the approach described in agentic AI for ecommerce founders.
❌ What unsupervised autonomy actually looks like
A premium bike brand published a homepage image of a $20,000 bike with the rear derailleur mounted on the front wheel. Unsupervised AI shipped it.
The lesson from that team was blunt: do not remove the QA, and do not let the AI be the QA. Keep the human on anything customer-facing or irreversible.
✅ Set expectations on refresh speed
Pilots also stumble on timing, not accuracy. Reviewers flag this across the category:
At times I wish a few reports would refresh in real time (they do overnight). , Verified G2 Reviewer Daasity - G2 Verified Review
Here is where my confidence drops. Tasks that took two weeks of manual data work now finish in about 90 seconds, which is real and easy to verify.
What I cannot yet prove is how much autonomy operators will tolerate by 2027. Luca AI's usage points toward recommendation over execution for now, though I might be reading that too conservatively. If you run this pilot, tell me which recommendations you overrode and why, or just start a conversation with us. That answer interests me more than the ones you accepted.
FAQ's
What are decision intelligence tools, and how are they different from BI dashboards?
Decision intelligence tools combine your data, analytics, and AI to support, automate, and augment decisions. A BI dashboard shows what changed. A decision intelligence tool computes why the metric moved, forecasts where it is heading, and recommends a specific action with reasoning attached.
The practical test we give operators is simple. Does the session end with a chart, or with a decision you can approve?
Seven capabilities separate the two categories:
Plain-English querying without SQL or dashboard building
Automated root cause that explains what drove a change
Influencing components that name the connected metrics
Prediction on history for sales, stock, and demand
Scenario simulation to test a lever before you pull it
Prescriptive recommendation stating the action, not the number
Scheduled agentic push that reports without you logging in
Luca AI was built as the successor to the dashboard rather than an addition to it, pulling the relevant slice for the situation you describe and naming the driver behind it. If you want the fuller category background, our breakdown of ecommerce business intelligence covers where traditional BI stops and reasoning begins.
How much do decision intelligence tools cost for an ecommerce brand in 2026?
Pricing splits into three honest bands, and the gap between them is the biggest buying insight in this category.
Benchmark data: from about $99 per month, but you still do the analysis yourself
Ecommerce-specific tools: roughly €299 to $1,899 per month, with implementation and quote mismatches as the hidden cost
Enterprise platforms: approximately $225,000 to $1,225,000 per year fully loaded for 25 users, where most of the spread is labour rather than licence
That last figure surprises most founders. The licence is rarely the problem. The problem is the modeling work that someone with a data background has to complete before value appears.
Run break-even before any demo. A brand doing $3M at 30% contribution margin needs roughly $20,000 in incremental margin to justify €499 per month, which is one avoided overstock or one repriced SKU. A $15M brand weighing a $1,899 monthly warehouse tool needs closer to $76,000, which usually means the tool has to change a channel decision, not just report one.
Luca AI is priced against the cost of a junior data analyst rather than an enterprise deployment, and current tiers sit on our pricing page.
Which store decisions should a decision intelligence tool actually own?
Four recurring decisions carry most of the money in a DTC business. A tool earns its licence only if it produces a defensible, explainable answer to at least three of them.
Channel budget split, weekly, exposing 10 to 30% of your monthly ad budget
Reorder quantity per SKU, monthly, exposing the full purchase order value
Price and promo depth, monthly or seasonal, exposing margin points across the catalog
Retention spend by cohort, monthly, exposing budget plus lost repeat revenue
The reorder is the one nobody prices. An apparel operator described a single denim style as a $6,000 commitment, because you have to stock sizes 23 to 32 across two locations. Get it wrong and the cash sits on a shelf for two seasons.
Some decisions should stay with you. AI cannot create taste, though it can dictate quantities, so creative direction and category expansion remain human calls.
Luca AI covers channel allocation, cohort targeting, and forecasting from historical patterns, then flags the outlier behind each one before you think to ask. Our guide to predictive analytics for ecommerce walks through the forecasting side in detail.
What data do we need in place before trusting automated recommendations?
Feed a decision engine gross margin and it will confidently tell you to scale a product that loses money. Gross margin covers what it costs to make the thing, not what it costs to sell it.
We watched a founder call a product her best seller at 72% gross margin. Recalculated cost by cost, the real contribution margin was 8%, after two years of scaling it.
Load these eight cost lines first: landed product cost, inbound freight, duties, payment processing, pick and pack, outbound shipping, returns and refunds, and discounts.
Then run the four-item readiness test. Three passes is enough to start:
SKU naming is consistent across Shopify, your 3PL, and your ad feeds
One retail calendar is agreed across the team
Returns and refunds land with revenue, not in a separate export
One attribution method is chosen and no longer relitigated
Unresolved revenue disputes are where pilots quietly die, because every recommendation built on contested revenue is itself contestable. Luca AI normalises and standardises data on ingestion, so the cleanup quarter that warehouse-first platforms require does not sit between you and the first useful answer. The margin distinction is unpacked further in contribution margin vs gross margin.
How do we pilot a decision intelligence tool in 30 days without handing over control?
Pick three recurring decisions, write down how you make them today and what they cost, then give the tool 30 days to beat that baseline.
Week 1: connect sources and verify revenue and returns reconcile
Week 2: ask last quarter's questions blind, then compare answers
Week 3: run live with thresholds and approval rules set
Week 4: score contribution margin impact against subscription cost
Kill the pilot if the tool cannot explain its reasoning, if revenue still does not reconcile by week two, or if you overrode more than half the recommendations for good reasons.
On autonomy, climb the ladder one rung at a time: monitor, recommend, act with approval, and only then act alone inside tight limits. A premium bike brand published a homepage image of a $20,000 bike with the derailleur on the wrong wheel because nobody reviewed the output. Do not let the AI be the QA.
Luca AI defaults to the middle rungs, pinging Slack, email, or the app when ROAS dips, CAC spikes, or inventory falls below threshold. If you run this pilot, tell us which recommendations you overrode and why, either through a quick conversation with our team or on your own scorecard.
Enjoyed the read? Join our team for a quick 15-minute chat — no pitch, just a real conversation on how we’re rethinking Ecommerce with AI - Luca
Loading Schedule...
Your AI Co-Founder is here.
Here’s why:
Shopify, Meta, Xero - one brain.
"Should I scale?" Answered with real data.
Growth capital. No applications. One click.
Thank you! Your submission has been received! Please book a time slot for the Meeting
Oops! Something went wrong while submitting the form.