Ecommerce analytics works in four layers: behavioral, attribution, customer, and financial. Most stores instrument the first two and guess at the fourth.
Gross margin is a manufacturing number. A 72% gross margin knife set carried $71.30 in true costs against a $49.99 price, a $21.31 loss per unit.
Eight cost lines sit between supplier invoice and profit: landed cost, storage, pick and pack, shipping, processing, returns, support, and CAC.
Platforms will never reconcile. Pick one financial source of truth, decide budgets on MER, and log the weekly variance so you learn your normal gap.
Benchmarks only mean something inside your GMV band and AOV segment. Your own trailing 25th to 75th percentile is the band that governs spend.
Forecast accuracy, not chart count, is the real test of an analytics stack, and unit economics expire roughly every thirty days.
Q1. What is ecommerce analytics, and what are its four layers? [toc=1. Definition & Four Layers]
An operator I spoke with last quarter ran a $2.3M kitchenware store on Shopify. She had GA4, Shopify reports, Meta Ads Manager, and Klaviyo open in four tabs. She could tell me her conversion rate to one decimal place. She could not tell me whether her best-selling SKU made money.
Ecommerce analytics is the practice of collecting, reconciling, and interpreting store, marketing, and financial data to decide where the next dollar goes. It works in four layers: behavioral (what visitors do), attribution (what caused the order), customer (who comes back and why), and financial (whether any of it made money). Most stores instrument the first two layers and guess at the fourth. That is why revenue grows while the bank balance does not.
🧭 Why the first two layers get all the attention
The behavioral and attribution layers are free or nearly free. GA4 installs in an afternoon. Meta's pixel ships with the ads account. Both produce charts within hours, so they feel like progress. If you are still wiring the basics, our walkthrough on adding Google Analytics to Shopify covers the setup end to end.
The financial layer is different. It needs your 3PL invoice, your processor statement, your return log, and your helpdesk volume. None of that arrives as a chart. Someone has to join it by hand, which is exactly why it never gets done, and why ecommerce data integration is the real unlock rather than another chart library.
The Four Layers of Ecommerce Analytics
Layer
What it answers
Where the data lives
What breaks without it
Behavioral
What do visitors do on site?
GA4, Shopify, session tools
You optimize the wrong page
Attribution
What caused this order?
Meta, Google, Shopify
You scale the wrong channel
Customer
Who returns, and why?
Klaviyo, order history
You buy customers who never repeat
Financial
Did this actually make money?
3PL, processor, Xero, helpdesk
You scale a product that loses cash
⚠️ The dashboard is not the windshield
I think about this the way you think about driving. Your dashboard shows speed and fuel. Your windshield shows what you are about to hit. Most stores have a beautiful dashboard and a dirty windshield.
Luca AI sits as an AI layer over your connected data warehouse, pulling from commerce, ads, accounting, banking, and operations sources. That matters because the financial layer only becomes answerable once the other three are normalized into one schema, where "revenue" means the same thing in Shopify, Stripe, and Xero. That unified view is what we mean by ecommerce business intelligence rather than reporting.
⏰ What Monday reporting owes you
Three answers, every week. Which SKUs produced real contribution margin. Where cash is currently trapped. Which single action changes profit this week.
If your reporting gives you anything less than that, you have reporting, not analytics. Everything below is built to get you those three answers without hiring a data team.
Luca AI normalizes and standardizes data on ingestion, which removes the cleanup year most warehouse projects spend before producing a single decision. You connect sources, then ask questions in plain English instead of building the join yourself, which is the core of how conversational analytics tools replace dashboard navigation.
Q2. Why is gross margin lying to you? [toc=2. Gross Margin Lie]
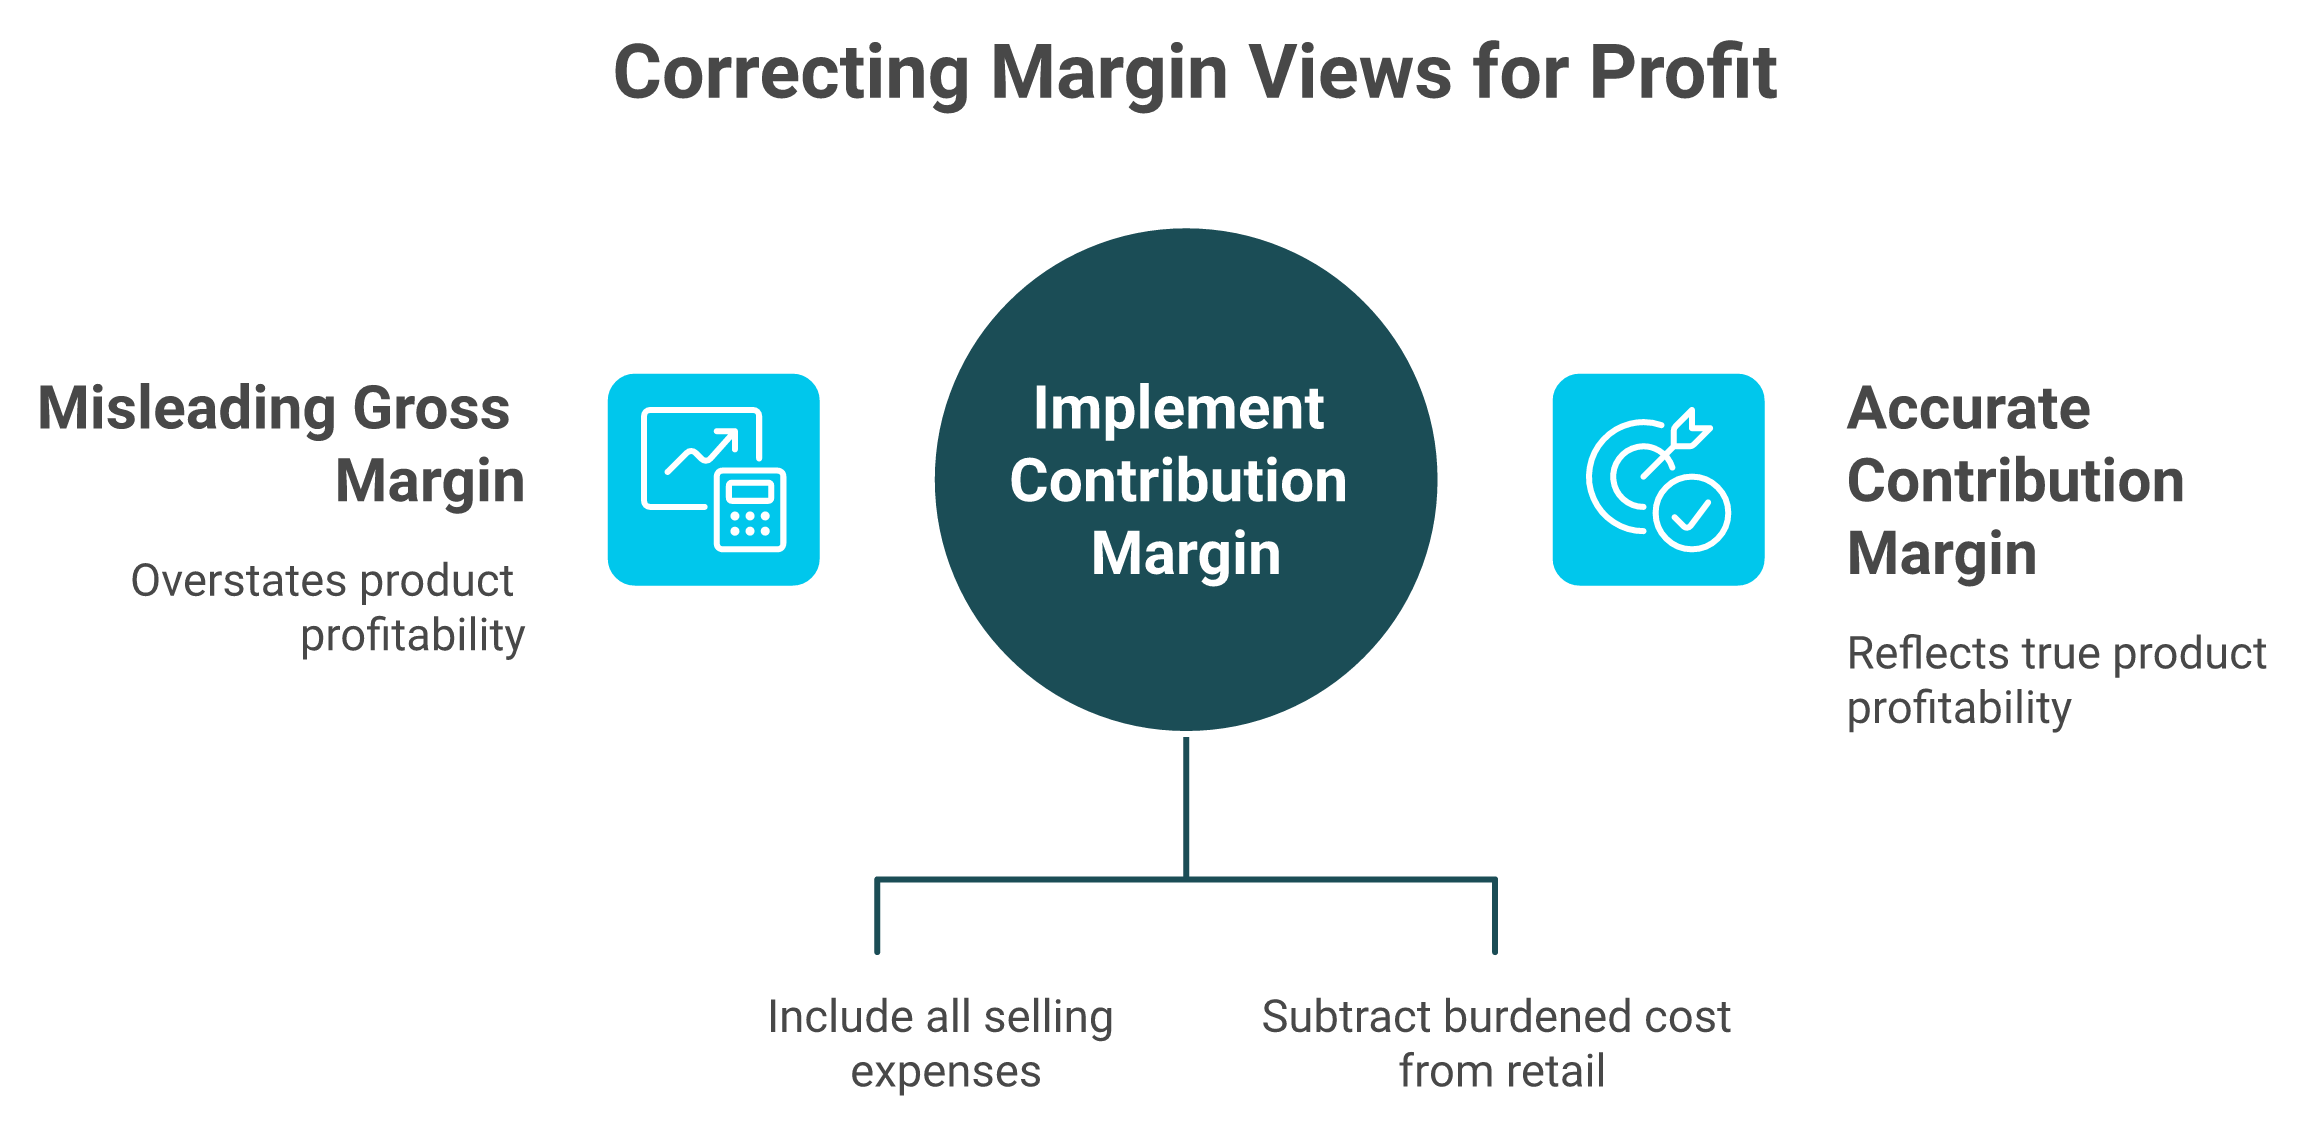
Gross margin only tells you what it costs to make the thing. It tells you nothing about what it costs to sell the thing. Eight variable costs sit between the supplier invoice and actual profit, and a product reporting 72% gross margin routinely lands in single digits once those are counted. Contribution margin per order, per SKU, is the only margin number worth a pricing, ad, or inventory decision.
💸 The 72% that was actually 8%
One product, two margin methods, opposite conclusions. The 72% figure is what most founders scale on; the 8% figure is what the bank account reflects.
The kitchenware founder slid an invoice across the table. Her hero ceramic knife set cost $14.00 at the factory and sold for $49.99. She called it her best product and said they could not make them fast enough.
Twenty minutes later, we had walked her P&L, her shipping data, her return rate, and her support tickets line by line. True contribution margin on that product was 8%. The data had been sitting in her own systems the entire time. The full distinction is broken down in our piece on contribution margin vs gross margin.
⚠️ Blended numbers are where SKUs go to hide
Blended AOV and blended CAC are the two averages that cause the most damage. Average a 4% return rate against an 18% return rate and both products look fine. Average a $12 CAC against a $31 CAC and your worst acquisition channel disappears into the mean.
Operators feel this before they can prove it. Here is what that sounds like in public:
"I'm consulting for a CPG company that's leaning heavily on Meta ads to drive sales. AOV is ~$65 and the ads are 'working' the question though..." — Operator, r/DigitalMarketing, April 2024, r/DigitalMarketing Reddit Thread
"Dealing with attribution discrepancies across Shopify, Google Ads, and Meta Ads is a common challenge, as each platform uses its own algorithms and methods for tracking and attributing conversions." — Operator, r/PPC, December 2023, r/PPC Reddit Thread
Both threads describe the same gap. Revenue is visible. Profit is a guess.
✅ Why this is the highest-leverage switch you can make
Andrew Faris has been arguing through 2026 that the biggest open opportunity in ecommerce sits in margin and operating expense, not in another creative test, as he set out in The Andrew Faris Podcast. That matches what I see. Most stores have squeezed their ad accounts hard and never audited their cost stack once, which is the same pattern behind declining platform ROAS versus true profitability.
Luca AI reasons across connected Shopify, ad platform, accounting, 3PL, and support data, so contribution margin by SKU becomes a question you ask rather than a model you rebuild. Ask it which SKUs fell below target margin last month and it returns the ranked list plus the cost line that moved.
⭐ The rule, stated plainly
No pricing decision, no ad budget decision, and no reorder decision gets made on gross margin again. Gross margin is a manufacturing number. Contribution margin is a business number.
Luca AI identifies the influencing components behind a margin move, which is the part a static spreadsheet cannot do. We built it that way because operators do not need the number; they need the reason behind the number. That reasoning layer is what separates AI-powered analytics tools from charting software.
Q3. What are the eight costs between the supplier invoice and your profit? [toc=3. Eight Hidden Costs]
The eight are landed cost, warehousing, pick and pack, outbound shipping, payment processing, allocated returns, allocated customer service, and customer acquisition cost. On a $49.99 ceramic knife set: $17.75 landed, $0.65 storage at 47 days average stay, $4.10 pick and pack, $8.40 dimensional-weight shipping, $1.75 processing, $6.20 returns at an 18% return rate, $1.45 support because one SKU drove 42% of tickets, and $31.00 CAC. Total $71.30 against a $49.99 sale, a $21.31 loss per unit.
Returns, support, and dimensional weight are the three that never make it into the spreadsheet. They are the three that hurt most. A 7.5-inch box on a lightweight product gets billed by volume, not weight, so a $49.99 order can carry $8.40 in freight, a calculation UPS documents in its dimensional weight guidance.
Support allocation sounds fussy until you tag tickets by SKU. When 42% of all tickets trace to one product, that product is paying a salary. Luca AI connects support and operations data alongside commerce and ad data, so ticket volume by SKU sits in the same layer as margin. That is the practical version of tracking ecommerce unit economics without a data hire.
✅ Yes, CAC belongs in unit economics
Finance teams will tell you CAC is marketing overhead, not a product cost. I disagree, and I will take the position. If you must spend money to acquire a customer to sell that unit, it is a variable cost of that sale.
Argue about where it lands on the P&L. Do not leave it out of product-level math. A $31 CAC against a $49.99 price point is the single largest line in the stack, and hiding it does not make it smaller. Our breakdown of ecommerce profit margins shows what happens to the blended number when you allocate honestly.
❌ Why your audit expires in thirty days
Shipping rates move. Return rates swing with season. CAC changes with auction pressure. Run this once and you have a snapshot, not a discipline. Merchant data quality is the other moving part. One long-running Shopify Community thread documents exactly how fragile the inputs can be:
"I'm starting this thread to consolidate what is clearly a systemic issue affecting many Shopify merchants, including Shopify Plus stores, and to move the conversation beyond deflection and into actual..." — Shopify merchant, December 2025, Shopify Community Verified Merchant Thread
Luca AI holds the cost model against live 3PL, processor, support, and ad data, detects the anomaly when a SKU's contribution margin moves, and traces the root cause to the cost line that shifted. That is the version of this audit that survives a busy quarter instead of dying in month two, and it is why ecommerce monitoring tools beat a one-time spreadsheet.
Q4. Which metrics and formulas should you actually act on, and how often? [toc=4. Metrics, Formulas & Cadence]
Act on eight: conversion rate (orders/sessions), AOV (revenue/orders), revenue per visitor, contribution margin, CAC, MER (total revenue/total marketing spend), repeat purchase rate, and checkout abandonment. ROAS is platform-attributed revenue over ad spend, useful only for in-platform optimization. Daily, watch anomaly triggers. Weekly, review MER, contribution margin by SKU, and return rate. Monthly, refresh unit economics, cohort LTV, and lead times. Luca AI monitors these continuously and pushes an alert when any one of them breaks its normal range.
📐 The eight formulas, with the segmentation rule
The Eight Metrics Worth Acting On
Metric
Formula
Segment it by
Conversion rate
Orders / sessions
Channel, device, new vs returning
Net AOV
(Revenue minus shipping, discounts, expected returns) / orders
Product, first vs repeat order
Revenue per visitor
Revenue / sessions
Channel
Contribution margin
Revenue minus all eight variable costs
SKU, never blended
CAC
Acquisition spend / new customers
Channel and product
MER
Total revenue / total marketing spend
Store level, monthly trend
Repeat purchase rate
Repeat customers / total customers
First-product cohort
Checkout abandonment
Abandoned checkouts / initiated checkouts
Device, payment method
Net AOV is the one most stores get wrong. Strip shipping charges, discounts, and expected return value out, so you are measuring what you keep rather than what you invoiced. Do the same for lead times, using the median rather than the mean, because one delayed container will distort every planning number downstream. Our list of top ecommerce KPIs applies the same segmentation discipline across the full set.
🧮 ROAS, MER, and contribution margin do different jobs
ROAS vs MER vs Contribution Margin
Metric
What it measures
Decision it belongs to
ROAS
Platform-attributed revenue per ad dollar
Creative and campaign optimization inside the platform
MER
All revenue per all marketing dollars
Total budget level, month over month
Contribution margin
Profit after every variable cost
Pricing, reorder, SKU keep-or-kill
MER accounts for long lead times and repeat purchases, which platform ROAS cannot see. Industry bands help calibrate it: Triple Whale's 2026 Meta ads benchmark set puts MER near 0.75 in Media and Publishing and 0.62 in Health and Wellness. Use your own trailing twelve months as the real target.
⏰ Three tiers, and what to delete
Tier your metrics by how fast the decision moves. Anything that fits no tier does not belong on the report.
Daily should be alert-driven, not dashboard-driven. If nothing crossed a threshold, you have nothing to look at, and that is the correct outcome.
Weekly is where decisions happen: MER, contribution margin by SKU, and return rate. Monthly is where assumptions get refreshed: unit economics, cohort LTV, and lead times. Anything that does not change a decision at one of those three cadences comes off the report, a pruning rule we apply in ecommerce reporting as well.
✅ Flip the daily tier from pull to push
Luca AI inverts the daily check entirely. Rather than opening a dashboard to see whether something broke, you ask Luca AI to watch MER, CAC, and inventory thresholds, and it pushes to Slack or email when a metric moves outside its usual pattern. That is the operating model behind automated data reporting in ecommerce.
Intelligence in business intelligence is knowing what not to track. Luca AI studies performance across months and years, so an alert arrives with the pattern it violated and the related metrics that moved with it. We designed the alert to carry the reasoning, because "CAC spiked" without a cause is just another notification.
Q5. What do ecommerce benchmarks mean inside your GMV band? [toc=5. Benchmarks By Band]
A Head of Growth once sent me a screenshot of a 1.6% conversion rate with one line attached: "Is this bad?" He sold $180 outdoor gear on Shopify. The blog he was comparing against averaged food and beverage stores at $42 orders.
A benchmark only means something inside your revenue band, your industry, and your AOV segment. Littledata's Shopify data puts the platform average near 1.4%, with the top 20% above 3.2%. Polar Analytics, drawing on 4,000-plus Shopify brands, shows Food and Beverage near 3.21% and Automotive near 1.12%. Luca AI measures performance against your own trailing distribution rather than a published average, flagging where current numbers fall outside your normal seasonal range.
📊 The bands that actually matter
Segmentation Dimensions That Change Your Benchmark
Segmentation dimension
Why it changes the number
Industry
Food and beverage converts near 3.2%, automotive near 1.1%
AOV above or below $100
High-ticket products convert lower by design
GMV band (under $1M, $1M to $10M, over $10M)
Traffic mix and repeat base differ sharply
Traffic source
1.5% from cold paid social beats 1.5% from branded search
Revenue per visitor settles most arguments. A store at 1.5% conversion with a $200 AOV earns $3.00 per visitor. A store at 3.0% with a $45 AOV earns $1.35. The second store looks better on the metric everyone quotes and makes less money. Our breakdown of ecommerce performance analytics shows how to rank these pairs before anyone sets a target.
⚠️ Operators already know benchmarks are a trap
The most useful benchmark advice I have read came from a Shopify seller, not an analytics vendor:
"In terms of benchmarking against others, you shouldn't, benchmarking should only be used to improve your own rates through creating a better customer journey." — Shopify seller, January 2024, r/shopify Reddit Thread
"My last store conversion was between 2&3% (footwear fashion, aov - 55). My new store is around 6-7% (craft supplies, aov - 110)." — Shopify seller, January 2022, r/shopify Reddit Thread
Same operator. Same skill level. More than double the conversion rate, because the category changed. That is the whole argument against absolute targets.
✅ Build your own band in twenty minutes
Pull your trailing twelve months of weekly conversion rate, net AOV, and MER. Find the 25th and 75th percentile for each. That range is your band. A clean ecommerce analytics dashboard makes that pull a two-minute job rather than an afternoon.
Anything inside it is normal variance and does not need a meeting. Anything below the 25th percentile is a signal worth chasing this week. External benchmarks become a sanity check twice a year, not a weekly target.
⏰ Stop auditing what is already fine
Luca AI runs the trailing distribution continuously and calls out the areas that are already well optimized, not just the ones that slipped. That part matters more than it sounds. Most operators I work with waste the first hour of Monday confirming that four healthy metrics are still healthy. That is the gap decision intelligence tools are meant to close.
Luca AI compares your current week against your own history across months and years, so an alert arrives only when something leaves its usual pattern. My read is that your own trailing numbers beat any published table, though I hold that loosely for stores under a year old with thin history.
Q6. How do you build tracking you can actually trust? [toc=6. Tracking QA & Reconciliation]
Fix your inputs before you argue about models. Audit sessions by country and URL parameter patterns first, because merchants have reported sustained bot traffic approaching half of all sessions, which corrupts conversion rate before attribution enters the picture. Then accept that platforms will never match. Shopify attributes last click server-side, Meta credits 7-day click and 1-day view, and Google back-fills conversions to the click date. Luca AI holds spend, orders, fees, and refunds in one normalized layer, so the weekly variance check runs against a single reconciled dataset.
💸 The $100k that was $50k
A consultant working with a CPG brand described the pattern plainly. Meta claimed roughly $100k in revenue. Shopify and GA4 both showed around $50k on the same $500k period.
"I'm consulting for a CPG company that's leaning heavily on Meta ads to drive sales. AOV is ~$65 and the ads are 'working' the question though..." — Operator, April 2024, r/DigitalMarketing Reddit Thread
"Dealing with attribution discrepancies across Shopify, Google Ads, and Meta Ads is a common challenge, as each platform uses its own algorithms and methods for tracking and attributing conversions." — Operator, December 2023, r/PPC Reddit Thread
Nobody in either thread was doing anything wrong. The platforms simply count different events over different windows.
⚠️ Run the hygiene audit before the attribution audit
Three checks, in this order. First, filter bot sessions by country, user agent, and repeated parameter permutations. One Shopify Community merchant thread documents merchants losing roughly half their session counts to this.
Second, enforce UTM discipline so every paid link carries source, medium, and campaign in a fixed format. Third, confirm GA4 fires add_to_cart, begin_checkout, and purchase with consistent values, as specified in Google's GA4 ecommerce event documentation. Luca AI pulls from the commerce and ad sources directly rather than relying on browser events alone, which limits how much a tag misfire distorts the financial layer. Sound ecommerce data management starts at exactly this step.
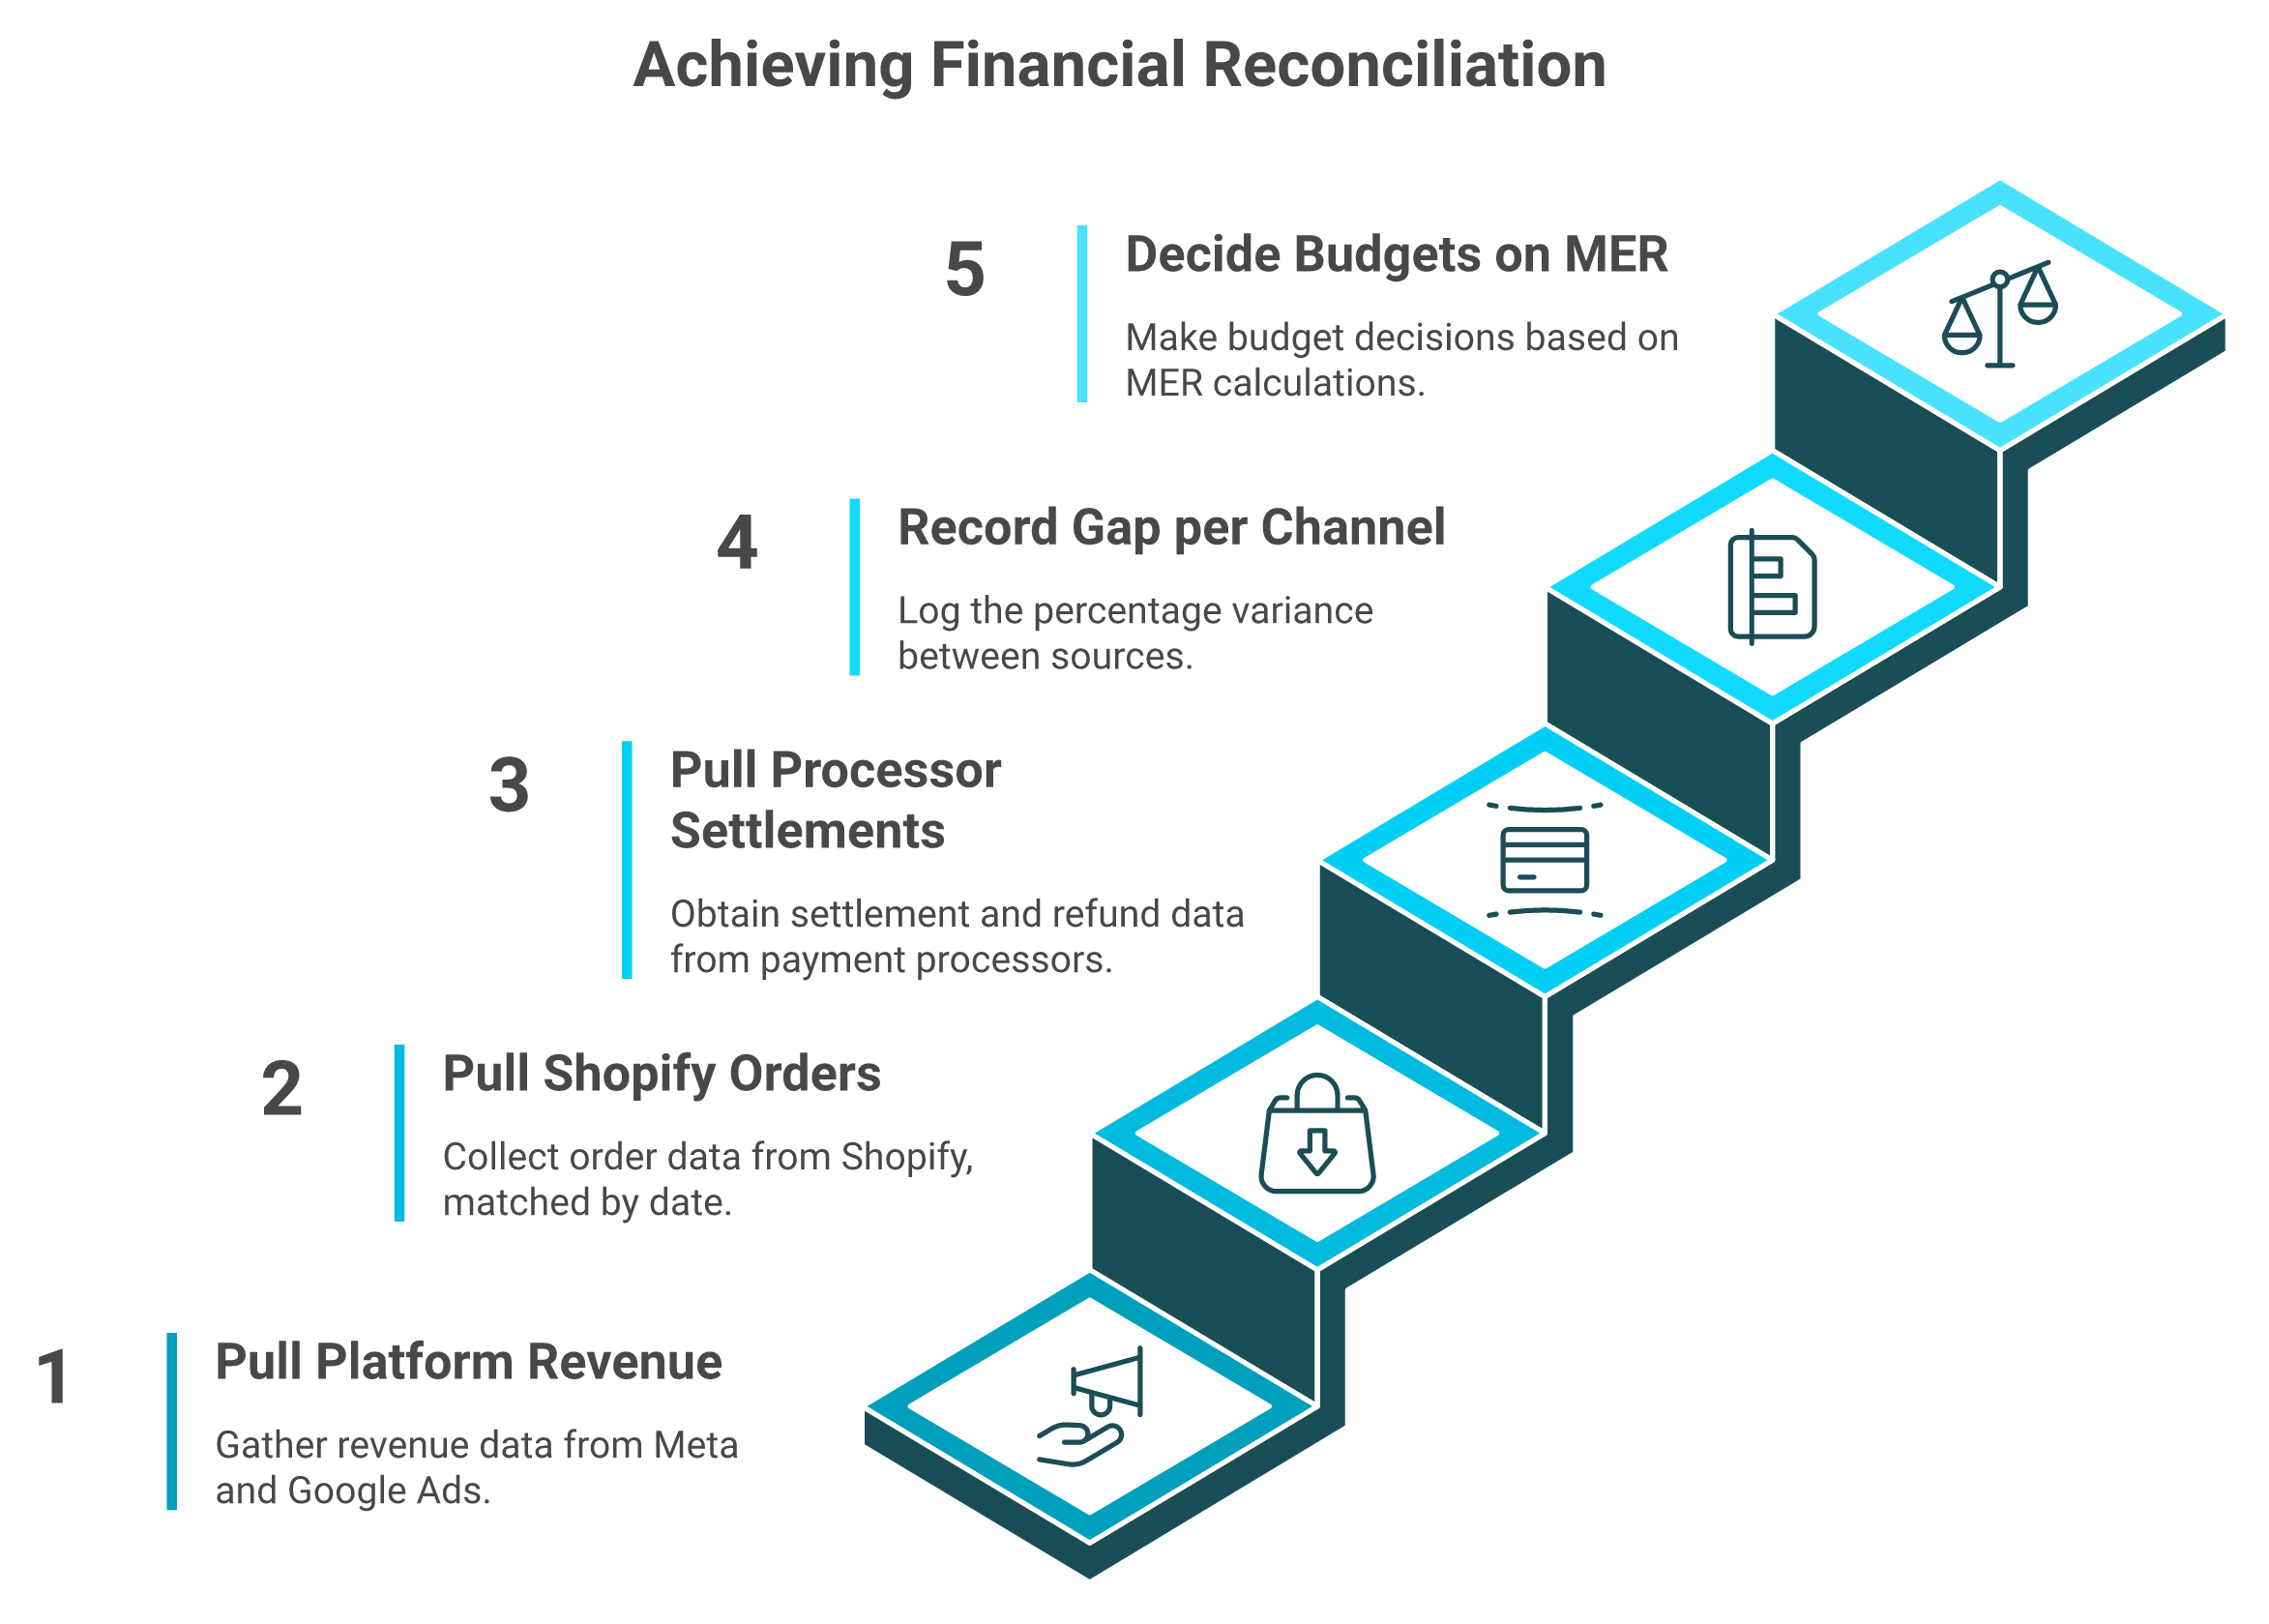
✅ The weekly reconciliation, five steps
Platforms will never agree. This five-step loop turns the discrepancy into a logged variance you can actually budget against.
Pull platform-reported revenue from Meta and Google.
Pull Shopify orders for the same period, by order date.
Pull processor settlements and refunds.
Record the percentage gap per channel in a variance log.
Make budget calls on MER, which uses total revenue over total marketing spend.
The log is the point. After six weeks, you know your normal gap, so a real break stands out instead of hiding inside the usual noise. Teams that run this well usually pair it with cross-channel analytics tools rather than three open tabs.
❌ Why ROAS keeps costing stores money
Meta will credit itself for a conversion it merely touched. That is not deception; it is how the attribution window works. Scale on platform ROAS alone and you fund the channel with the loosest counting rules. We traced that exact failure in declining platform ROAS versus true profitability.
Luca AI reasons across ad spend, orders, fees, and refunds together, so when variance moves outside its usual range, it surfaces which source changed rather than leaving you to diff three exports. We built the reconciliation into the layer because the Monday spreadsheet version never survives a busy quarter.
Q7. How do you find your real LTV lever without a data team? [toc=7. Cohorts & LTV Levers]
Run cohorts against raw order data before touching creative. One operator spent twelve months optimizing front-end conversion, then found product category diversity, not purchase frequency or opening AOV, was the primary driver of lifetime value. Customers who crossed into body care rose 50% to 100% in LTV. Luca AI runs cohort cuts on request and identifies which components influence lifetime value most, then continues monitoring those cohorts for drift.
⏰ Twelve months spent on the wrong lever
Here is the part that stings. He did good work for a year. Better creative, faster landing pages, cleaner checkout. Revenue moved a little.
The assumption underneath was that LTV improves when people buy more often. That is the default assumption almost every operator starts with. It is usually wrong, and nothing on the dashboard tells you so. Our guide to Shopify LTV works through why the frequency assumption fails first.
✅ The cut that found it
He queried raw order history and grouped customers by the product category of their first purchase. Then he tracked each group's spend over the following twelve months.
The pattern appeared immediately. Buyers who later purchased from a second category behaved like a different business. Frequency was a symptom. Category crossover was the cause.
Four Cohort Cuts Worth Running
Cohort cut
What it reveals
First-order category
Which entry product recruits the best customers
Category crossover (one vs two or more)
The real LTV step change
First-order discount vs full price
Whether discounting buys bad cohorts
Acquisition channel by cohort
Which channel sends customers who stay
💰 What changed on Monday
He rebuilt post-purchase email and SMS around cross-category progression instead of reorder reminders. The first flow after purchase now introduces the adjacent category rather than nudging a repeat of the same item. That sequencing logic depends on sharp customer segmentation in ecommerce.
That is a sequencing change, not a rebuild. Common Thread Collective's 2026 forecasting work makes the same structural argument, running cohorts rather than channels as the base unit of planning, with 41% average contribution margin growth across its portfolio.
⭐ Run this cut yourself this week
Export twelve months of orders with customer ID, order date, order value, and product category. Group by first-order category. Flag every customer who later bought a second category, and compare the two groups' twelve-month revenue.
If the gap is large, your retention program has been pointed at the wrong behavior. Luca AI performs this cohort work conversationally, so you ask which first-order category produces the highest twelve-month value and get the ranked answer with the influencing components named. I could be reading the category-crossover effect too strongly across all verticals, so test it on your own catalogue before you rebuild anything. The same approach carries across customer profitability analysis.
Q8. How do you plan inventory and cash from the same forecast? [toc=8. Inventory, Cash & Forecasting]
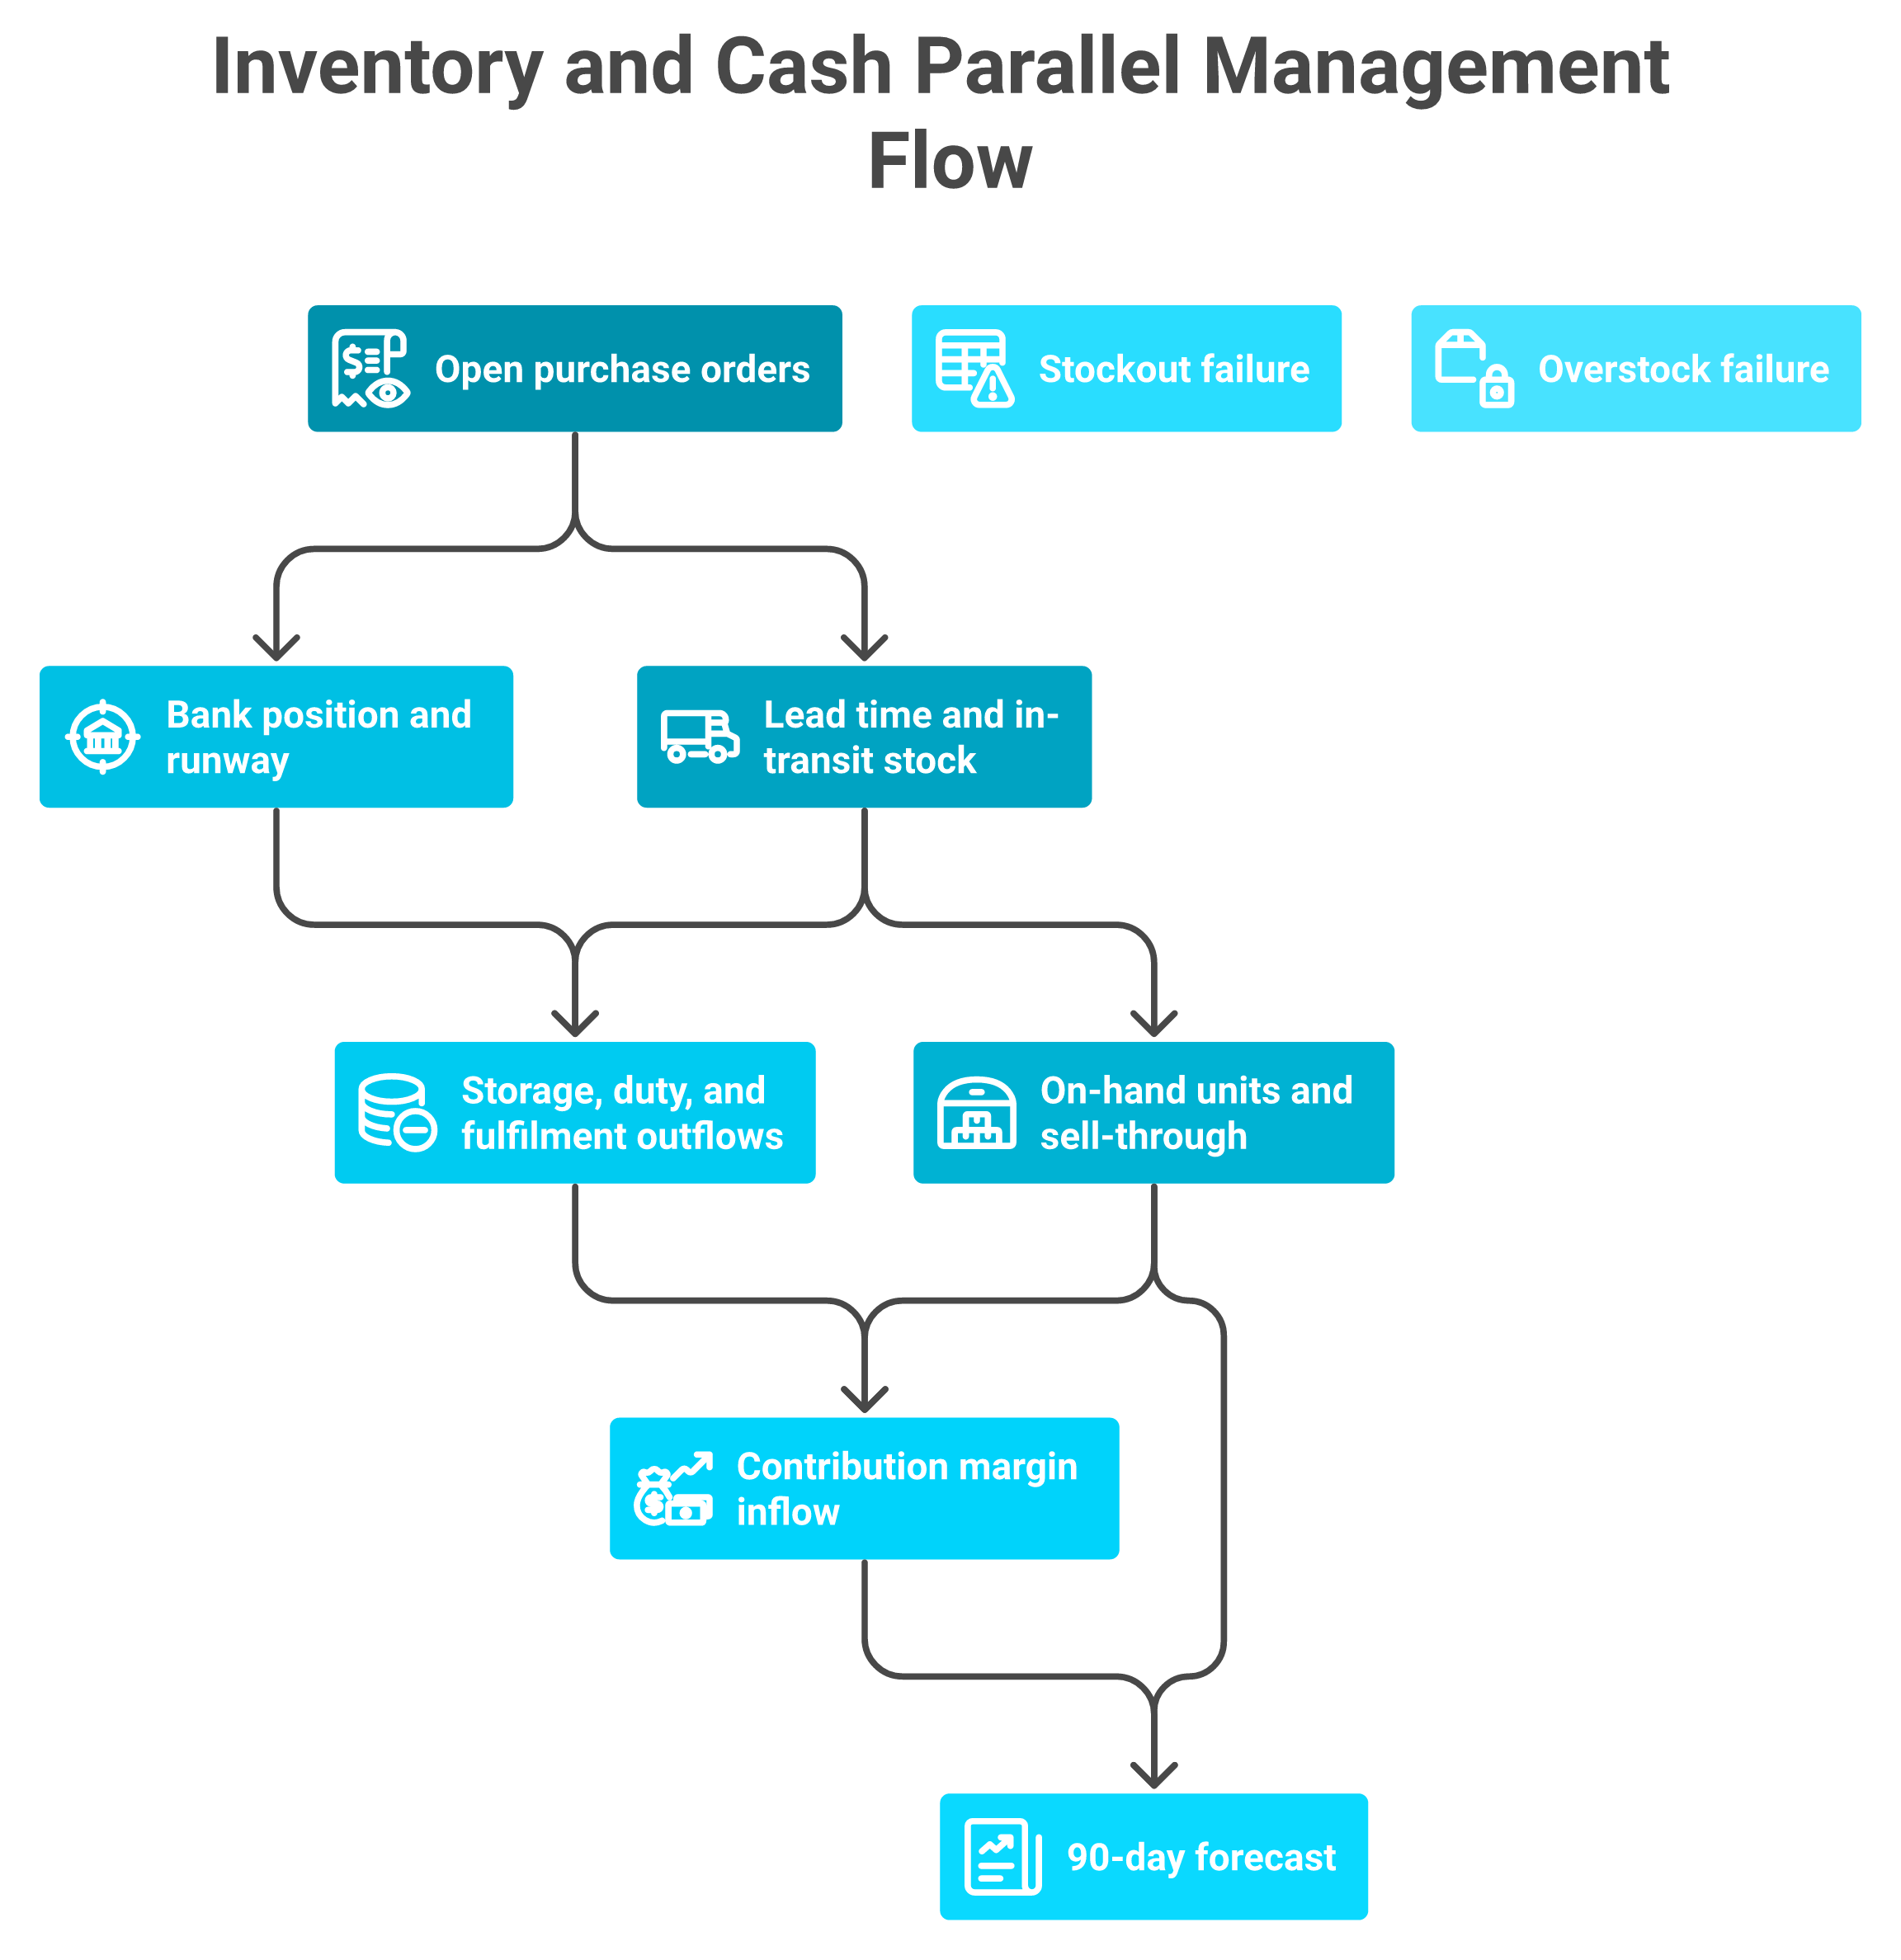
Inventory and cash are two train tracks that have to run in parallel, and your forecast is what keeps them aligned. The test of an analytics stack is not chart count but forecast accuracy. One agency reports 3% forecast accuracy across $4B in GMV, with monthly error held inside plus or minus 10%, as documented in its monthly forecast accuracy reporting. Meanwhile the average retailer runs about 6% inventory accuracy, which the IHL Group links to over $1 trillion in revenue distortion. Luca AI generates sales and cash forecasts from your historical data and simulates changes before you commit to them.
🚂 Two tracks, one derailment
Inventory and cash are two tracks on the same line. The forecast is what keeps them aligned, and forecast error is how you know it works.
Run the tracks apart and both failure modes cost real money. A stockout on your best SKU during a working campaign burns ad spend on traffic you cannot fulfil.
An overstock does quieter damage. Cash sits in a warehouse paying storage fees while your next product launch waits for funding. Luca AI connects inventory levels and bank position alongside commerce and ad data, so both tracks appear in the same view, which is the practical job of ecommerce inventory management.
💰 The sourcing trade-off nobody prices properly
Overseas manufacturing usually wins on unit cost. It also brings 3 to 6 month lead times, a larger warehouse footprint, and cash locked in containers at sea.
Local or regional sourcing often costs more per unit. A 7-day lead time means a smaller warehouse, lower fixed cost, and far less cash tied up in transit. Lowest unit cost is not lowest total cost, and the gap only shows up when you model it.
Overseas vs Local Sourcing Decision Inputs
Decision input
Overseas sourcing
Local sourcing
Gross margin
Higher
Lower
Lead time
3 to 6 months
Around 7 days
Warehouse footprint
Large
Small
Cash locked in transit
High
Minimal
Reorder flexibility
Low
High
✅ Build the forecast scorecard
Write a 90-day forecast with three lines: revenue, marketing spend, and contribution margin. Add a fourth for projected ending cash. Then log actuals monthly and record your error percentage. Our walkthrough on how to forecast cash flow for ecommerce covers the build in detail.
Your error rate is the only honest measure of whether your analytics stack works. A store holding error inside 10% can commit to inventory with confidence. A store that has never measured its error is guessing, regardless of how good the dashboards look.
⚠️ Simulate before you sign the PO
Luca AI lets you change a lead time, a price, or a reorder quantity in a simulation and reasons through the effect on cash position, inventory cover, and contribution margin together. That combination is the difference between a forecast and a guess.
Luca AI also sends reorder alerts from predicted sell-through rather than fixed thresholds, so the signal arrives with lead time still available, which is exactly what AI demand forecasting for ecommerce should deliver. My honest caveat is that forecasting needs history, so stores under roughly twelve months of order data should expect wider error bands at first.
Q9. Why do dashboards stop working past a certain stage? [toc=9. Beyond Dashboards]
A Head of Ecommerce at a £200M GMV group once told me what his Mondays used to look like. Exports from Shopify. Exports from the returns system. Paste, fix the broken formula, repeat. He said it makes him shudder now.
Dashboards stop working when the bottleneck moves from seeing numbers to deciding what to do about them. Static spreadsheets eat whole Mondays in compilation. Raw data lakes return logs nobody can decide from. Luca AI operates as a reasoning layer over the connected warehouse, returning the cause of a CAC spike and the recommended action rather than a chart of the spike.
❌ Three different failure modes
Spreadsheets fail on latency. The data is only as fresh as your last paste, so a dip that started Tuesday gets found at the Monday paste, six days of budget later. Our comparison of ecommerce analytics platforms maps that latency cost across each tool class.
Data lakes fail on interpretation. Raw cloud telemetry is logs, and logs do not make decisions. Dashboards fail on volume. One operator described pulling twenty executive summaries at 25 pages each from Klaviyo, Meta, Google, and GA4, then asking how to actually use any of it.
⚠️ Operators say this out loud
"When Triple Whale first launched, it was impressive due to its straightforwardness, clarity, and effectiveness. However, it has now become quite perplexing and is almost as complicated as Google Analytics." — Operator, July 2026, r/ecommerce Reddit Thread
"The recurring complaint is the one that matters most in analytics: accuracy. Attribution figures frequently differ from Shopify, Meta and Google, and merchants describe spending time deciding which source to trust for a given decision." — Verified merchant panel, 17 operators, 76% satisfied, 2026, Triple Whale Shopify App Store Verified Review Panel
Neither complaint is about missing features. Both are about the operator still doing the thinking. If you are weighing a switch for that reason, our rundown of Triple Whale alternatives sets out the trade-offs honestly.
✅ What replaces the dashboard
What Each Analytics Approach Returns, and What You Still Do
Approach
What it returns
What you still do
Luca AI (AI intelligence layer over the warehouse)
Answer, cause, and recommended action in plain English
Decide and execute
Attribution platforms (Triple Whale, Northbeam)
Channel-level attributed revenue and ROAS
Interpret, reconcile, decide
BI tools (Power BI, Tableau)
Charts you designed yourself
Model, build, maintain, interpret
Data warehouse plus analyst
Queried tables
Write SQL, hire the analyst
Spreadsheets
Last week's snapshot
Everything
Luca AI is trained on the relationships between ecommerce metrics, which is why it can connect a CAC spike to a shipping cost change and a return-rate shift in the same answer. Most analytics tools added AI on top of a dashboard. Luca AI is the AI layer itself, which is the distinction we draw in agentic analytics tools.
⭐ The build-versus-buy math genuinely changed
I know a team that spent roughly $10 million building a proprietary system to turn their data into meaning. Within two years, general language models outperformed it.
That is not a knock on their engineering. It is a timing fact, and it should change how you think about hiring a data team at $3M revenue. Luca AI replaces the junior ecommerce data analyst you were about to hire, not the senior operator making the call. We make that case in full in AI data analyst for ecommerce.
💸 Where this does not fit
Luca AI does not fit enterprises already running a data team with a mature warehouse. It also does not fit stores too early to have enough history to reason against. If you have six months of thin order data, buy nothing yet and tighten your tagging instead.
Q10. Which analytics stack fits your stage, and what does it cost? [toc=10. Stack By Stage]
Below roughly $30k a month in paid media, dedicated attribution tooling rarely pays for itself, and clean UTMs with a disciplined sheet will do. Paid analytics platforms price by revenue band, commonly from around $129 a month at entry to $219 and $749 at higher tiers, as listed on Triple Whale's own pricing page. Luca AI prices at $250, $500, and $750 per month across its Founder, Growth, and Scale plans. The licence is never the real cost. The cleanup year, the analyst, and the lost Mondays are.
💰 The three costs nobody budgets
First, the data cleanup year. Traditional warehouse and reverse ETL setups need cleaning, tagging, normalizing, and SQL maintenance before they answer one question. Our review of the best reverse ETL tools for ecommerce shows where that maintenance burden sits.
Second, the person who maintains it. Third, the compilation time you are already paying in Monday mornings. Luca AI normalizes and standardizes data on ingestion, which removes the first cost entirely.
⚠️ Operators on what the bill actually becomes
"we started with 100 per month with a Shopify setup running Google ads and meta ads. of course they upsell you and you have to go to 300 a month to get the attribution." — Shopify merchant, February 2022, r/shopify Reddit Thread
"Reviewers who use it for daily spend allocation consider it good value, while those treating it as a reporting dashboard alone repeatedly describe it as expensive." — Verified merchant panel, 2026, Triple Whale Shopify App Store Verified Review Panel
That second line is the real buying rule. A tool is worth its price only if a specific weekly decision changes because of it.
✅ The stage gate
Analytics Stack By Revenue Stage and Media Spend
Your stage
What to buy
Why
Under $1M revenue, under $10k/mo media
Nothing. UTMs, a sheet, and a cost model
Not enough data volume or spend to recover a subscription
$1M to $5M revenue, data piling up unused
Luca AI (Founder, $250/mo)
Cross-functional questions answered without hiring an analyst
$5M to $40M, multi-channel paid media
Luca AI (Growth or Scale) plus an attribution tool if spend exceeds ~$30k/mo
Different jobs: intelligence layer versus channel attribution
Enterprise with an existing data team
Keep the warehouse, skip the layer
The join is already built in-house
Luca AI is not a marketing attribution pixel and does not replace one. If your single biggest problem is channel-level credit at high spend, buy an attribution tool for that job. Where the problem is reasoning rather than credit, ecommerce business intelligence is the category to shop.
⏰ The honest trigger
Buy when a decision is waiting on data you cannot get. Reorder timing, a pricing call, a SKU you suspect is underwater. Luca AI earns its subscription when those questions get answered the same day instead of next quarter. That is the standard we apply across our use cases.
My read is that most $1M to $5M stores overpay for dashboards and underpay for reasoning. I hold that loosely, because a store with one channel and 40 SKUs genuinely may not need either yet.
Q11. What do the first 30 days of this discipline look like? [toc=11. 30-Day Operating Plan]
Week one, filter bots and normalize your sources before trusting a conversion rate. Week two, run the eight-cost audit on your top five SKUs by revenue and rank them by contribution margin. Week three, cut first-order cohorts by product category to find your real LTV lever. Week four, set alert thresholds on MER, CAC, and inventory, then write a 90-day contribution margin forecast. Luca AI delivers the weekly and monthly versions of these reports automatically, with the reasoning and recommendation attached.
Trailing 12-month distribution, open POs, cash position
Nothing here needs a replatform. Week two is the one that pays for the month. Our guide to tracking ecommerce unit economics covers that week line by line.
💰 What four weeks changed for one store
The kitchenware founder from earlier finished this sequence and made four moves. She raised the knife set from $49.99 to $59.99. She added an instructional video that cut returns from 18% to 9%.
She shifted ad spend to a higher-margin cutting board set and re-engineered packaging to save $0.80 per unit. The SKU went from losing $21.31 per order to a 23% contribution margin, which is the kind of move ecommerce growth strategy should start with rather than end with.
⚠️ Why the tool is not the discipline
Operators are right to be skeptical that software fixes this:
"It's unnecessary. It merely reiterates information that Meta has already provided." — Operator, July 2026, r/ecommerce Reddit Thread
"Triple Whale is a decent tracking tool. If you are on Shopify then there are better alternatives IMO." — Shopify merchant, February 2022, r/shopify Reddit Thread
Both are fair. No tool will run week two for you the first time. The audit requires you to read your own 3PL invoice line by line.
⏰ Month two is where this usually dies
Shipping rates move. Return rates swing with season. CAC drifts with auction pressure. Your audit expires in about thirty days, which is why this belongs on the calendar rather than in a project folder.
Luca AI keeps the cost model running against live data, sends the weekly report with reasoning, and pings you when a SKU's margin leaves its usual range. We built the push side because the discipline has to survive the weeks you are too busy shipping to open anything, which is the whole point of automated ecommerce reporting.
✅ One thing to do today
Pull your top five SKUs by revenue. Write the eight cost lines next to each one. If you cannot source a number, that gap is your first week of work.
I would genuinely like to hear what your audit surfaces, especially the SKU that turns out to be underwater. That result is almost never the one operators expect. Tell us what you are building and we will look at it with you.
FAQ's
What is ecommerce analytics, and which layers actually matter?
Ecommerce analytics is the practice of collecting, reconciling, and interpreting store, marketing, and financial data to decide where the next dollar goes. It operates in four layers, and they are not equally instrumented in most stores.
Behavioral: what visitors do on site, from GA4, Shopify, and session tools.
Attribution: what caused the order, from Meta, Google, and Shopify.
Customer: who returns and why, from Klaviyo and order history.
Financial: whether any of it made money, from your 3PL, processor, accounting, and helpdesk.
The first two layers are cheap to install, so they get all the attention. The financial layer requires joining invoices, settlements, return logs, and ticket volume, which nobody does by hand twice. That is why revenue grows while the bank balance does not.
Luca AI sits as an AI layer over your connected data warehouse, normalizing commerce, ads, accounting, banking, and operations sources on ingestion so the financial layer becomes answerable. We treat that join as the whole job, because "revenue" has to mean the same thing in Shopify, Stripe, and Xero before any margin number is trustworthy. If you want the fuller category framing, our guide to ecommerce business intelligence walks through how the layers connect in practice.
Why is gross margin a misleading number for DTC products?
Gross margin only tells you what it costs to make the thing. It tells you nothing about what it costs to sell the thing. Eight variable costs sit between the supplier invoice and actual profit, and they routinely turn a strong-looking product into a cash drain.
Run the arithmetic on one real example, a ceramic knife set priced at $49.99 with a $14.00 factory cost and 72% reported gross margin:
Landed cost including freight, duties, and brokerage: $17.75
Warehousing at 47 days average stay: $0.65
Pick, pack, and materials: $4.10
Dimensional-weight outbound shipping: $8.40
Payment processing: $1.75
Returns allocated at an 18% return rate: $6.20
Customer service allocated: $1.45
Customer acquisition cost: $31.00
Total cost reaches $71.30 against a $49.99 sale, a $21.31 loss on every unit sold.
Luca AI reasons across connected Shopify, ad platform, accounting, 3PL, and support data, so contribution margin by SKU becomes a question you ask rather than a model you rebuild each month. We also name the influencing components behind a margin move, which a static spreadsheet cannot do. The full comparison lives in contribution margin vs gross margin.
Why don't Shopify, Meta, and GA4 report the same revenue?
They measure different things, so they will never match. Expect a gap and manage it rather than chasing an exact reconciliation.
Shopify attributes last click server-side at checkout.
Meta credits a 7-day click and 1-day view window, and will claim a conversion it merely touched.
Google Ads back-fills conversions to the click date, so date-matching fails structurally.
GA4 depends on browser events, which drop when consent, ad blockers, or tag misfires intervene.
Before you blame attribution, fix your inputs. Merchants have reported sustained bot traffic approaching half of all sessions, which corrupts conversion rate before any model runs. Filter by country, user agent, and repeated URL parameter patterns first, then enforce UTM discipline.
The workable process is simple. Pick one financial source of truth, decide budgets on MER rather than platform ROAS, and log the percentage gap per channel weekly. After six weeks, you know your normal variance, so a real break stands out.
Luca AI holds spend, orders, fees, and refunds in one normalized layer and surfaces which source changed when variance leaves its usual range. We cover the profit consequence of getting this wrong in declining platform ROAS versus true profitability.
Which ecommerce metrics should you act on, and how often?
Act on eight metrics, and tier them by the decision they serve rather than tracking everything equally.
Conversion rate: orders divided by sessions, segmented by channel and device.
Net AOV: revenue minus shipping, discounts, and expected returns, divided by orders.
Revenue per visitor: the metric that settles most benchmark arguments.
Contribution margin: per SKU, never blended across the catalogue.
CAC: acquisition spend divided by new customers, by channel and product.
MER: total revenue divided by total marketing spend.
Repeat purchase rate and checkout abandonment, cut by first-product cohort and payment method.
Cadence matters as much as selection. Daily should be alert-driven, not dashboard-driven. Weekly belongs to MER, contribution margin by SKU, and return rate. Monthly is when unit economics, cohort LTV, and lead times get refreshed, using median rather than mean for lead times so one delayed container does not distort planning.
Luca AI monitors these continuously and pushes an alert to Slack or email when a metric leaves its normal pattern, with the reasoning and related movements attached. We built the push side because a notification without a cause is just noise. Our list of top ecommerce KPIs applies the same segmentation discipline.
What does an ecommerce analytics stack cost, and when is it worth buying?
Price the discipline, not the software. Below roughly $30k a month in paid media, dedicated attribution tooling rarely recovers its own cost, and clean UTMs with a disciplined cost model will do the job.
The three costs operators forget are larger than the licence:
The data cleanup year that traditional warehouse and reverse ETL setups require before answering one question.
The analyst who maintains the pipeline afterwards.
The Monday mornings already spent compiling exports by hand.
A practical stage gate looks like this. Under $1M revenue with under $10k monthly media, buy nothing and tighten tagging. Between $1M and $5M with data piling up unused, an intelligence layer earns its keep. Above $5M with multi-channel spend, pair that layer with an attribution tool, because they do different jobs.
Luca AI prices at $250, $500, and $750 per month across Founder, Growth, and Scale plans, and normalizes data on ingestion so the cleanup year disappears. We are also clear about fit: Luca AI does not suit enterprises already running a data team, nor stores with too little history to reason against. Compare the category honestly in our ecommerce analytics platforms breakdown.
Enjoyed the read? Join our team for a quick 15-minute chat — no pitch, just a real conversation on how we’re rethinking Ecommerce with AI - Luca
Loading Schedule...
Your AI Co-Founder is here.
Here’s why:
Shopify, Meta, Xero - one brain.
"Should I scale?" Answered with real data.
Growth capital. No applications. One click.
Thank you! Your submission has been received! Please book a time slot for the Meeting
Oops! Something went wrong while submitting the form.