9 Best Agentic Analytics Tools for Ecommerce Sellers ( DTC & Marketplace)
14
mins read
TL;DR
Agentic analytics tools monitor store data continuously, isolate root cause across ads, inventory, and finance, then recommend or execute, instead of waiting for you to open a dashboard.
Our nine picks: Luca AI, Triple Whale, Polar Analytics, Peel Insights, Daasity, Jungle Scout Cobalt, Helium 10, ThoughtSpot Spotter, and Microsoft Fabric with Power BI Copilot.
We scored on reasoning depth, autonomy, ecommerce data coverage, setup and normalization, and verified reviews, because prescriptive output is what changes a Monday decision.
Gross margin misleads. One hero SKU showing 72% gross margin held only 8% contribution margin once shipping, returns, ad spend, and support load were allocated.
Marketplace tooling stays largely pre-agentic in 2026, so hybrid brands need one layer that normalizes DTC and Amazon feeds into a single margin number.
Adoption alone proves nothing. Pilot one profit decision for 60 days and measure hours returned, decisions changed, and margin or stockout impact.
Q1. What Are the 9 Best Agentic Analytics Tools for E-commerce in 2026? [toc=1. Top 9 Tools]
Agentic analytics tools do not wait for you to open a dashboard. They watch your store's data, find the cause of a change, and tell you what to do next. I have spent the last year testing these nine platforms against real Shopify, Meta, and marketplace data. Some genuinely reason across marketing, inventory, and finance. Others simply added a chat box to old reporting. Below is the ranked list, the pricing, and the honest limits of each one.
The nine best agentic analytics tools for ecommerce in 2026 are Luca AI, Triple Whale (Moby), Polar Analytics, Peel Insights, Daasity, Jungle Scout Cobalt, Helium 10, ThoughtSpot Spotter, and Microsoft Fabric with Power BI Copilot. Luca AI leads as an AI reasoning layer over your store's data: it pulls the relevant slice for a situation, isolates root cause, predicts from history, and pushes reports into Slack or email on a schedule.
Triple Whale, best for DTC marketing attribution with agent-run recurring analysis
Polar Analytics, best for a managed Snowflake warehouse without a data team
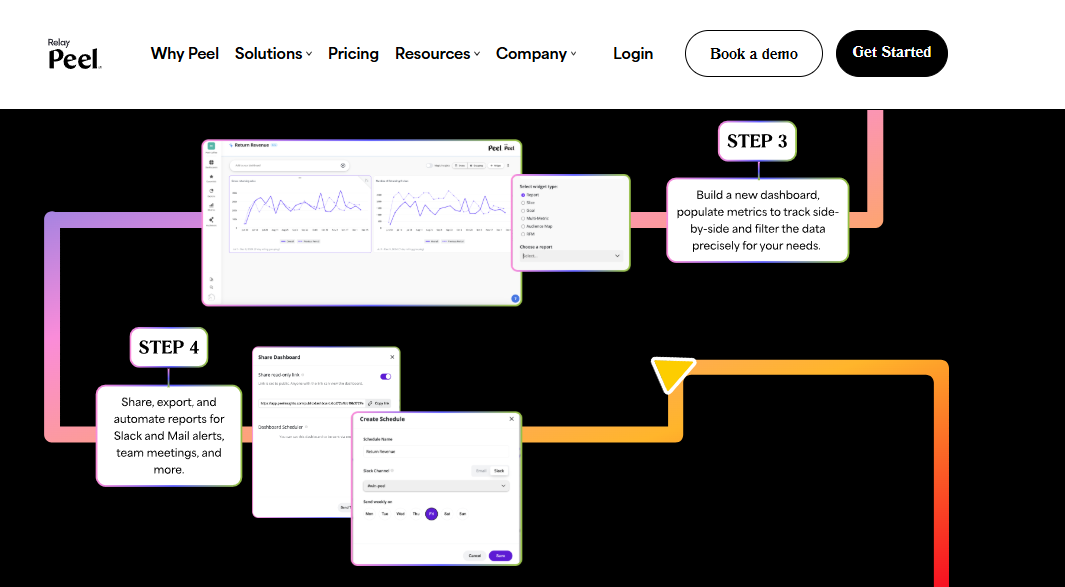
Peel Insights, best for automated cohort and retention analytics
Daasity, best for multi-channel data modelling on your own warehouse
Jungle Scout Cobalt, best for Amazon category and share-of-voice intelligence
Helium 10, best for Amazon PPC and listing-level optimisation
ThoughtSpot Spotter, best for enterprise natural-language BI
Microsoft Fabric with Power BI Copilot, best for brands already inside the Microsoft stack
9 Best Agentic Analytics Tools for E-commerce in 2026
Tool
Key Capabilities
Best For
Pricing
Luca AI ⭐⭐⭐⭐⭐
Unified data across 200+ connectors, plain-English questions, root cause analysis, predictive reorder and sales alerts, scheduled reports to Slack, email, and mobile
DTC and hybrid brands doing $1M to $5M who have data but no analyst
Larger retailers with a data team and a governed semantic model
Quote-based, contact sales
Microsoft Fabric + Power BI Copilot ⭐⭐⭐
Lakehouse storage, Copilot report generation, data agents, Azure-native governance
Brands already standardised on Microsoft and Azure
Quote-based, Fabric capacity plus Power BI licences
1.1 Luca AI [toc=1.1 Luca AI]
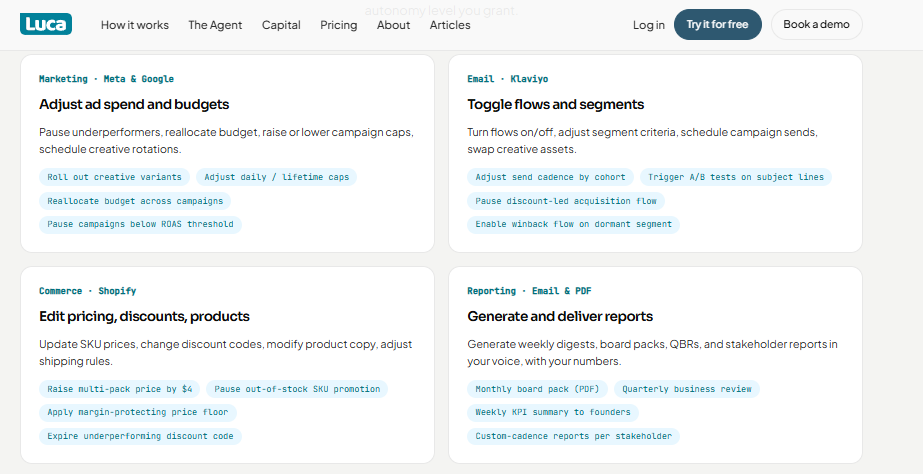
Luca AI executes budget, email, pricing, and reporting actions within the autonomy level you grant.
🧠 Why did we choose this tool?
I put Luca AI first, and I will be direct about my bias: I founded it. The reason it leads is architectural, not personal. Luca AI reasons across marketing, inventory, and finance in one context instead of one channel.
Most tools on this list answer questions inside a single function. That is why founders end up doing the triangulation themselves at 11pm in a spreadsheet. Luca AI was built to remove that manual step, which is the same logic behind our approach to agentic AI for ecommerce founders.
📊 Core Evaluation Metrics
Autonomy level: L2, recommends and monitors continuously, human approves action
Data coverage: 200+ native connectors including Shopify, Meta, Google, Klaviyo, and Xero
Reasoning scope: Sales, marketing, product, profit, customer, and operations
Alert delivery: Slack, email, and mobile app on a schedule you define
Setup time: Normalisation happens on ingestion, so no cleanup project first
⚙️ Solutions Offered
Single source of truth across every connected store, ad, and finance source, built on ecommerce data integration
Plain-English questions answered without SQL, an analyst, or dashboard building
Root cause analysis that names the influencing components behind a metric move
Predictive reorder alerts, sales forecasts, and product-level profit analytics
Automated periodic reports with reasoning and recommendations, not just charts
✅ Best For
Ecommerce brands between $1M and $5M in revenue with piled-up unused data
Teams with no data analyst and no appetite for a warehouse project
💰 Case Study
What was the problem? A founder-led DTC brand (name withheld under NDA) treated one product as its hero SKU. Gross margin on paper was 72%. Cash in the bank kept telling a different story.
How did Luca AI help? Luca AI allocated every real cost against that SKU, including shipping, returns, discounts, ad spend, and support load. It surfaced that 42% of all customer service tickets traced to that single product, roughly $1.45 per unit in hidden cost.
What was the outcome? True contribution margin on the hero SKU was 8%, not 72%. The team cut paid spend behind it, repriced, and redirected budget to two quieter SKUs with better real margin. The founder's words afterwards were blunt: the dashboard had been hiding a money pit for months. ⚠️
💸 Pricing
[ Starter, €299 / Month | Growth, €499 / Month | Scale, Custom Pricing ]. Current tiers are listed on the Luca AI pricing page.
Luca AI normalizes and standardizes data on ingestion, which is why the first useful answer arrives in days rather than after a data-cleanup year. Plug in, ask, act.
1.2 Triple Whale [toc=1.2 Triple Whale]
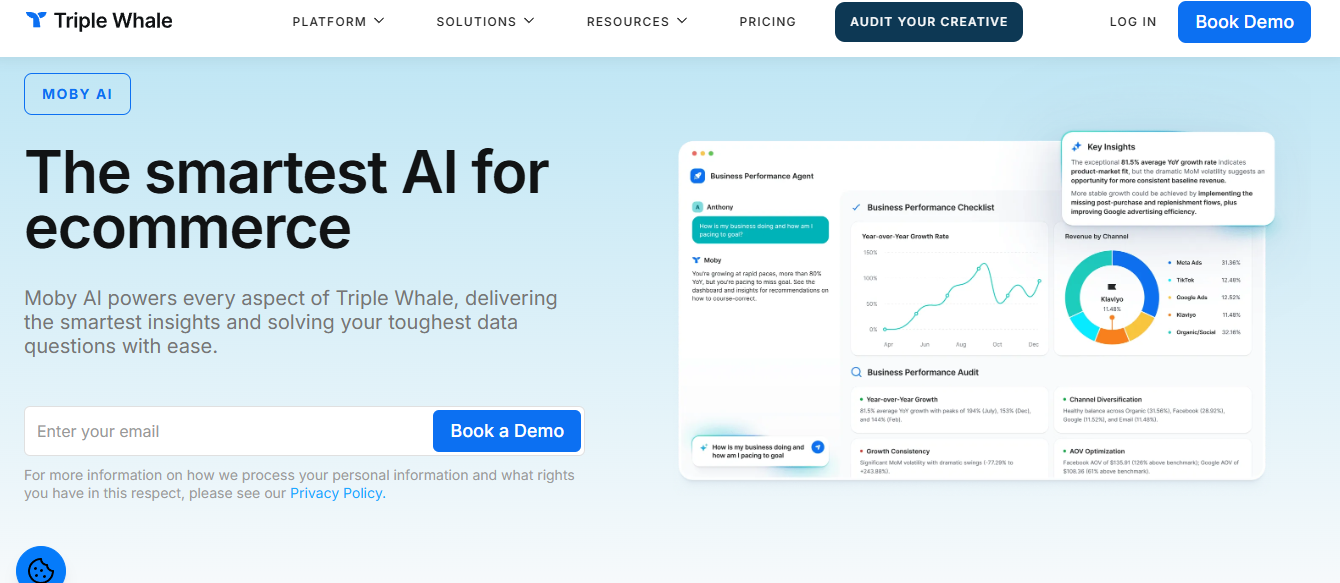
Triple Whale's Moby AI agent audits business performance and surfaces channel-level insights for DTC brands.
🐳 Why did we choose this tool?
Triple Whale earned its place because Moby is real agentic work, not a chat wrapper. Moby 2 reached general availability on 19 May 2026.
The platform's Triple Pixel remains the most widely adopted first-party attribution layer in DTC. If your core question is which ad drove the sale, this is the strongest tool here, and we cover the wider field in our guide to Triple Whale alternatives.
📊 Core Evaluation Metrics
Autonomy level: L2 to L3, though execution needs the Moby AI Pro add-on
Data coverage: Shopify, Meta, Google, TikTok, and Klaviyo, plus warehouse sync on higher tiers
Reasoning scope: Marketing, creative, cohort, and retention analytics
Alert delivery: In-app, Slack, and email anomaly notifications
Setup time: Pixel install plus attribution tuning, typically one to two weeks
🔧 Solutions Offered
Multi-touch attribution built on the Triple Pixel with unlimited lookback on paid tiers
Moby agent template library covering media buying, retention, and conversion
Creative Cockpit for ad-level creative performance analysis
Cohort, subscription, and product analytics with a no-code dashboard builder
Anomaly detection that flags metric swings before they hit revenue
✅ Best For
DTC brands running paid media across three or more channels
Brands above roughly $1M GMV, since pricing scales with GMV bands
⭐ Reviews
"Triple Whale is very user-friendly and easy to navigate to find the data you need across multiple channels. Relevant channels like emails, ads, organic, etc are already broken down for you and when looking at the specific channel, you have the option to customize the table displaying the data to choose which metrics are most relevant for your needs." — Verified User, Ecommerce Marketing Triple Whale - G2 Verified Review
"Some data we still notice discrepancies between platforms, for example, tracking ads, and differences in the reported metrics like revenue. Or with our emails/sms platforms about what revenue is attributed to which channel, for example, Triple Whale will attribute more revenue to the email that was sent out, but the platform will attribute more revenue to the SMS that was sent out." — Verified User, Ecommerce Marketing Triple Whale - G2 Verified Review
❌ Where It Breaks
Pricing climbs hard with GMV. Foundation starts at $219 per month at the lowest band and reaches $2,529 at $15M to $20M GMV, while Automate starts at $749.
The named Moby Specialists (Media Buyer, Creative Director, and Conversion Optimizer) were still marked "Coming Soon" on Triple Whale's own blog as of mid-2026. Finance visibility also stays thin, so unit economics tracking still lands back in your spreadsheet.
💸 Pricing
Free, $0 / Month | Foundation, from $219 / Month | Automate, from $749 / Month | Enterprise, Custom.
Luca AI takes a different route on the same problem: instead of attributing revenue to a channel, it reasons across channel spend, stock cover, and landed cost together, then names the driver behind the margin move. That difference is the reason our use cases start with profit questions rather than attribution windows.
1.3 Polar Analytics [toc=1.3 Polar Analytics]
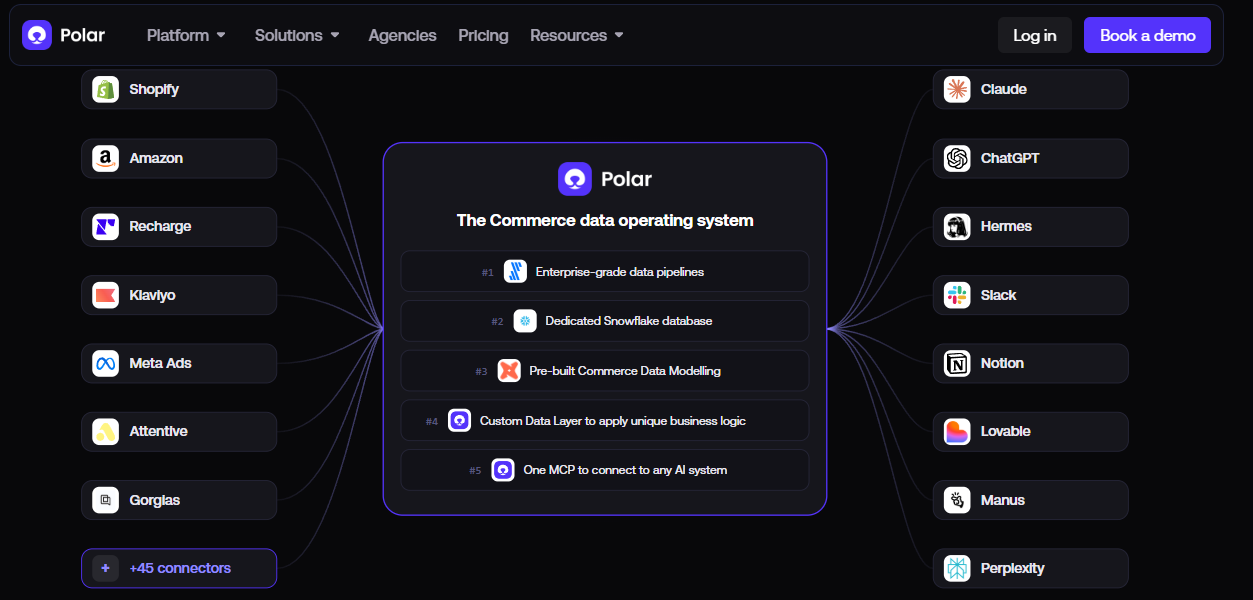
Polar Analytics routes commerce data into a dedicated Snowflake database and external AI systems.
🧊 Why did we choose this tool?
Polar Analytics gives every brand its own Snowflake database, which is rare at this price tier. That means your data is warehouse-grade without hiring an engineer.
The AI layer sits on top of that warehouse and answers metric questions in plain language. Unlimited users on all plans also matters for teams where three people need the same numbers, which is a recurring theme across ecommerce analytics platforms.
📊 Core Evaluation Metrics
Autonomy level: L1 to L2, insight surfacing with alerts, human decides
Data coverage: Shopify, ad platforms, email, and retail sources, plus first-party pixel
Reasoning scope: Marketing, revenue, retention, and product reporting
Alert delivery: In-app, Slack, and email notifications
Setup time: Weeks, since advanced features need learning time
⚙️ Solutions Offered
Dedicated Snowflake database per brand with unlimited seats
First-party pixel for cleaner session and conversion data
Custom metric builder for blended CAC, MER, and contribution views
Prebuilt DTC report templates across acquisition, retention, and email
Dedicated success manager on all published plans
✅ Best For
DTC brands that want warehouse ownership without a data hire
Teams with three or more people pulling the same reports weekly
"Shortly after onboarding we were assigned an account manager. About a month later, she was laid off and we were never assigned a new account manager. I have the direct email of a support specialist, but the response time has been less than ideal, especially when real-time data is important for our team. We've been attempting to get a handful of other data sources connected (ShipHero and Walmart at this moment) and the process has been long and drawn about because it can take up to a week to hear back from the Polar team." — Ben S., Director of Commercial Operations Polar Analytics - G2 Verified Review
"They have not basic features in place like a line chart Year on Year comparison of revenue etc. I've also reported an issue with inventory levels, as our inventory is multiplied with 6, since we have 6 different shopify stores connected to the same warehouse. Not really rocket science. But it has taken them closer to 1,5 month, and I've still not received a solution." — Maja, Verified Buyer Polar Analytics - TrustPilot Verified Review
❌ Where It Breaks
Pricing is quote-based, and one reviewer reported the Shopify app quote differing sharply from the sales quote. Support responsiveness is the recurring complaint, not the data model.
💸 Pricing
Quote-based, all plans include a dedicated Snowflake database and unlimited users.
1.4 Peel Insights [toc=1.4 Peel Insights]
Peel Insights automates cohort dashboards and scheduled Slack alerts for repeat-purchase brands every week.
🍊 Why did we choose this tool?
Peel Insights earns its slot on retention math, which most agentic tools treat as an afterthought. Cohort analysis (grouping customers by first purchase month) runs automatically here.
For subscription and consumable brands, repeat rate drives everything. Peel builds those views without a spreadsheet exercise, which is the same job we describe in our guide to ecommerce customer lifetime value.
📊 Core Evaluation Metrics
Autonomy level: L1, automated insight surfacing and anomaly notes
Data coverage: Shopify, ad platforms, email, and subscription apps
Reasoning scope: Retention, cohort, LTV, and product repurchase behaviour
Alert delivery: Email and Slack digests
Setup time: Days, since it installs as a Shopify app
⚙️ Solutions Offered
Automated cohort and repeat-purchase reporting
Customer lifetime value tracking by acquisition source
Product-level repurchase and cross-sell analysis
Anomaly notes on retention and revenue shifts
Scheduled digests for founders who will not log in daily
Brands under $5M that need retention clarity, not attribution debate
Worth noting where operator opinion actually sits on this layer:
"Shopify's own analytics are good enough on their own for most stores." — Verified User, r/ShopifyeCommerce Reddit Thread
❌ Where It Breaks
Peel stays inside the customer and retention lane. Inventory, landed cost, and cash timing sit outside its reasoning, so finance questions still leave the tool.
💸 Pricing
Quote-based.
1.5 Daasity [toc=1.5 Daasity]
🏗️ Why did we choose this tool?
Daasity is the most honest tool here about what it is. It builds ecommerce data models inside your own warehouse rather than replacing it.
That appeals to brands who already bought Snowflake or BigQuery and want ecommerce logic on top. It is infrastructure first, intelligence second, which is a very different bet from the reverse ETL tools most brands compare it against.
📊 Core Evaluation Metrics
Autonomy level: L1, modelled data with scheduled reporting, humans analyse
Data coverage: Shopify, Amazon, ads, email, 3PL, and ERP sources
Reasoning scope: Multi-channel revenue, marketing, and operations modelling
Alert delivery: Reports through your chosen BI tool
Setup time: Longest on this list, since it is a data project
⚙️ Solutions Offered
Prebuilt ecommerce ELT pipelines and data models
Warehouse ownership with BI-tool-agnostic output
Multi-channel blending across DTC, wholesale, and marketplace
Custom metric definitions maintained centrally
Analyst support services alongside the platform
✅ Best For
Brands above $10M with an analyst or agency partner
Teams running DTC, wholesale, and Amazon side by side
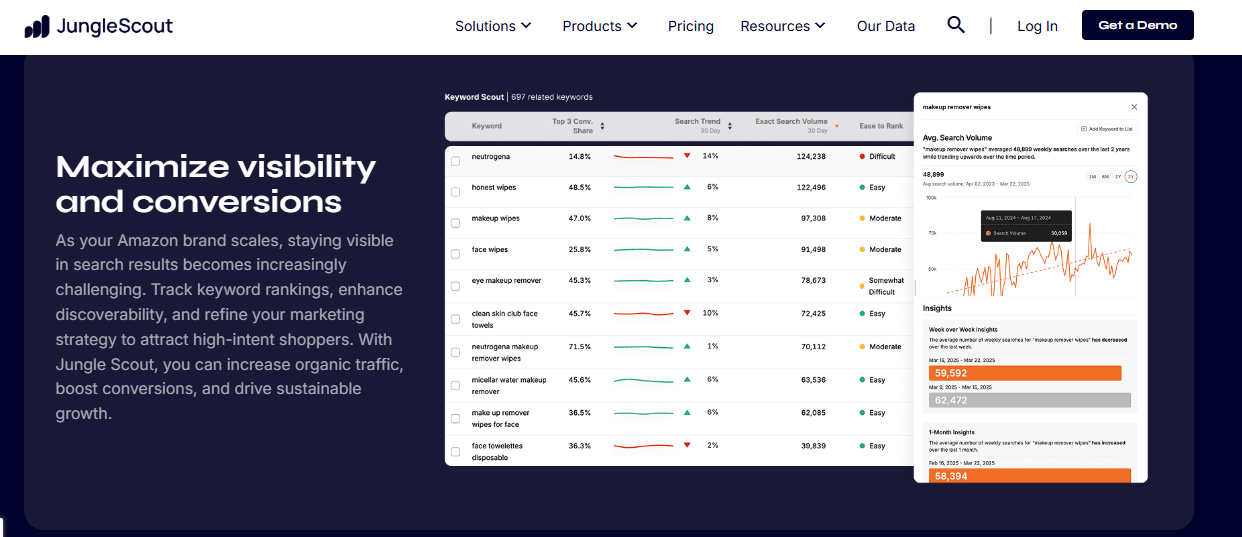
Jungle Scout tracks Amazon keyword trends and conversion share, though execution still stays manual.
🔍 Why did we choose this tool?
Cobalt is the strongest category-level view of Amazon available to brands. It tracks share of voice, digital shelf position, and market trends across a category.
For a brand fighting for placement, that outside-in view is something no DTC tool provides. It answers what the market did, not just what your account did, which complements Amazon brand analytics on your own account.
📊 Core Evaluation Metrics
Autonomy level: L1, alerts and trend detection, execution stays manual
Data coverage: Amazon marketplace data, category and competitor level
Reasoning scope: Category share, digital shelf, keyword, and pricing trends
Alert delivery: In-app alerts and scheduled exports
Setup time: Days, with onboarding support on Cobalt tier
⚙️ Solutions Offered
Category and share-of-voice intelligence across Amazon
Digital shelf and search placement tracking
Competitor pricing and assortment monitoring
Market trend detection at segment level
Reporting built for brand and agency teams
✅ Best For
Amazon brands and aggregators above $5M annually
Agencies managing several seller accounts
Category managers who buy based on market share, not gut
⭐ Reviews
"I believe the biggest downside of JS Cobalt is not having enough time to find the virtually unlimited number of insights it provides." — Verified User, Brand Management Jungle Scout Cobalt - G2 Verified Review
"cant think of anything that i actually dislike, so i guess i will say not having the same data and insights for other marketplaces such as walmart" — Verified User, Brand Management Jungle Scout Cobalt - G2 Verified Review
❌ Where It Breaks
Jungle Scout's AI Assist still centres on listing copy, and autonomous opportunity detection was only promised for the second half of 2026. Walmart and other marketplaces remain thin per reviewers.
Helium 10 is the execution suite of the Amazon world. Adtomic automates PPC bid changes, which is genuine action rather than reporting.
Nothing else on this list moves an Amazon bid for you. For sellers whose profit lives in ad efficiency, that matters, and it belongs in any serious ecommerce tech stack review.
📊 Core Evaluation Metrics
Autonomy level: L2 to L3 inside PPC, with rules and human review
Data coverage: Amazon Seller Central, ads, keywords, and inventory
Reasoning scope: Listings, keywords, PPC, and profit dashboard
Alert delivery: In-app alerts, email, and inventory notifications
Setup time: Days, though the toolset takes weeks to learn
⚙️ Solutions Offered
Adtomic PPC automation with rule-based bid management
Keyword research, reverse ASIN, and listing optimisation
Inventory and restock alerts
Profit dashboard with fee and refund tracking
Market Tracker for competitor and category monitoring
✅ Best For
Amazon sellers spending meaningfully on PPC
Private label brands managing many ASINs
Sellers who want research and execution in one login
⭐ Reviews
"Higher prices than other similar softwares. Also dashboard is somewhat hard to navigate through." — Verified User, Amazon Seller Helium 10 - G2 Verified Review
"They're trying to become an all-in-one platform by adding reimbursement services, advertising management, and other features that feel mediocre compared to their core strengths." — Verified User, Amazon Seller Helium 10 - G2 Verified Review
❌ Where It Breaks
Pricing rose in 2026, with plans running roughly $129 to $359 per month, a 2% fee on managed PPC spend, and Elite at $1,597. Reviewers also flag declining support quality.
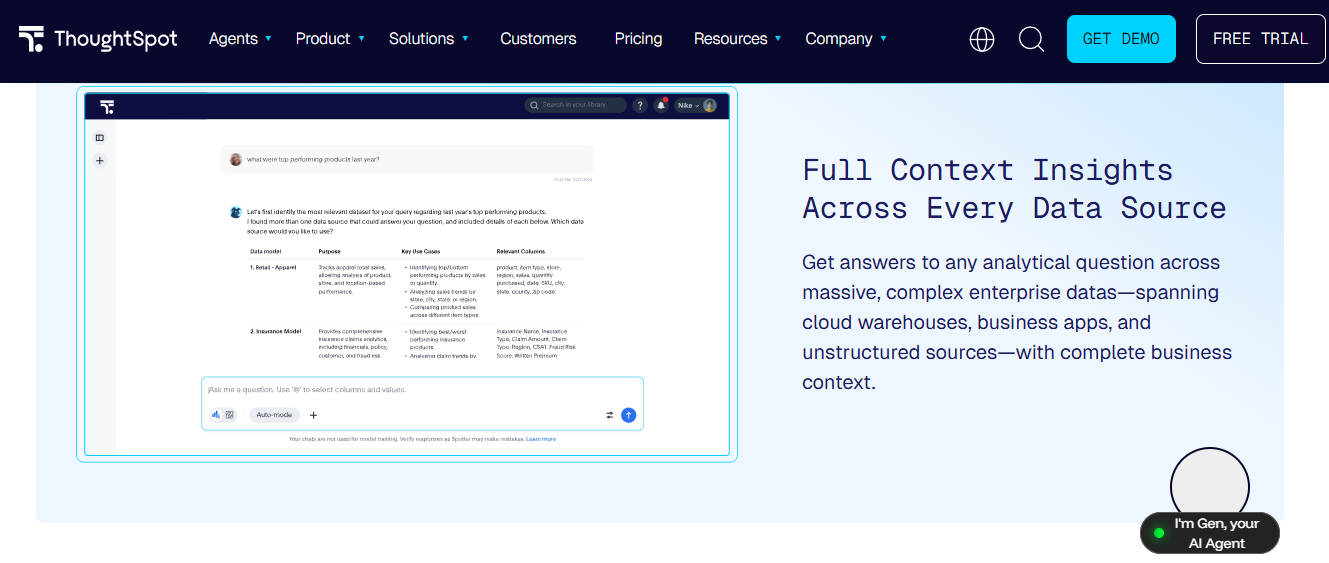
ThoughtSpot Spotter reasons across warehouse data models, but a governed semantic layer comes first.
🛰️ Why did we choose this tool?
ThoughtSpot Spotter is the most technically advanced agentic layer on this list. It queries your warehouse directly and generates insights conversationally, and G2 rates the platform 4.4 out of 5.
Reviewers specifically praise the Spotter and agentic features. This is enterprise BI that finally talks back, and it sets the bar for conversational analytics in retail.
📊 Core Evaluation Metrics
Autonomy level: L2, agent-generated insights and change analysis
Data coverage: Cloud warehouses (Snowflake, BigQuery, and Redshift), not ecommerce apps directly
Reasoning scope: Whatever your semantic model defines
Alert delivery: Liveboard alerts and scheduled pins
Setup time: Months, since the semantic model comes first
⚙️ Solutions Offered
Natural-language search across warehouse data
Spotter agent for conversational analysis and follow-up questions
Change analysis explaining metric movement
Liveboards with monitoring and alerting
Governed semantic layer for consistent metric definitions
✅ Best For
Retailers above $50M with a data team in place
Companies already running Snowflake or BigQuery
Organisations needing governance and audit trails
⭐ Reviews
"I really like the Conversational AI, Agentic features, and the Spotter functionality of ThoughtSpot." — Verified User, Data Analytics ThoughtSpot - G2 Verified Review
"I think it's very difficult to learn how to use ThoughtSpot. It takes a long time to really learn it, and I'm still not even close to where I want to be proficiency-wise." — Verified User, Data Analytics ThoughtSpot - G2 Verified Review
❌ Where It Breaks
Costs rise as query consumption grows, and reviewers call the pricing structure expensive. There is no Shopify or Meta connector waiting for you, so a warehouse and a modeller are prerequisites.
💸 Pricing
Quote-based, consumption-linked, contact sales.
1.9 Microsoft Fabric with Power BI Copilot [toc=1.9 Fabric + Power BI Copilot]
🪟 Why did we choose this tool?
Power BI is on this list because millions of finance teams already live in it. Fabric adds lakehouse storage and data agents underneath the reporting layer.
If your accountant, your CFO, and your board already use Microsoft, the switching cost argument disappears. Copilot then drafts reports from prompts, which is why it shows up in most AI-powered BI tool shortlists.
📊 Core Evaluation Metrics
Autonomy level: L1 to L2, Copilot assists and data agents answer queries
Data coverage: Any source you pipe into Fabric, no native ecommerce connectors
Reasoning scope: Whatever your model covers, finance strength is real
Alert delivery: Power BI alerts, Teams, and email subscriptions
Setup time: Months for a full Fabric implementation
⚙️ Solutions Offered
Lakehouse storage and pipelines inside Fabric
Copilot-generated reports, visuals, and DAX suggestions
Data agents for natural-language querying over modelled data
Enterprise governance, row-level security, and Azure integration
Deep Excel interoperability for finance teams
✅ Best For
Brands standardised on Microsoft 365 and Azure
Finance-led teams that report to a board monthly, often alongside ecommerce reporting workflows
Companies with IT support available for setup
⭐ Reviews
"user-friendly interface, interactive dashboards, and strong integration with other Microsoft products like Excel and Azure. Its ability to connect to various data sources, create compelling visualizations, and share insights easily are also key strengths." — Verified User, Business Intelligence Microsoft Power BI - G2 Verified Review
"Power BI can become slow with very large datasets, and complex DAX formulas have a steep learning curve. Also, advanced customization of visuals and version control for reports could be improved." — Verified User, Business Intelligence Microsoft Power BI - G2 Verified Review
❌ Where It Breaks
Someone still has to build the model, write the DAX, and maintain refreshes. For a five-person DTC team, that person does not exist, which is why Copilot ends up summarising a dashboard nobody trusts yet.
💸 Pricing
Quote-based, Fabric capacity plus Power BI licences.
Luca AI sits at the opposite end of that trade-off. Instead of asking a brand to build the model first, it normalizes and standardizes data on ingestion, then answers the margin or inventory question in plain English within days of connecting Shopify, Meta, and the finance stack. You can see how that reasoning runs in our use cases.
Q2. How Did We Score and Rank These Agentic Analytics Tools? [toc=2. Scoring Methodology]
Every tool here was scored across five weighted criteria: Reasoning Depth across sources (30%), Autonomy and Proactive Delivery (20%), Ecommerce Data Coverage including marketplace feeds (20%), Setup and Data Normalization (15%), and Verified User Reviews (15%). Star bands follow the total, from one star at the bottom to five at the top. Luca AI earned five stars on the strength of cross-source reasoning.
⚖️ Why Generic BI Scorecards Fail Ecommerce
Most agentic analytics rankings score for enterprise data teams. They weight governance, semantic modelling, and warehouse architecture heavily.
Those things matter at $200M. At $3M, with four people and no analyst, they are the reason a tool never gets used. I weighted for what actually changes a decision this week, which is the same lens we apply across ecommerce analytics platforms.
📊 The Five Criteria and Their Weights
Scoring Criteria and Weights for Agentic Analytics Tools
Criterion
Weight
Disqualifying Failure
Reasoning Depth across sources
30%
Cannot connect ad spend to stock cover to landed cost in one answer
Autonomy and Proactive Delivery
20%
Waits for you to log in and ask
Ecommerce Data Coverage
20%
No native Shopify, ads, email, or marketplace connectors
Setup and Data Normalization
15%
Requires a schema-mapping project before the first answer
Verified User Reviews
15%
Support or accuracy complaints that repeat across platforms
Reasoning Depth carries the most weight for one reason. Prescriptive output is the only thing that changes a Monday decision. Everything else is plumbing.
🔧 Why Setup Earned Its Own Criterion
Schema chaos is not a footnote. It is the reason data projects die. One brand's system calls a fiscal period "554" while another calls the same period "332."
Somebody has to reconcile that before any agent reasons correctly. Luca AI normalizes and standardizes data on ingestion, which is why it scored full marks on this criterion while warehouse-first tools did not, and it is why we treat ecommerce data integration as a product problem rather than a services project.
Reviewer evidence backed this weighting rather than my opinion:
"I think it's very difficult to learn how to use ThoughtSpot. It takes a long time to really learn it, and I'm still not even close to where I want to be proficiency-wise." — Verified User, Data Analytics ThoughtSpot - G2 Verified Review
"Power BI can become slow with very large datasets, and complex DAX formulas have a steep learning curve. Also, advanced customization of visuals and version control for reports could be improved." — Verified User, Business Intelligence Microsoft Power BI - G2 Verified Review
⭐ How the Star Bands Were Set
Stars map directly to the weighted total, in five equal bands. One star sits at the bottom band, five at the top.
Verified review scores fed the last criterion using current public ratings, including ThoughtSpot at 4.4 out of 5 on G2. Autonomy was graded on an L1 to L3 ladder, where L1 recommends and L3 executes within limits.
🔁 How to Reweight This for Your Own Stack
My weights are not yours. If you sell only on Amazon, push Ecommerce Data Coverage to 30% and cut Reasoning Depth, because your data is thinner and partly read-only.
If you already own Snowflake and employ an analyst, drop Setup to 5% and raise Autonomy. Ask Luca AI, or any vendor on this list, to run your top three recurring questions during the trial, then score what came back against your own ecommerce KPIs.
I could be reading Reasoning Depth too strongly here. It reflects what surfaces repeatedly in Luca AI's own deployments, where the questions that stall teams are cross-functional, not channel-level. My read may skew toward brands that already tried a dashboard and quit.
Luca AI scored highest on Reasoning Depth because one question can traverse ad spend, stock cover, and landed cost without an analyst stitching three exports together first. That single trait, more than pricing or polish, decided the order of this list, and you can see the reasoning method in how Luca thinks.
Q3. What Exactly Is Agentic Analytics, and Where Does It Sit on the Autonomy Ladder? [toc=3. Agentic vs Dashboards]
Agentic analytics is software that pursues a goal instead of answering a question. A dashboard shows what happened, a copilot answers when prompted, and an agent monitors continuously, diagnoses root cause across ads, inventory, and finance, then recommends or executes. Autonomy runs L1 recommend, L2 recommend and await approval, and L3 execute within limits. The practical test: does it contact you before you log in?
🧭 Dashboard, Copilot, or Agent
The three get sold as one category. They are not.
Dashboard vs Copilot vs Agent
Type
What it does
What it needs from you
Dashboard
Displays what already happened
You know which question to ask
Copilot
Answers or summarises on prompt
You start every conversation
Agent
Watches, diagnoses, and recommends continuously
You set the goal and the limits
Luca AI pushes customized reports into Slack, email, or mobile on a schedule you define, which is the behaviour that separates the third row from the first two.
🪜 The Autonomy Ladder in Store Terms
L1, recommend. The system flags that customer acquisition cost, meaning the cost to win one new customer, rose 22% week over week. You investigate.
L2, recommend and await approval. It names the campaign, the creative, and the audience overlap causing the rise, then proposes a spend shift. You approve.
L3, execute within limits. It moves budget itself, inside thresholds you set. Very few tools for sellers operate honestly at L3 today, which is worth remembering when you evaluate agents for ecommerce.
📉 Why Static Dashboards Keep Failing
Dashboards answer questions you already thought to ask. That is the flaw, not the refresh rate.
The trust problem is worse. Operators report their own tools disagreeing with each other, which is how the Monday morning spreadsheet ritual starts:
"Sampling, sampling, sampling. For a data and algorithm based company, Google does a terrible, terrible job of estimating reality out of the sampling they do. When we switched to an enterprise web analytics solution that does no sampling, we found that Google Analytics was telling us we had twice as much traffic as we actually do." — Gitai B., Marketing, Web Analytics, and Testing Lead Google Analytics - G2 Verified Review
"Some data we still notice discrepancies between platforms, for example, tracking ads, and differences in the reported metrics like revenue. Or with our emails/sms platforms about what revenue is attributed to which channel." — Verified User, Ecommerce Marketing Triple Whale - G2 Verified Review
🧱 The Real Cost of Descriptive Monitoring
One operator who ran roughly £200 million in gross merchandise value over five years described his early years as almost entirely Excel based. Exports from Shopify, exports from the returns system, reconciled by hand.
That is not a tooling gap. It is a reasoning gap. Monitoring tells you the number moved. It never tells you which two things caused it, which is the gap we unpack in our piece on declining platform ROAS versus true profitability.
✅ The One Question to Ask on a Demo
Skip the feature tour. Ask the vendor to show you an alert their system sent a customer last week, unprompted, that changed a decision.
If they show you a dashboard instead, you are buying descriptive analytics with a chat box. Ask Luca AI the same question, and the answer arrives as a scheduled report with the reasoning attached, not a chart you still have to interpret.
I will hedge one thing. Luca AI's read is that L3 autonomy over ad budgets is oversold for sub-$10M brands right now, though I might be too cautious. Approval steps cost seconds and prevent expensive mistakes.
Luca AI sits at the prescriptive end of that ladder. It isolates the influencing components behind a metric move, then delivers that finding where the team already works, instead of waiting for someone to remember to check a tab.
Q4. What Should an Agentic Analytics Tool Actually Do for Your Store? [toc=4. Must-Have Capabilities]
A capable agentic analytics tool delivers nine things: continuous anomaly detection, cross-source root-cause isolation, contribution margin per SKU, inventory and stockout forecasting, scenario simulation before you commit spend, creative-fatigue detection, cohort lifetime value tracking, AI-referred traffic measurement, and scheduled report delivery into Slack or email. Anything that only narrates a dashboard in sentences is a copilot wearing an agent's label.
🧾 The Nine-Capability Checklist
Continuous anomaly detection. Ask: show me an alert you sent unprompted last week.
Cross-source root-cause isolation. Ask: which two inputs caused this margin drop?
Contribution margin per SKU. Ask: does this include returns, shipping, and support cost?
Inventory and stockout forecasting. Ask: when do I reorder, at what quantity?
Scenario simulation. Ask: what happens to blended margin if I cut this SKU's spend 30%?
Creative-fatigue detection. Ask: which ad is decaying, not just underperforming?
Cohort lifetime value. Ask: what is customer value by acquisition month, automatically?
AI-referred traffic measurement. Ask: can you separate AI-assistant traffic from organic?
Scheduled delivery. Ask: can this land in Slack every Monday with reasoning?
Luca AI covers all nine, though scenario simulation is the one I would test hardest during a trial, because it is where vendor claims and reality diverge most. Our use cases show which of those nine jobs brands run first.
💸 The Worked Example That Changes Everything
A founder once slid an invoice across the table and called a product her best seller at 72% gross margin. Gross margin only covers what it costs to make the thing.
Twenty minutes later, after allocating shipping, returns, discounts, ad spend, and support cost line by line, real contribution margin was 8%. She cried. The dashboard had shown 72% every day for a year, which is exactly why contribution margin versus gross margin matters more than any chart.
🎫 How Support Load Becomes a Margin Number
The hidden cost was service. Roughly 42% of all customer service tickets traced to that single product, which worked out to about $1.45 per unit sold.
No dashboard allocates that automatically. Luca AI runs this allocation continuously across connected order, ad, and finance data, which turns contribution margin from a quarterly discovery into a live number.
🤖 Why AI-Referred Demand Now Belongs on the List
This capability did not exist two years ago. Shopify's Q2 2026 data shows traffic from AI search tools and AI-originated orders both tripling year over year.
The quality is different too. AI-referred sessions convert at nearly 50% higher rates with 14% higher average order value, and about 75% of AI-attributed orders came from outside the top 100 categories. If your tool lumps that into "direct," you are mispricing your best channel, so check your ecommerce conversion tracking before you draw conclusions.
⚠️ Data Accuracy Is a Capability, Not a Given
Ask about multi-store and warehouse edge cases before you sign. Operators get burned here regularly:
"I've also reported an issue with inventory levels, as our inventory is multiplied with 6, since we have 6 different shopify stores connected to the same warehouse. Not really rocket science. But it has taken them closer to 1,5 month, and I've still not received a solution." — Maja, Verified Buyer Polar Analytics - TrustPilot Verified Review
"Shopify's own analytics are good enough on their own for most stores." — Verified User, r/ShopifyeCommerce Reddit Thread
That second comment is fair, and worth sitting with. Below roughly $1M in revenue, native analytics plus discipline usually beats another subscription.
📅 Your Monday Action
Rank your SKUs by contribution margin, not revenue. Then check whether your current tool can even produce that list without a spreadsheet.
Also watch storefront speed alongside marketing data, since a one-second delay in page load can cut conversions by around 7%. Agents should monitor both, alongside your ecommerce inventory management signals.
Luca AI predicts from historical data, simulates the alternative before you commit budget, and isolates the influencing components behind a move. That combination, rather than any single feature, is what separates intelligence from reporting.
Q5. How Do Agentic Analytics Needs Differ Between DTC and Marketplace Sellers? [toc=5. DTC vs Marketplace]
DTC sellers own first-party data, so agents can reason across site behaviour, ads, email, and finance, then act on them. Marketplace sellers work with delayed, aggregated, and partly read-only platform data, so agents concentrate on buy-box monitoring, PPC bid signals, inventory velocity, and category-level buying. Hybrid brands need one layer that normalizes both into a single set of margin numbers.
🔑 Why Data Rights Change Everything
On your own store, you own the session, the customer record, and the cost fields. An agent can see a visitor arrive, convert, return the item, and open a support ticket.
On Amazon, you rent a reporting window. Data arrives aggregated, delayed, and stripped of customer identity, which caps how deeply any agent can reason, and it is the core constraint behind omnichannel analytics work.
📊 What Each Side Actually Needs
Agent Jobs Compared Across DTC and Marketplace Channels
Agent job
DTC (Shopify)
Marketplace (Amazon, Walmart)
Root cause on revenue drops
Full path, ads to checkout
Partial, session data missing
Contribution margin per SKU
Possible with COGS loaded
Harder, fees and returns lag
Spend reallocation
Approve or automate
Mostly manual in Seller Central
Inventory forecasting
Live, tied to velocity
Strong, since FBA data is clean
Category and competitor view
Weak, you see only yourself
Strongest asset on this side
Luca AI normalizes DTC and marketplace feeds on ingestion, which is what lets a hybrid brand ask one margin question and get one answer.
⚠️ Marketplace Tooling Is Still Pre-Agentic
I want to be direct about this, dated August 2026. Jungle Scout's AI Assist still centres on listing copy, with autonomous opportunity detection only promised for the second half of 2026.
Cobalt gives excellent category intelligence, but execution stays in your hands. Reviewers also flag the coverage gap plainly, which is worth weighing against your own Amazon brand analytics needs:
"cant think of anything that i actually dislike, so i guess i will say not having the same data and insights for other marketplaces such as walmart" — Verified User, Brand Management Jungle Scout Cobalt - G2 Verified Review
"They're trying to become an all-in-one platform by adding reimbursement services, advertising management, and other features that feel mediocre compared to their core strengths." — Verified User, Amazon Seller Helium 10 - G2 Verified Review
🧮 The Job Nobody Automates Yet
One retail buyer described spending three weeks before a major buying cycle analysing which vendors performed and which did not. That is pure pattern work, and it is exactly what an agent should absorb.
Luca AI handles this class of question by studying performance across months and years, then flagging when a vendor or SKU breaks its own pattern. A useful boundary applies here too. AI cannot create taste, but it can absolutely dictate quantities.
✅ The Question That Exposes a Vendor
If you sell on both channels, ask this on the demo. "Show me total contribution margin across Shopify and Amazon for last month, in one number."
Most tools will show you two dashboards. That gap is the whole reconciliation problem, and it lands back on the founder every single month, which is why ecommerce profit margins get audited late rather than early.
I could be reading this too strongly. What surfaces in Luca AI's deployments is that hybrid brands lose more hours to reconciliation than to analysis itself, though that may reflect who comes looking for help.
Luca AI treats marketplace and DTC data as one model rather than two reports, which is why a hybrid brand can ask one margin question and receive one answer instead of two irreconcilable ones.
Q6. Is Your Data Ready, and Where Must a Human Stay in the Loop? [toc=6. Data Readiness and Guardrails]
Before deploying an agent, your ad, order, COGS, and returns data must reconcile to source, and cost fields must exist at SKU level, or contribution margin cannot be computed. Only about 7% of organisations describe their data as AI-ready. Then grant read access broadly and write access narrowly, keeping humans on publish, pricing, and any spend move above a set threshold.
🧪 The Four-Source Readiness Check
Run each of these before you sign anything:
Orders. Does last month's revenue match Shopify exactly, including refunds?
Ad spend. Does platform spend match your card statement, not the dashboard?
COGS. Does every SKU have landed cost, or are some blank?
Returns. Are return costs captured, or absorbed invisibly into overhead?
If two of those fail, fix them first. An agent reading broken cost fields will confidently tell you to scale a losing product, so tighten ecommerce data collection before you buy anything.
🧱 Why Schema Chaos Kills Rollouts
Every system names things differently. One tool calls a fiscal period "554" while another calls the same window "332," and someone has to reconcile that.
Most agent projects stall right there, in week three, on mapping. Luca AI normalizes and standardizes data on ingestion, which removes that phase rather than scheduling it.
📈 Automation Amplifies Bad Data
This is the part vendors skip. An agent does not fix a wrong number. It acts on it faster.
Two experienced operators, Sean Frank of Ridge and Jason Panzer of HexClad, made clean data the precondition in their March 2026 conversation on ecommerce AI workflows. Their framing was blunt: the foundation comes before the agent, not after.
🚴 The Failure Case Worth Remembering
A premium bike brand let AI run unsupervised on creative production. It published a homepage image of a $20,000 bike with the rear derailleur mounted on the front wheel.
The lesson stuck with me. Do not remove the QA, and never let the AI be the QA. That principle shapes how we think about agentic AI for ecommerce founders.
🔒 A Permissions Matrix You Can Copy
Suggested Agent Permissions by Decision Type
Decision type
Suggested access
Human step
Read any connected data
Full
None
Draft reports and analysis
Full
Skim before circulating
Recommend spend changes
Full
Approve every time
Execute spend moves
Capped, under $500 daily
Weekly review
Change pricing
None
Founder or CFO only
Publish customer-facing content
None
Human sign-off always
Ask Luca AI to surface the recommendation and the reasoning, then keep the approval click with a human on anything that moves money.
🎓 Treat the Agent Like a New Hire
The best mental model I have heard compares an agent to a PhD on day one. Brilliant, and completely without context on your business.
You would not hand that person a customer email on hour one and walk away. Onboarding matters more than raw capability, which is also true of any new ecommerce monitoring tool you introduce.
⚖️ Where Honest Operators Still Disagree
Some run fully agentic navigation across their data and trust the output. Others insist a human reviews everything before publish, for a long time yet.
Luca AI's read is that the second camp is right through 2026, though I hold that loosely. Approval steps cost seconds and prevent five-figure mistakes.
Luca AI surfaces findings for human review before action, which is the design choice that lets a small team automate reasoning without handing over authority over spend or pricing.
Q7. How Do You Pilot One Use Case and Prove It Paid For Itself? [toc=7. Pilot, Pricing and ROI]
Pick one profit-and-loss decision, run a 60-day pilot, and measure three things: hours returned per week, decisions changed, and margin or stockout impact. Budget roughly $150 to $400 monthly between $100K and $500K in monthly revenue, and $500 to $1,500 above that. Adoption alone proves nothing, since operator survey data shows AI adopters posting no profit edge over non-adopters.
📉 The ROI Paradox Nobody Prices In
Andrew Youderian's 2026 trends survey of about 300 store owners, representing roughly $3.5 billion in revenue, found around 72% using AI with no measurable financial edge. Non-adopters were growing profit at similar or better rates.
Shopify's own merchant data points the other way, with 42% adopting AI features and adopters seeing roughly 18% higher conversion. Both can be true. Tools help when they change a decision, and do nothing when they only produce more reports, a pattern we see across AI tools for Shopify owners.
🧭 The Six-Step Pilot
Pick one decision. Reorder timing, or spend allocation. Not "better visibility."
Connect and verify. Reconcile revenue and spend to source before trusting anything.
Load cost fields. COGS, shipping, returns, and support cost per SKU.
Set three alerts. One margin, one inventory, and one acquisition cost.
Log every changed decision. Date, action taken, and dollar impact.
Review at day 60. Hours saved, decisions changed, and margin moved.
Ask Luca AI to deliver those three alerts into Slack weekly, which makes hours returned directly observable rather than a feeling.
⏰ What "Hours Returned" Looks Like
One operator described tasks he would have budgeted two weeks for finishing in about 90 seconds. That is the honest shape of the win.
Another gave their internal assistant a name to field basic inventory questions from staff, saving him roughly 100 questions a day. Small, unglamorous, and real, much like the reporting wins in automated data reporting.
💰 Budget by Revenue Band
Agentic Analytics Budget by Monthly Revenue Band
Monthly revenue
Sensible spend
What to buy
Under $100K
$0 to $100
Native analytics plus discipline
$100K to $500K
$150 to $400
One ecommerce-native agent
$500K to $2M
$500 to $1,500
Agent plus marketplace tooling
Above $2M
$1,500+
Add warehouse or enterprise BI
Luca AI prices at Starter €299 per month, Growth €499 per month, and Scale on custom terms, which sits inside that middle band deliberately. Current tiers are listed on the pricing page.
💸 Score Price Per Outcome, Not Per Seat
Enterprise tools quoting "contact sales" are usually mispriced for a $3M brand. Consumption-based pricing also drifts upward as query volume grows.
Watch the quote-versus-app-listing gap too, because operators get caught by it:
"from the get go there were some discrepancy in the pricing. The pricing communicated when installing the app via Shopify was completely different from the one provided by sales after the installation (which was much higher)" — Maja, Verified Buyer Polar Analytics - TrustPilot Verified Review
"Higher prices than other similar softwares. Also dashboard is somewhat hard to navigate through." — Verified User, Amazon Seller Helium 10 - G2 Verified Review
🔮 What I Think Happens Next
Agentic commerce is louder than it is real right now. A June 2026 merchant survey found only about 3% of UK and US transactions involving AI agents, while 89% of merchants were preparing for them.
Sean Frank and Jason Panzer described the endgame plainly: your agent negotiating budget with Meta's agent and your attribution vendor's agent. Gartner expects roughly 15% of day-to-day work decisions to run autonomously by 2028. My question, and I genuinely do not know the answer, is whether small brands gain leverage in that world or lose it. If you run one of these pilots, I would like to hear what your day-60 numbers said, so get in touch.
Luca AI shortens that pilot because the first useful answer arrives once sources are connected, not after a quarter of schema mapping. That timing is what makes hours returned measurable inside month one.
FAQ's
What are agentic analytics tools, and how do they differ from a dashboard or an AI copilot?
Agentic analytics tools are systems that pursue a goal rather than answer a question. They watch your connected data continuously, detect anomalies, explain the cause, and either recommend or execute the next move.
The three categories get sold as one thing, so here is the honest split:
Dashboard. Displays what already happened. You must know which question to ask.
Copilot. Answers or summarises when prompted. You start every conversation.
Agent. Monitors against a goal you set, diagnoses root cause, and contacts you first.
The practical test on any demo is simple. Ask the vendor to show an alert their system sent a customer last week, unprompted, that changed a decision. If you get a dashboard tour instead, you are looking at descriptive reporting with a chat box attached.
Autonomy also runs on a ladder. L1 recommends, L2 recommends and waits for your approval, and L3 executes inside limits you define. Very few tools built for sellers operate honestly at L3 today.
Luca AI sits at the prescriptive end of that ladder, isolating the influencing components behind a metric move and pushing that finding into Slack, email, or mobile on a schedule you define. We explain the reasoning method in more depth in our guide to agents for ecommerce.
Which agentic analytics tool should we choose at our revenue stage?
Fit tracks revenue, channel mix, and whether you employ an analyst. Buying above your stage is the most common expensive mistake we see.
Under $100K monthly. Native platform analytics plus discipline usually beats another subscription. Budget $0 to $100.
$100K to $500K monthly. One ecommerce-native agent, roughly $150 to $400 monthly.
$500K to $2M monthly. An agent plus marketplace tooling, roughly $500 to $1,500.
Above $2M monthly. Add a warehouse or enterprise BI layer on top.
Channel mix matters just as much. If you sell only on Amazon, weight marketplace data coverage heavily and accept that execution stays manual in Seller Central. If you run Shopify plus paid media, weight cross-source reasoning, because your questions are cross-functional rather than channel-level.
Enterprise platforms quoting "contact sales" are usually mispriced for a $3M brand, and consumption-based pricing drifts upward as query volume grows. Score price per outcome rather than price per seat.
Luca AI prices at Starter €299 per month, Growth €499 per month, and Scale on custom terms, which places it inside the middle band deliberately for brands between $1M and $5M in annual revenue. Current tiers sit on our pricing page.
Do agentic analytics tools replace an ecommerce data analyst?
Not entirely, though they absorb most of what a junior analyst does day to day. The recurring reporting, anomaly triage, and root-cause drilling are the parts that automate cleanly.
What an agent takes off the desk:
Weekly and monthly performance reports with reasoning attached
First-pass investigation when acquisition cost or margin moves
Pattern detection across months and years of history
Reorder and stockout warnings before they hit revenue
What stays human: merchandising taste, vendor negotiation, brand judgement, and the final call on anything that moves money. AI cannot create taste. It can absolutely dictate quantities.
The honest caveat is that adoption alone changes nothing. One 2026 survey of roughly 300 store owners, representing about $3.5 billion in revenue, found around 72% using AI with no measurable profit edge over non-adopters. Value appears only when the hours returned get redeployed into decisions.
Luca AI functions as a replacement for a junior ecommerce data analyst, drawing relationships between metrics across sources to surface outliers and push suggestions rather than charts. We wrote about where that boundary sits in how AI can actually help you run your ecommerce business.
What does our data need to look like before an analytics agent is useful?
Four sources must reconcile to source before an agent earns trust. Automation does not fix a wrong number, it acts on it faster.
Orders. Does last month's revenue match your store exactly, including refunds?
Ad spend. Does platform spend match the card statement, not the ad dashboard?
COGS. Does every SKU carry landed cost, or are some fields blank?
Returns. Are return costs captured per SKU, or absorbed invisibly into overhead?
If two of those fail, fix them before you buy anything. Without SKU-level cost fields, contribution margin cannot be computed, and contribution margin is the number that actually decides what to scale.
Schema conflict is the second blocker. One system names a fiscal period "554" while another calls the same window "332," and most agent rollouts stall in week three on that mapping work rather than on the AI itself.
Luca AI normalizes and standardizes data on ingestion, which removes the schema-mapping phase instead of scheduling it as a project. Plug in, ask, act. If you want the groundwork first, start with our breakdown of ecommerce data integration and reconcile your sources before any trial begins.
How do we prove an agentic analytics pilot paid for itself?
Pick one profit-and-loss decision, run it for 60 days, and measure three things only. Anything broader turns into a visibility project with no scoreboard.
Hours returned per week. Reporting and triage time you no longer spend.
Decisions changed. Log the date, the action, and the dollar impact each time.
Margin or stockout impact. The financial result of those changed decisions.
The sequence we recommend: choose the decision, connect and verify sources against the originals, load COGS and returns per SKU, set exactly three alerts covering margin, inventory, and acquisition cost, log every changed decision, then review at day 60.
Set expectations on the shape of the win. One operator described data manipulation work he would have budgeted two weeks for finishing in about 90 seconds. Another named their internal assistant so staff stopped asking basic inventory questions, saving roughly 100 interruptions a day. Unglamorous, and real.
Luca AI delivers those scheduled alerts into Slack, email, or mobile, which makes hours returned observable rather than a feeling. See which pilot decisions brands run first in our use cases, then hold your vendor to the day-60 numbers.
Enjoyed the read? Join our team for a quick 15-minute chat — no pitch, just a real conversation on how we’re rethinking Ecommerce with AI - Luca
Loading Schedule...
Your AI Co-Founder is here.
Here’s why:
Shopify, Meta, Xero - one brain.
"Should I scale?" Answered with real data.
Growth capital. No applications. One click.
Thank you! Your submission has been received! Please book a time slot for the Meeting
Oops! Something went wrong while submitting the form.