10 Best Tools Automated Data Reporting in Ecommerce in 2026
12
mins read
TL;DR
We rank the 10 best automated data reporting tools for e-commerce in 2026, spanning Luca AI, Whatagraph, Glew, Daasity, Triple Whale, Polar, Lifetimely, Peel, Supermetrics, and GA4.
Tools were scored on a transparent 100-point rubric weighting data-source unification and prescriptive output heaviest, because that is where operators actually bleed.
Reporting automation and attribution are different jobs; reporting assembles and explains your numbers, while attribution assigns channel credit, so buy the reporting layer first.
Costs range from free with GA4 to roughly $300 to $800 monthly once brands stack overlapping tools, plus a real global pricing gap outside the US.
Real G2 and Reddit verdicts confirm one truth: no tool saves you if the underlying data is messy, so standardize your lookups first.
Match the tool to your stage, and above $5M an AI layer unifying commerce, marketing, and finance delivers the most leverage.
Q1. What Are the 10 Best Automated Data Reporting Tools for E-commerce in 2026? [toc=1. 10 Best Reporting Tools]
Automated data reporting software pulls sales, ad spend, traffic, and finance data from every platform into scheduled, refreshed reports, replacing the Monday Excel export. The 10 best for 2026: Luca AI (cross-source reporting over a data warehouse), Whatagraph (white-label client reports), Glew (multi-channel dashboards), Daasity (warehouse teams), Triple Whale (paid-social analytics), Polar Analytics (Shopify-native), Lifetimely (LTV), Peel (retention), Supermetrics plus Looker Studio (DIY), and GA4 (free baseline).
Most founders I talk to are not short on data. They are drowning in it. A brand doing $2M a year is bombarded by dashboards, PDFs, ad platform tabs, and email digests, and still processes maybe 5% of what lands in front of them. So every Monday somebody exports four CSVs, pastes them into one sheet, and calls that "reporting." That is the job these ten tools automate, and it is the core of modern ecommerce reporting. Below is the ranked list, then a comparison table, then the deep dives.
🏆 The 10 Best Automated Data Reporting Tools for E-commerce
1.1 Luca AI, best for cross-source reporting and prescriptive, plain-English insight over a unified data warehouse
1.2 Whatagraph, best for automated white-label cross-channel reports
1.3 Glew, best for multi-channel dashboards
1.4 Daasity, best for data-warehouse and analyst teams
1.5 Triple Whale, best for Shopify paid-social analytics
1.6 Polar Analytics, best Shopify-native reporting
1.7 Lifetimely, best for LTV and profitability
1.8 Peel, best for retention cohorts
1.9 Supermetrics plus Looker Studio, best DIY reporting stack
1.10 GA4, best free baseline
One caveat before you shop, and it drives the rest of this article. Reporting is a different job from attribution. Reporting assembles your numbers into one place, which is the heart of any ecommerce analytics platform. Attribution decides which channel earned the sale. Keep that split in mind as you read.
📊 Comparison Table
10 Best Automated Data Reporting Tools for E-commerce (2026)
Tool (Rating)
Key Capabilities
Best For
Pricing
Luca AI ⭐⭐⭐⭐⭐
Plain-English querying, cross-source data warehouse, predictive and simulation output, and scheduled report pushes to Slack or email
DTC and mid-market brands wanting insight without an analyst
Automated cross-channel reports, white-label templates, 55+ integrations, and scheduled delivery
Agencies and teams sending recurring client reports
$259 to $999 / Month
Glew ⭐⭐⭐
Multi-channel dashboards, customer segmentation, and product and cohort reporting
Shopify brands needing deeper reporting than native
$79 to $599 / Month
Daasity ⭐⭐⭐⭐
ETL to a warehouse, standardized data model, and Looker or BI dashboards
In-house analyst and data teams
$500 to $2,000+ / Month
Triple Whale ⭐⭐⭐⭐
Paid-social attribution, real-time profit dashboards, and Shopify sync
Shopify DTC brands scaling paid media
$129 to $999+ / Month
Polar Analytics ⭐⭐⭐
Shopify-native metrics, custom dashboards, and benchmarks
DTC brands wanting a Shopify-first view
$300 to $1,200 / Month
Lifetimely ⭐⭐⭐
LTV modeling, profit and loss, and cohort reporting
Brands focused on LTV and profitability
$34 to $299 / Month
Peel ⭐⭐⭐
Automated retention and cohort analytics, and RFM segments
Subscription and repeat-purchase brands
$149 to $799 / Month
Supermetrics + Looker Studio ⭐⭐
Data connectors piped into a free dashboard builder
Technical teams building DIY reports
$29 to $999 / Month
GA4 ⭐⭐
Free web and traffic analytics, funnels, and custom reports
Brands needing a free traffic baseline
Free to $150K+ / Year (360)
Ratings reflect reporting capability judged against the scoring rubric in the next section, not attribution accuracy or capital features.
1.1 Luca AI
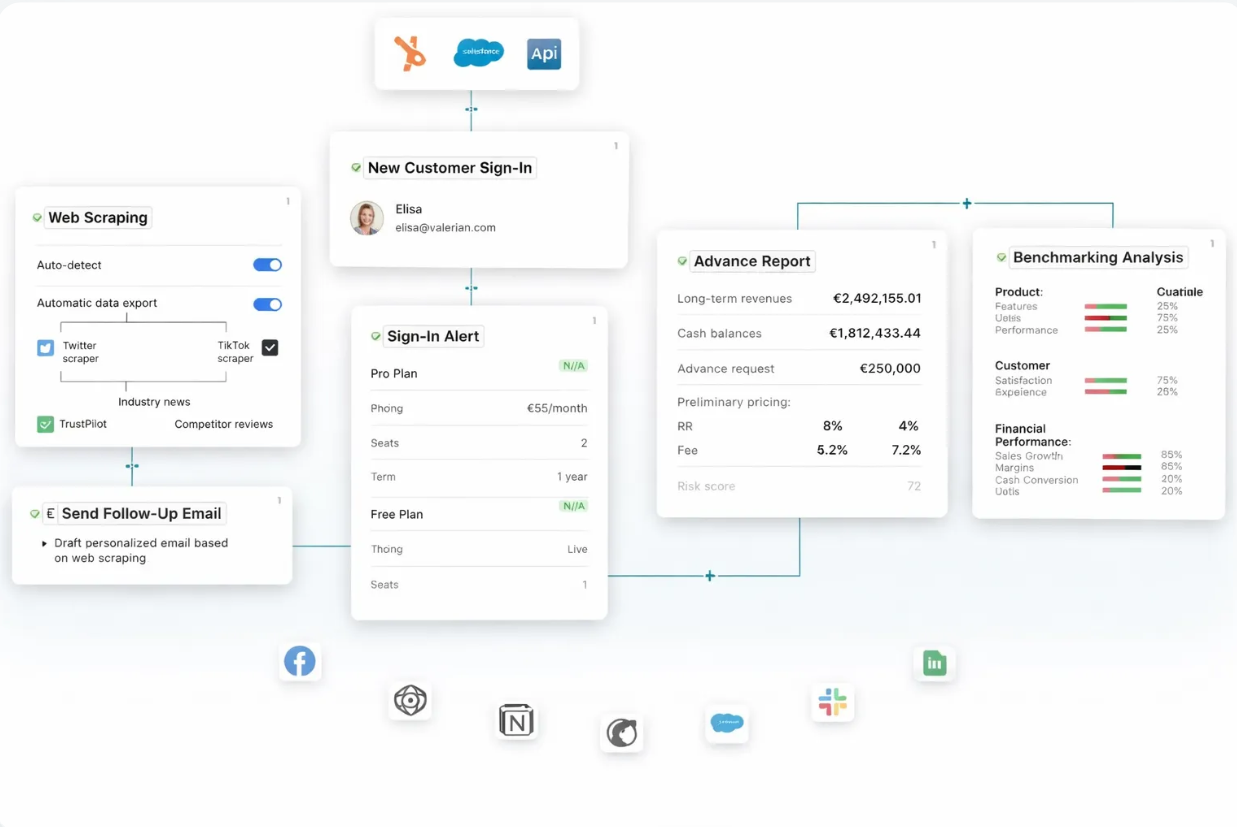
Luca automation flow connecting web scraping, customer sign-in alerts, advance reporting and benchmarking analysis, showing how automated data reporting tools generate ecommerce insights without manual data pulls.
Luca AI sits first because it does not just show you the numbers. It reads them, explains them, and pushes the answer to you before you go looking.
⭐ Why did we choose this tool?
I am Eric, and yes, I founded Luca, so treat this with the skepticism it deserves. I put us first because most tools on this list bolted AI onto a dashboard, while Luca is built AI-first over a unified data warehouse. You ask questions in plain English, with no SQL and no analyst, and Luca connects every source into one place, then returns the "why" behind a metric, not just the metric. It reads more like a junior analyst who never sleeps than a chart library, which is why we think of it as agentic AI for ecommerce founders.
📊 Key capabilities
Plain-English querying: ask "why did CAC spike last week" and get a reasoned answer, with no dashboard-building.
Single source of truth: connects Shopify, Meta, Google, and finance data into one warehouse through clean ecommerce data integration.
Predict and simulate: forecasts on historical data and models "what if" scenarios.
Root-cause analysis: surfaces the influencing components behind an outlier, not just the outlier.
Agentic reports: pushes scheduled weekly or monthly reports with graphs and reasoning to Slack or email.
✅ Best for
Industry and size: DTC and mid-market e-commerce brands from roughly $1M to $50M in revenue.
Data volume and sources: teams juggling many data sources (commerce, ads, and finance) with no analyst to unify them.
💰 The problem: A European skincare brand doing mid-seven figures ran reporting across five tools. Its two-person finance team spent nearly a full day each week reconciling ad spend against Shopify revenue, and CAC by channel was always a week stale.
📊 How Luca helped: The brand connected Shopify, Meta, Google Ads, and its accounting data into Luca. The team set outlier alerts for ROAS dips and asked for a weekly CAC report by channel, delivered to Slack with reasoning and charts.
✅ The outcome: Weekly reconciliation dropped from about 8 hours to under 1. A flagged CAC spike on one channel, caught days earlier than before, let the team reallocate budget the same week and protect contribution margin.
If your job is sending the same polished report to clients or your leadership every week, Whatagraph is built for exactly that grind.
⭐ Why did we choose this tool?
Whatagraph earns its spot as the cleanest way to automate recurring, good-looking cross-channel reports. It pulls from 55-plus marketing and e-commerce sources, then drops the data into white-label templates you schedule once and forget. Agencies love it because a client report that used to eat a Friday afternoon now sends itself. It leans toward marketing reporting, so it is less of a deep finance or forecasting tool, but for automated delivery it is hard to beat, and it fits neatly into a lean e-commerce tech stack.
📊 Key capabilities
Automated cross-channel reports pulling from 55+ integrations.
White-label templates for agency and client-facing delivery.
Scheduled email delivery so reports send on autopilot.
Drag-and-drop report builder with no code required.
Industry and size: agencies and in-house teams managing multiple brands or channels.
Data volume and sources: teams pulling many marketing sources that need one shared report.
Requirements: operators who prioritize recurring, branded report delivery over deep analysis.
1.3 Glew
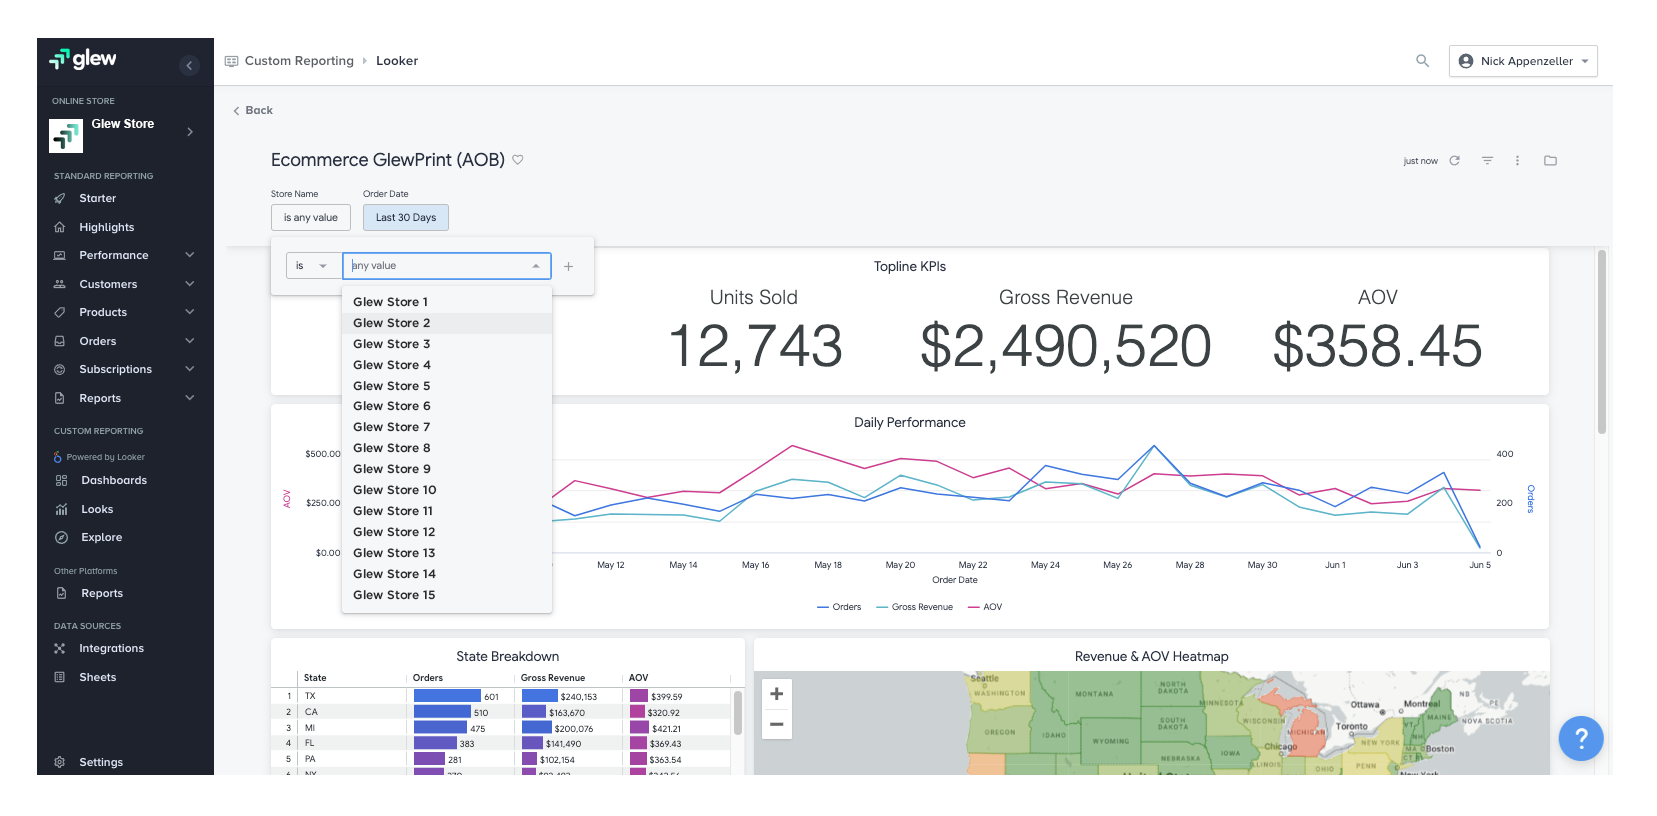
Glew reporting dashboard displaying topline ecommerce KPIs like units sold, gross revenue and AOV with daily trends, illustrating an automated data reporting tool for multi-store ecommerce performance monitoring.
Glew is the tool DTC brands reach for when Shopify's native reports stop answering their questions.
⭐ Why did we choose this tool?
Glew earns its spot because it turns raw multi-channel data into segmented dashboards without a spreadsheet. It connects your store, ad platforms, and email, then reports revenue by channel, product, and customer cohort (a group of customers grouped by when they first bought). For a Shopify brand outgrowing native analytics, it is a solid step up, and a natural upgrade for anyone comparing the best Shopify analytics apps. The trade-off is that reporting accuracy depends heavily on clean inputs, and some users find deeper slicing needs a higher plan.
📊 Solutions offered
Multi-channel dashboards across store, ads, and email.
Customer segmentation by frequency, product, and lifetime value.
Product and inventory reporting with period comparisons.
Scheduled report exports to CSV and email.
Channel-level revenue attribution reporting.
✅ Best for
Industry and size: Shopify DTC brands outgrowing native reports.
Data volume and sources: mid-volume stores blending store, ad, and email data.
Requirements: teams wanting segmentation without building a warehouse.
😊 Reviews
"Glew reports are easy to segment and export. Data is displayed in easily digestible results with points of reference to previous period and year. For a Shopify-based business, Glew offers more powerful analytical solutions than available to us in Shopify." Verified User Glew G2 Verified Review ⭐⭐⭐⭐
"Data was often not accurate and adding new data sources was hard. The visualization was also subpar." Verified User Glew G2 Verified Review ⭐⭐
1.4 Daasity
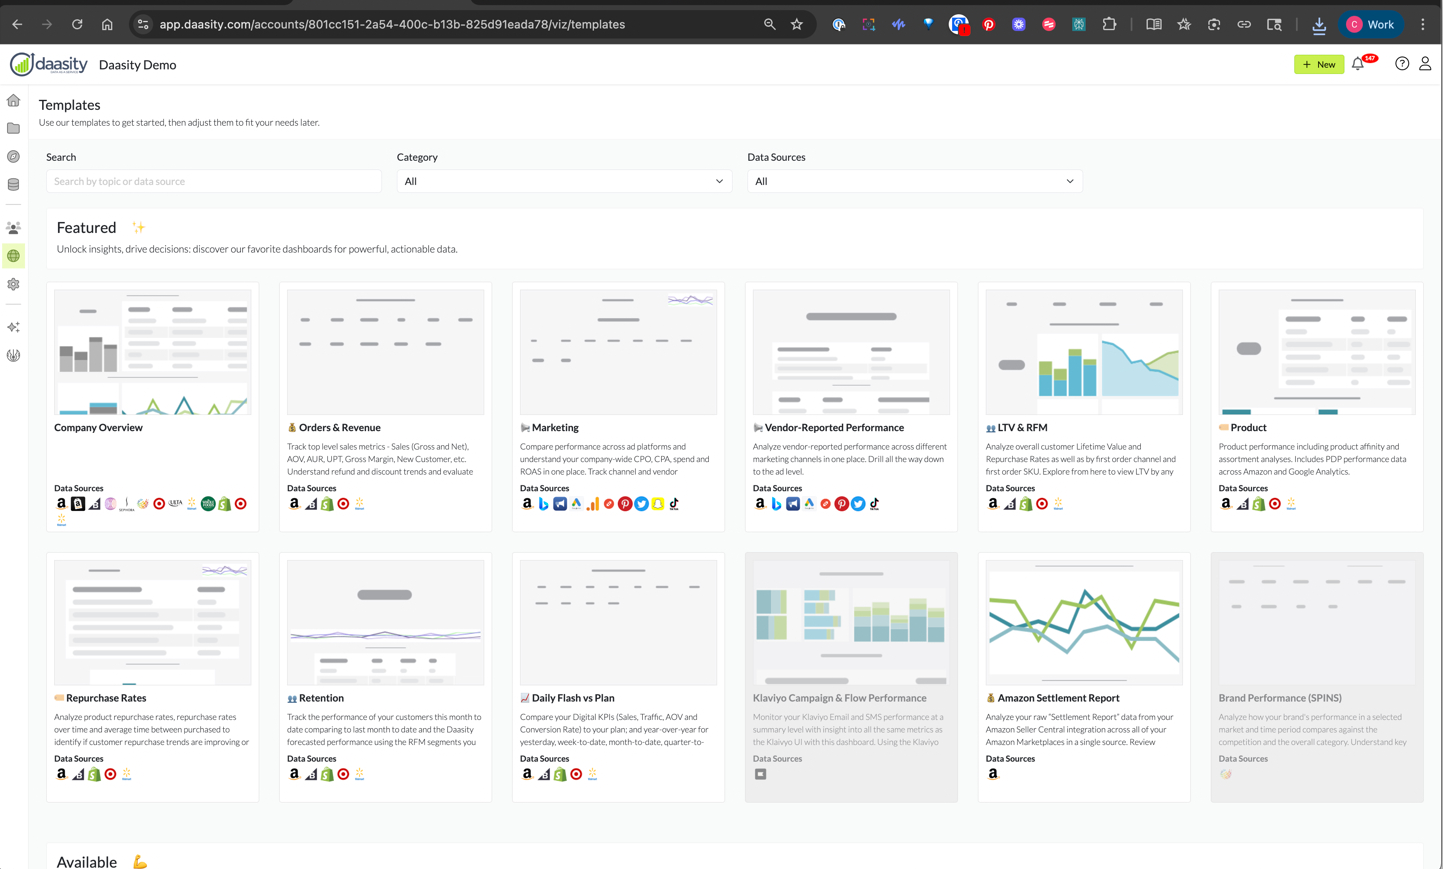
Daasity templates library showing prebuilt ecommerce dashboards for orders, revenue, marketing and LTV across data sources, exemplifying an automated data reporting tool that standardizes multi-channel ecommerce analytics.
Daasity is built for the brand that has an analyst, or is ready to hire one.
⭐ Why did we choose this tool?
Daasity earns its place as the pick for teams that want to own their data in a warehouse (a central database that stores all your business data). It runs ETL, which means it extracts, transforms, and loads data from your sources into one standardized model, then feeds BI dashboards. This is powerful for analyst-led teams and a serious ecommerce business intelligence foundation. It is also the heaviest lift on this list, so a founder without data help may find it overkill.
📊 Solutions offered
ETL pipelines into a managed data warehouse.
Standardized e-commerce data model across sources.
Pre-built dashboards for retail and DTC metrics.
Custom reporting through Looker and other BI tools.
Multi-store and multi-channel consolidation.
✅ Best for
Industry and size: mid-market and larger brands with data teams.
Data volume and sources: high-volume, many-source operations.
Requirements: teams wanting a warehouse they control.
1.5 Triple Whale
Triple Whale is the name that comes up first when Shopify operators talk paid-social performance.
⭐ Why did we choose this tool?
Triple Whale earns its spot for real-time profit dashboards and paid-social attribution built for Shopify. It connects your store, ad accounts, and CRM, then shows which campaigns drive revenue. Operators like the speed and the daily profit view. The honest catch, which shows up repeatedly in reviews, is that attribution numbers sometimes conflict with Shopify, so treat it as directional, not gospel, and worth weighing against Triple Whale alternatives.
📊 Solutions offered
Real-time profit and revenue dashboards.
Paid-social and multi-channel attribution.
Shopify, ad platform, and CRM integrations.
Custom metric views and reporting.
Creative and campaign performance tracking.
✅ Best for
Industry and size: Shopify DTC brands scaling paid media.
Data volume and sources: brands running heavy Meta and Google spend.
Requirements: operators wanting a fast daily profit read.
😊 Reviews
"I love how seamlessly it connects our ad platforms and CRM data, showing exactly where our conversions come from and which campaigns drive the most revenue. Its made attribution so much clearer." Verified User Triple Whale G2 Verified Review ⭐⭐⭐⭐⭐
"Its very easy to use and works good for a multichannel solution. Sometimes it does not update the numbers correctly and has errors with synchronisation." Verified User Triple Whale G2 Verified Review ⭐⭐⭐
1.6 Polar Analytics
Polar Analytics is the Shopify-first choice for brands that want one clean view of the whole store.
⭐ Why did we choose this tool?
Polar Analytics earns its spot for a Shopify-native metrics layer that centralizes revenue, acquisition, and email in one place, a strong fit for teams building a Shopify analytics dashboard. Founders like how quickly it pulls a full-store picture together. The recurring knock in reviews is support and onboarding, with some users citing slow responses and a learning curve on advanced features. Great data, less certain service.
📊 Solutions offered
Shopify-native revenue and acquisition metrics.
Custom dashboards and benchmarks.
Multi-source connectors for ads and email.
Automated reporting and alerts.
Cohort and retention views.
✅ Best for
Industry and size: DTC brands wanting a Shopify-first view.
Data volume and sources: stores centralizing revenue, ads, and email.
Requirements: teams valuing a unified metrics layer over deep custom BI.
😊 Reviews
"Polar Analytics centralizes revenue, acquisition, and emailing with ease. Sometimes the data takes time to update, and some ratios are more difficult to understand." Juliette P., CEO Polar Analytics G2 Verified Review ⭐⭐⭐⭐
"Shortly after onboarding we were assigned an account manager. About a month later, she was laid off and we were never assigned a new account manager... the response time has been less than ideal especially when real-time data is important for our team." Verified User Polar Analytics G2 Verified Review ⭐⭐⭐
1.7 Lifetimely
Lifetimely is the tool brands install when the question shifts from "what sold" to "what is a customer actually worth."
⭐ Why did we choose this tool?
Lifetimely earns its spot for LTV modeling and profit-and-loss reporting built for DTC. LTV, or lifetime value, is the total profit you expect from a customer over time, a metric we cover in depth in our guide to ecommerce customer lifetime value. It ties orders to real costs so you can see contribution margin (revenue left after variable costs) by cohort. It is focused and affordable, though it is a specialist tool, not a full cross-channel reporting suite.
📊 Solutions offered
Predictive LTV modeling by cohort.
Automated profit-and-loss reporting.
Customer acquisition cost and payback tracking.
Product and repeat-purchase analysis.
Scheduled email report delivery.
✅ Best for
Industry and size: DTC brands focused on profitability.
Data volume and sources: Shopify-centric stores.
Requirements: teams prioritizing LTV and margin over broad dashboards.
1.8 Peel
Peel is for brands where the second purchase matters as much as the first.
⭐ Why did we choose this tool?
Peel earns its spot for automated retention and cohort analytics. It surfaces RFM segments, which group customers by how recently, how often, and how much they buy, without you building the dashboard, a smart layer on top of solid ecommerce customer segmentation. For subscription and repeat-purchase brands, that saves real analyst hours. It is retention-focused, so it pairs with, rather than replaces, a full reporting stack.
📊 Solutions offered
Automated retention and cohort reporting.
RFM segmentation of the customer base.
Repeat-purchase and subscription analytics.
Trend alerts on key retention metrics.
Shopify and app integrations.
✅ Best for
Industry and size: subscription and repeat-purchase DTC brands.
Data volume and sources: stores with meaningful repeat order history.
Requirements: teams focused on retention economics.
1.9 Supermetrics + Looker Studio
This is the DIY stack for teams that would rather build than buy.
⭐ Why did we choose this tool?
The Supermetrics plus Looker Studio combo earns its spot as the flexible, lower-cost DIY route. Supermetrics pipes data from many sources into Looker Studio, Google's free dashboard builder. Technical teams get near-total control, which appeals to anyone who cares about ecommerce data visualization. The honest trade-off, echoed loudly in reviews, is maintenance, because connectors break, data syncs fail, and Looker Studio has a real learning curve.
📊 Solutions offered
Connectors pulling many ad and commerce sources.
Free dashboarding through Looker Studio.
Custom report layouts and blending.
Scheduled email delivery of reports.
Spreadsheet and warehouse destinations.
✅ Best for
Industry and size: technical teams and lean agencies.
Data volume and sources: multi-source setups with in-house upkeep.
Requirements: teams prioritizing control and cost over convenience.
😊 Reviews
"Its incredibly convenient, useful and simple. It gets the job done in most cases, despite them being very slow to add new features to their APIs." Verified User Supermetrics G2 Verified Review ⭐⭐⭐
"I hate Looker Studio. Hate it, hate it, hate it... It is incredibly complex and difficult to use. I get thwarted at every step when I'm trying to create reports." Verified User Looker Studio G2 Verified Review ⭐
1.10 GA4
GA4 is the free baseline almost every store already has, for better and worse.
⭐ Why did we choose this tool?
Google Analytics 4 earns its spot as the free traffic and behavior baseline. It tracks how visitors find and move through your site, with funnels and custom reports, and it is the starting point in most guides to Google Analytics for ecommerce. For a starting brand, free is hard to argue with. The well-documented catch is a steep learning curve, heavy sampling on the free tier, and e-commerce revenue numbers that often do not match Shopify.
📊 Solutions offered
Free web and app traffic analytics.
Funnel and path exploration reports.
Custom event and conversion tracking.
Audience and acquisition breakdowns.
Integration with Google Ads and Search Console.
✅ Best for
Industry and size: early-stage and budget-conscious brands.
Data volume and sources: stores needing a free traffic baseline.
Requirements: teams comfortable configuring their own reports.
😊 Reviews
"What I like best about Google Analytics is the depth of insights it provides into user behavior across the entire customer journey... The downside of GA is its learning curve, especially with GA4." Aman S., Performance Marketing Head Google Analytics G2 Verified Review ⭐⭐⭐
"It requires a lot of setup and manual work to get what you really need... It has pretty substantial limitations for ecommerce tracking and often isn't close to accurate for conversion rate, number of orders, or revenue." Verified User Google Analytics G2 Verified Review ⭐⭐
Where Luca fits across these ten
Look at the pattern in the reviews above and one theme repeats. Every tool here shows you data, then hands the thinking back to you. Glew, Polar, and Triple Whale all draw the same complaint, namely numbers that need a manual check, and insight you still have to dig out yourself.
✅ Luca is built AI-first, so you ask in plain English and get the reasoning, not just the chart. ✅ It scans your data 24/7 and pings you when ROAS dips or CAC spikes, before you go looking, the kind of predictive analytics for ecommerce most dashboards lack. ❌ Passive dashboards like Looker Studio wait for you to build the report and spot the problem. ✅ Luca also normalizes data on ingestion, so you skip the data-cleanup year that Supermetrics users describe. ❌ DIY stacks leave that upkeep on your plate every week.
Q2. How Did We Score and Rank These Reporting Tools? [toc=2. Scoring Methodology]
We scored each tool on five weighted criteria totaling 100%: Data-Source Coverage and Unification (25%), Prescriptive and Predictive Output (25%), Automation and Report Delivery (20%), Setup and Usability (15%), and Pricing Transparency (15%). Tools scoring 81 to 100 earn 5 stars, 61 to 80 four, 41 to 60 three, 21 to 40 two, and 0 to 20 one. Ratings reflect reporting capability only.
📊 The five criteria and why they carry weight
I did not pick these weights to flatter anyone. I picked them because of where operators actually bleed. Digital Commerce 360's 2026 analytics work found a majority of brands cite conflicting data across sources as a top pain, so unification and prescriptive output sit heaviest. A report that tells you what to do beats one more chart you have to decode yourself, which is why solid ecommerce data integration matters so much.
Here is the exact rubric behind every star in this article.
Scoring Rubric and Criteria Weights
Criteria
Weight
What it measures
Data-Source Coverage and Unification
25%
How many sources it connects, and how cleanly it merges them into one truth
Prescriptive and Predictive Output
25%
Whether it explains the "why" and suggests a next move, not just the number
Automation and Report Delivery
20%
Scheduled reports, alerts, and push to Slack or email
Setup and Usability
15%
Time to first value and whether a non-analyst can run it
Pricing Transparency
15%
Clear public pricing versus quote-only opacity
⭐ How stars map, and what the weights favor
The math is simple. A tool's weighted score lands it in a band, and that band sets its star count. We do not publish the raw scores, only the stars, to keep the focus on the verdict, a principle we apply across our ecommerce analytics platforms comparisons.
One honest note on bias. These weights reward tools that turn raw data into a decision, not tools with the longest feature list. That is a defensible stance, since a founder at 2am does not need another dashboard, they need to know whether to go right or left. Luca AI earns 5 stars here on reporting merits alone, its data-source unification and prescriptive output, with no capital or lending angle factored in, echoing our take on how AI can actually help you run your e-commerce business.
Q3. Is This a Reporting Tool or an Attribution Tool? Which Do You Actually Need? [toc=3. Reporting vs Attribution]
They are different jobs. Attribution tools like Triple Whale and Northbeam decide which channel gets credit for a sale. Reporting-automation tools like Luca AI, Whatagraph, and Glew assemble your numbers across every source, surface the root cause, and deliver scheduled reports. If you are triangulating spreadsheets at 11pm, you need a reporting layer first. Add attribution only if channel credit is your bottleneck.
🧩 The two jobs, defined plainly
Think of it like a car. Attribution is the fuel gauge telling you which tank the mileage came from. Reporting is the full dashboard, showing speed, fuel, engine heat, and range in one glance. Both matter, but they answer different questions, and both belong in a healthy e-commerce tech stack.
Attribution assigns credit. It tries to say Meta drove this sale, not Google. Reporting assembles and explains. It pulls every source into one place, then tells you what happened and why. Confusing the two is why so many founders buy a pixel and still cannot answer "are we profitable this week," a gap covered in our guide to ecommerce conversion tracking.
Reporting Automation vs Attribution
The job
What it answers
Example tools
When you need it
Attribution
Which channel earned this sale?
Triple Whale, Northbeam
Channel credit is your bottleneck
Reporting automation
What happened across my whole business, and why?
Luca AI, Whatagraph, Glew
You are still stitching spreadsheets by hand
⚠️ No tool fixes flawed underlying data
Here is the caveat the category avoids. No tool, attribution or reporting, saves you if the data feeding it is messy. Operators say it constantly, and the frustration shows in reviews of attribution tools that "conflict with what we see in Shopify."
"Some data we still notice discrepancies between platforms, for example, tracking ads, and differences in the reported metrics like revenue." Verified User Triple Whale G2 Verified Review ⭐⭐⭐⭐
So standardize your lookups first, meaning agree on how each metric is defined before you automate anything, a discipline at the heart of good ecommerce data management. To be clear about where we sit, Luca AI is not an attribution pixel. It is an AI layer over a unified data warehouse (a central store of all your data) that extracts, predicts, simulates, and finds the root cause behind an outlier, then pushes the answer to you. It complements attribution, it does not replace the pixel.
Q4. How Do the Top Tools Compare on Reporting Depth, Setup Time, and Price? [toc=4. Deep-Dive Comparison]
Cost ranges from free (GA4) to roughly $300 to $800 a month once brands stack overlapping tools, and setup runs from same-day to about a month. Whatagraph leads white-label reporting, Glew multi-channel dashboards, Daasity warehouse teams, and Luca AI cross-source prescriptive reporting. Budget roughly 0.5% to 1.5% of monthly ad spend on tooling.
📊 The master comparison matrix
Reporting Depth, Setup Time, and Price Comparison
Tool (Rating)
Price / Month
Reporting Depth
Integrations
Setup / Time-to-ROI
Luca AI ⭐⭐⭐⭐⭐
€299 to Custom
Prescriptive, predictive, and root-cause
Commerce, ads, and finance
Same-day, plug-in
Whatagraph ⭐⭐⭐⭐
$259 to $999
Cross-channel report delivery
55+ sources
Days
Glew ⭐⭐⭐
$79 to $599
Segmentation dashboards
Store, ads, and email
About 1 month / about 14 months
Daasity ⭐⭐⭐⭐
$500 to $2,000+
Warehouse-grade custom BI
Many, via ETL
Weeks to months
Triple Whale ⭐⭐⭐⭐
$129 to $999+
Real-time profit and attribution
Shopify, ads, and CRM
Days
Polar Analytics ⭐⭐⭐
$300 to $1,200
Shopify-native metrics
Store, ads, and email
Days
Supermetrics + Looker ⭐⭐
$29 to $999
DIY, you build it
Many connectors
Weeks, high upkeep
GA4 ⭐⭐
Free to $150K+ / yr
Traffic and behavior
Google stack
Steep learning curve
💰 The overlapping-stack cost trap
Here is what the per-tool prices hide. A typical $5M brand does not buy one tool, it buys three that overlap, and lands around $300 to $800 a month across them. You pay twice for the same revenue number, once in Glew and once in Polar, a trap we flag in our roundup of the best Shopify reporting apps.
Global pricing makes this worse outside the US. Triple Whale and Northbeam run roughly INR 40,000 to 70,000 a month for Indian operators, a real budget line most English listicles ignore. Consolidation is where the margin hides. One founder I spoke with cut a bloated data team down as tooling did more of the lifting, and that was a direct ecommerce profit margins unlock.
😊 What operators actually report
"Setting up Improvado has been a breeze. Once the destination is configured, adding new data sources is a pretty seamless process." Verified User Improvado G2 Verified Review ⭐⭐⭐⭐
"Glew reports are easy to segment and export... For a Shopify-based business, Glew offers more powerful analytical solutions than available to us in Shopify." Verified User Glew G2 Verified Review ⭐⭐⭐⭐
Judge every tool here on reporting merits only. On that basis, Luca AI competes on depth and breadth, unifying commerce, ad, and finance sources into one warehouse, then returning prescriptive output instead of another chart. It also normalizes data on ingestion, so you skip the data-cleanup year that Supermetrics users describe, and setup is same-day rather than the multi-week builds a DIY stack demands, the kind of leverage we detail in predictive analytics for ecommerce.
Q5. What Do Real Operators Say About These Tools on Reddit and G2? [toc=5. Operator Verdicts]
Operators are candid. On G2, Triple Whale users praise it for centralizing platforms into one dashboard and cutting manual reporting, while r/PPC threads show operators actively hunting for alternatives. Glew users describe a real setup and payoff timeline. The recurring theme across every source is that no reporting tool saves you if you feed it uncleaned data, a point we stress in our guide to ecommerce data management.
😊 What earns praise on G2
I went straight to the threads rather than trust vendor copy, and the praise is consistent. Operators love when a tool collapses many logins into one view. That is the job they are paying to escape, and it is why teams shop the best Shopify analytics apps so carefully.
"I love how seamlessly it connects our ad platforms and CRM data, showing exactly where our conversions come from and which campaigns drive the most revenue. Its made attribution so much clearer." Verified User Triple Whale G2 Verified Review ⭐⭐⭐⭐⭐
⚠️ Where operators push back and switch
The criticism is just as honest, and it usually lands on two things, data that does not tally with Shopify, and support. Whole Reddit threads exist for founders shopping their way off a tool, which is why we maintain a roundup of Triple Whale alternatives.
"Hey guys I'm looking for a tool other than triple whale when it comes for attribution and analytics." u/mardas, r/PPC Reddit Thread
On G2, the frustration gets sharper when accuracy and service slip at the same time.
"Extremely disappointing customer service... The attribution system is consistently buggy and unreliable, causing more harm than good." Verified User Triple Whale G2 Verified Review ⭐
🧹 The consensus nobody wants to hear
Here is the pattern under all of it. Garbage in, garbage out. Feeding a tool poor or uncleaned data is, bluntly, laziness, and it breaks even good software, which is why clean ecommerce data integration comes first. I will be honest about our own scars too. We once ran native AI forecasting that hallucinated and told fibs, so we shut it down and rebuilt. That taught me to respect clean data above clever features. On review volume, Luca AI is a newer entrant with a shorter trail than Triple Whale, so judge us on architecture, an AI layer over a unified data warehouse (one central store of all your data) that pushes scheduled reports, not on star count we have not earned yet.
Q6. Need to Fund the Growth Your Reports Reveal? How Luca AI's Embedded Capital Compares [toc=6. Embedded Capital Option]
If your reports surface a winning campaign or an inventory buy, Luca AI can fund it inside the same workflow. It competes on capital metrics, namely instant disbursal in hours, not the multi-week bank cycle, dynamically priced fees that reflect current business health rather than a stale application snapshot, right-sized advances instead of maximized ones, and non-dilutive, revenue-responsive repayment. That is the yardstick against providers like Wayflyer and Clearco, and it builds on our thinking about revenue-based financing.
🚂 Why capital timing is its own problem
This section is only for readers who actually need capital. If you do not, skip it. Running a store is like two train tracks, inventory and cash. They have to run in parallel, or you derail. A stockout during a hot week is a cash timing failure, not a demand failure, a link explored in our piece on ecommerce inventory management.
Non-dilutive here means funding that does not cost you equity. Revenue-responsive means repayment flexes with your sales, not a fixed calendar.
💰 Capital metrics, side by side
Luca AI vs Typical Revenue-Based Financing
Capital metric
Luca AI
Typical RBF (Wayflyer, Clearco)
Disbursal time
Hours
Days to weeks
Pricing basis
Dynamic, tied to real-time health
Fixed at application snapshot
Sizing approach
Right-sized to the opportunity
Often maximized to the offer
Repayment
Non-dilutive, revenue-responsive
Non-dilutive, fixed remittance %
The pricing basis is the real edge. When priced against current health, the same capital can land near a 6.2% effective fee rather than a flat 8% set weeks earlier, because the rate reflects where the business is now, the same logic behind tracking ecommerce profit margins in real time.
💸 The disciplined way to size it
Do not take the biggest number offered. Take €50K, prove the return on that campaign or purchase order, then scale the next draw against real results. That habit protects margin.
And know when not to borrow at all. If the money would sit idle, or if your unit economics are underwater, capital just accelerates the loss. Luca AI is built to fund the opportunity your data already justified, not to paper over a leak, a distinction we unpack in declining platform ROAS vs true profitability.
Q7. Which Reporting Tool Is Right for Your Stage and Stack? [toc=7. Pick by Stage]
Under $500K, GA4 plus Shopify Analytics and a lightweight reporting tool is enough. From $500K to $5M, add a reporting-automation layer, and if channel credit is your bottleneck, an attribution tool. Above $5M with cash-sensitive inventory cycles, an AI layer that unifies commerce, marketing, and finance sources delivers the most leverage. Whatever you choose, standardize your data first.
🧭 Match the tool to your stage
The honest truth is that most tools on this list are wrong for most stages. Buying warehouse-grade BI at $300K revenue is like renting a forklift to move a single box, a mismatch we see across ecommerce analytics platforms.
Tool Fit by Revenue Stage
Stage
Team size
Data maturity
Fit
Under $500K
Founder-led
Basic
GA4 and Shopify Analytics
$500K to $5M
2 to 10
Growing
Reporting automation, add attribution if needed
$5M and up
10+, cash-sensitive
Mature
AI layer unifying commerce, marketing, and finance
If you zoom in only on traffic, you miss the forest, the synchronicities between marketing spend, inventory, and cash. That whole-picture view is where the leverage sits past $5M, and it is the promise of true ecommerce business intelligence.
⚙️ A rollout guardrail before you buy
Three rules save most implementations. First, standardize your lookups, agree on how each metric is defined, before you automate. Second, start with one grounding project, like support ticket analysis, not a full migration. Third, keep a human in the loop, because you should never let the AI be your QA. One brand let AI ship unreviewed and paid for it, a risk worth weighing before you adopt agents for ecommerce.
For brands past that $5M seam where finance and marketing data collide, this is exactly where Luca AI fits, and I will say plainly it is overkill below meaningful data volume. So tell me, what are you stitching together by hand right now, and which seam breaks first? That is the conversation worth having.
FAQ's
What is automated data reporting in e-commerce and why does it matter?
Automated data reporting pulls sales, ad spend, traffic, and finance data from every platform into scheduled, refreshed reports. It replaces the Monday morning Excel export where somebody stitches four CSVs into one sheet by hand.
Most founders we talk to are not short on data. They are drowning in it, and still process maybe 5% of what lands in front of them. Automation matters because it gives that time back and keeps decisions current.
Consolidation: one view instead of ten logins.
Freshness: numbers refresh without manual work.
Speed: a CAC spike surfaces in days, not weeks.
We built Luca AI to go one step further, reading the numbers and explaining the why, not just displaying them. You can see how that works in our overview of ecommerce reporting, which walks through turning raw data into scheduled, reasoned reports.
What are the best automated data reporting tools for e-commerce in 2026?
Our 2026 shortlist covers ten tools, each best at a distinct job. No single tool wins for every brand, so we match capability to need.
Luca AI: cross-source, prescriptive reporting over a unified data warehouse.
Whatagraph: automated white-label client reports.
Glew: multi-channel dashboards and segmentation.
Daasity: warehouse-grade BI for analyst teams.
Triple Whale: Shopify paid-social analytics.
Polar Analytics: Shopify-native metrics.
Lifetimely: LTV and profitability.
Peel: retention cohorts.
Supermetrics with Looker Studio: DIY reporting.
GA4: a free traffic baseline.
We rank Luca AI first on reporting merits, because it is built AI-first rather than a dashboard with AI bolted on. For a wider view of the category, our guide to ecommerce analytics platforms compares how these tools fit different stacks and stages.
What is the difference between a reporting tool and an attribution tool?
They are different jobs, and confusing them wastes budget. Think of a car dashboard: attribution is the fuel gauge telling you which tank the mileage came from, while reporting is the full dashboard showing everything at once.
Attribution: decides which channel earned a sale, for example Triple Whale or Northbeam.
Reporting automation: assembles your numbers across every source, then explains what happened and why.
If you are triangulating spreadsheets at 11pm, you need a reporting layer first. Add attribution only when channel credit is your real bottleneck.
To be clear, Luca AI is not an attribution pixel. It is an AI layer over a unified warehouse that extracts, predicts, simulates, and finds root cause, then complements your pixel rather than replacing it. We explain the boundary further in our breakdown of ecommerce conversion tracking, so you buy the right layer for your actual problem.
How much do automated e-commerce reporting tools cost?
Pricing spans a wide range, and the sticker price often hides the real bill. Costs run from free with GA4 up to roughly $300 to $800 a month once brands stack overlapping tools.
Free tier: GA4 for a traffic baseline.
Mid-market: most dedicated tools land between $79 and $999 monthly.
Warehouse BI: Daasity and similar reach $2,000+ monthly.
The trap is overlap. A typical $5M brand buys three tools that report the same revenue number twice, and global pricing outside the US adds another gap most listicles ignore. We suggest budgeting roughly 0.5% to 1.5% of monthly ad spend on tooling.
Consolidation is where the margin hides, which is a core reason we designed Luca AI's transparent tiers, Starter, Growth, and Scale. Our note on ecommerce profit margins shows how trimming a bloated stack protects contribution margin directly.
Which reporting tool is right for my e-commerce stage?
The honest answer is that most tools are wrong for most stages. Buying warehouse-grade BI at $300K revenue is like renting a forklift to move one box, so match the tool to your stage.
Under $500K: GA4 plus Shopify Analytics and a lightweight reporting tool.
$500K to $5M: add a reporting-automation layer, then attribution only if channel credit is the bottleneck.
$5M and up: an AI layer that unifies commerce, marketing, and finance sources.
Whatever you choose, standardize your data first, start with one grounding project, and never let the AI be your only QA.
For brands past the $5M seam where finance and marketing data collide, this is exactly where Luca AI fits, and we will say plainly it is overkill below meaningful data volume. Our piece on ecommerce business intelligence maps this staging in more depth so you avoid overbuying.
Enjoyed the read? Join our team for a quick 15-minute chat — no pitch, just a real conversation on how we’re rethinking Ecommerce with AI - Luca
Loading Schedule...
Your AI Co-Founder is here.
Here’s why:
Shopify, Meta, Xero - one brain.
"Should I scale?" Answered with real data.
Growth capital. No applications. One click.
Thank you! Your submission has been received! Please book a time slot for the Meeting
Oops! Something went wrong while submitting the form.