10 Best Shopify Reporting Apps: Reviewed Across Profit, LTV, Cohort, Inventory, and Multi-Store Reporting Use Cases
13
mins read
TL;DR
Native Shopify Analytics cannot reconcile ad spend, COGS, cohorts, and inventory in one place, which is why operators install reporting apps. Lifetimely and Polar Analytics lead profit and cohort LTV, Report Pundit and Mipler win multi-store and inventory, and Better Reports leads metafield-deep custom builders. We score apps across reviews, reporting depth and reasoning, setup and metafield handling, pricing transparency, and EU/UK data residency. Match by tier: under 1M EUR use Report Toaster, 1M to 10M EUR use Lifetimely or Polar, 10M EUR plus or multi-store use Report Pundit or Better Reports. Most apps stop at the chart; Luca AI sits as a reasoning layer over the warehouse, extracting, predicting, simulating, and pushing scheduled reports to Slack and email. Amazon's negative 53-day cash conversion cycle, Gymshark's 49M GBP stuck inventory, and Allbirds' omnichannel stockouts prove reporting is a reasoning problem, not a chart problem.
Q1: What Are the 10 Best Shopify Reporting Apps for E-commerce in 2026? [toc=1. Top 10 Shopify Reporting Apps]
A founder doing $80K a month on Shopify pinged me on a Sunday night, panicked. His Meta dashboard, Shopify admin, and Lifetimely dashboard each told him a different story about Q4 profit. He had seven tabs open and zero answers. That is the real reason most operators install a reporting app, not for prettier charts, but because native Shopify Analytics cannot reconcile ad spend, COGS, cohorts, and inventory in one place. The shortlist below is built for that founder, not for the data team he does not have.
The 10 best Shopify reporting apps in 2026 are Luca AI, Report Pundit, Better Reports, Lifetimely by AMP, Polar Analytics, Mipler Advanced Reports, Report Toaster, Data Export IO, Lebesgue, and Putler. Picks weight Shopify App Store ratings, G2 reviews, custom report builder depth, multi-store consolidation, profit and cohort LTV reporting, scheduling cadence, and whether the tool reasons over the data warehouse or just visualises history.
200+ prebuilt reports, custom builder, multi-store, Google Sheets sync
Multi-store and custom reporting
$9 / Month, $35 / Month
Better Reports ⭐⭐⭐⭐
Custom reports, metafield deep, scheduled exports
Mid-market custom builders
$19.90 / Month, $299.90 / Month
Lifetimely by AMP ⭐⭐⭐⭐
Cohort LTV, P&L, CAC payback, MCP integration
Cohort and profit reporting
Free, $399 / Month
Polar Analytics ⭐⭐⭐⭐
Cross-channel marketing, AI insights, Polar Pixel
Paid media analytics
$300 / Month, $1,500 / Month
Mipler Advanced Reports ⭐⭐⭐
Sales, tax, inventory, AI assistant for reports
Finance and tax reporting
Free, $99 / Month
Report Toaster ⭐⭐⭐
Prebuilt and custom reports, scheduled email
Budget conscious operators
Free, $30 / Month
Data Export IO ⭐⭐⭐
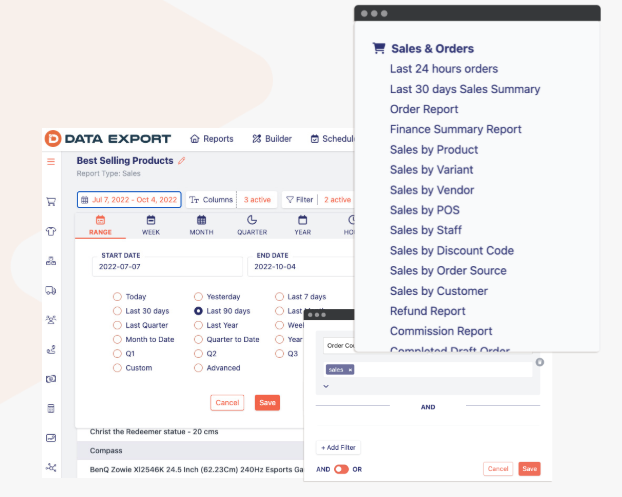
Scheduled exports, FTP, Drive, Sheets
Data piping into BI stacks
Free, $25 / Month
Lebesgue ⭐⭐⭐
Predictive LTV, competitor benchmarks, ad audits
Predictive LTV and benchmarking
Free, $249 / Month
Putler ⭐⭐⭐
Multi-source dashboards, RFM segments
Merchants on multiple platforms
$20 / Month, $250 / Month
1. Luca AI
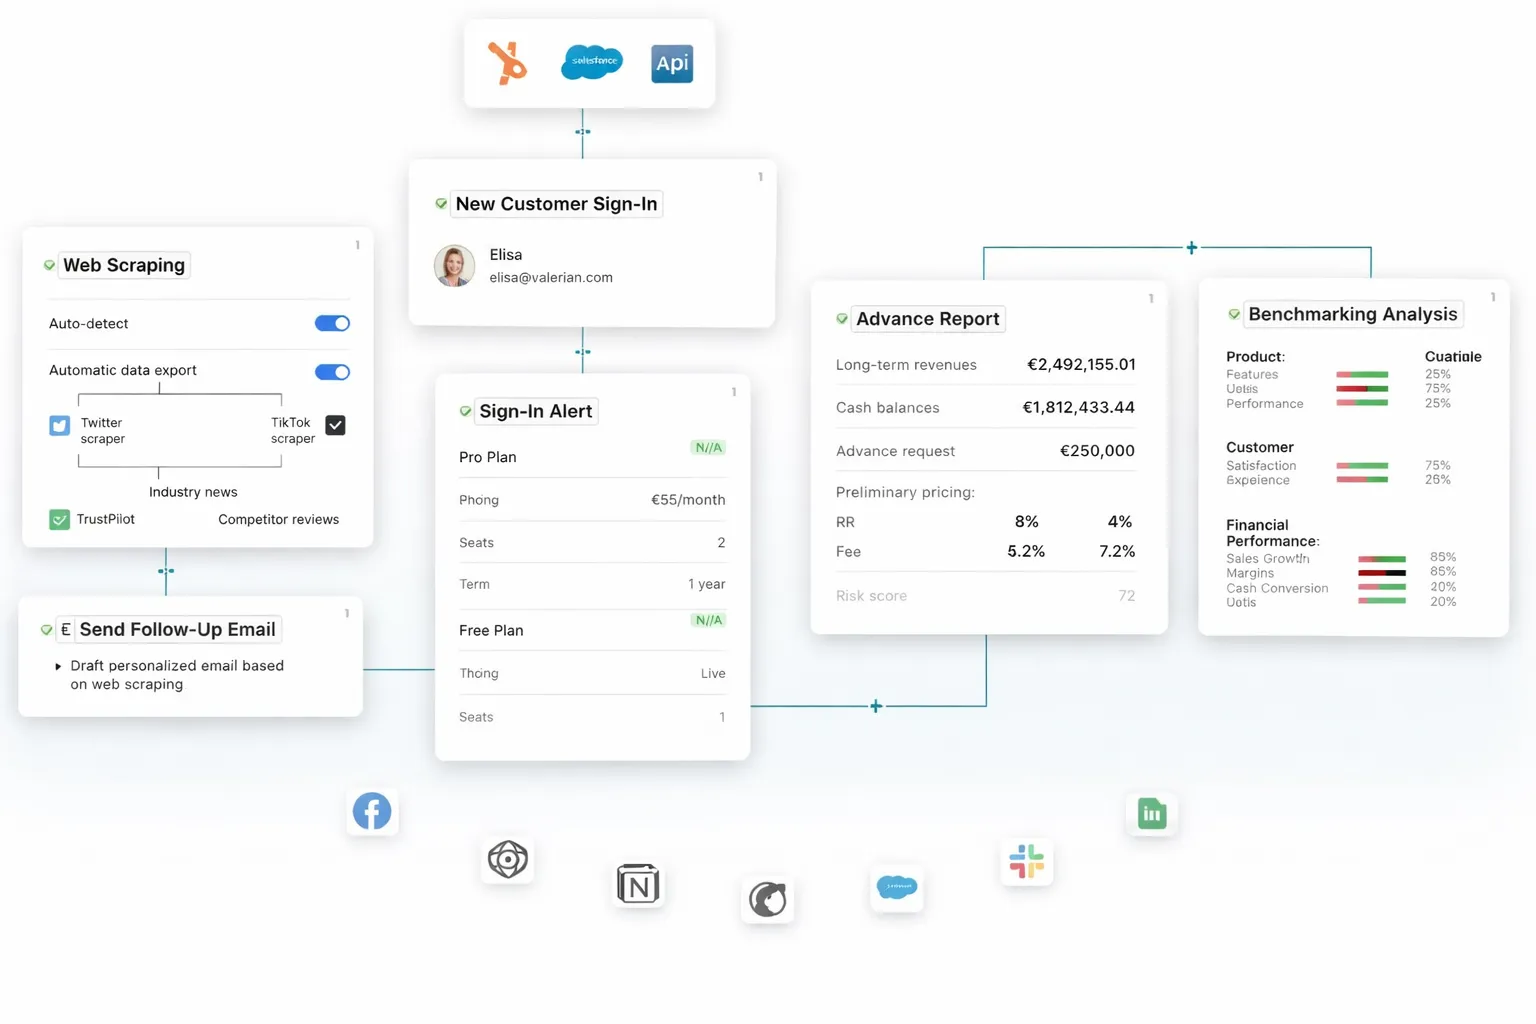
Luca AI workflow showing Shopify reporting apps reasoning layer connecting CRM, web scraping, sign-in alerts, advance financial reports, and benchmarking analysis across integrated data sources.
Why did we choose this tool?
I'm Eric, founder at Luca. I'm placing Luca first because of how it actually works on Shopify data, not because my name is on the cap table. Most apps below build a dashboard; Luca is an AI layer over your data warehouse. Ask in plain English, get the slice, the prediction, the root cause, and the recommendation. No SQL, no analyst, no dashboard building. Most analytics tools added AI. Luca is AI.
📊 Solutions Offered
✅ Conversational queries over Shopify, Meta, Klaviyo, Xero, and bank data in plain English
✅ Root cause, simulation, and predictive analysis on warehouse-scale data
✅ 24/7 outlier alerts on ROAS, CAC, MER, and inventory thresholds
✅ Agentic scheduled reports pushed to Slack and email with reasoning and charts
✅ Data normalised on ingestion, so you skip the data-cleanup year
A €6M skincare DTC brand on Shopify Plus running Meta and Klaviyo.
⚠️ The problem: The founder spent 12 hours a week reconciling Meta CPM spikes against Shopify revenue and Klaviyo flow performance. Reports were always 3 days late.
💡 How Luca helped: We connected Shopify, Meta, Klaviyo, and Xero. Luca normalised the data, ran 24/7 outlier alerts, and pushed a Monday morning P&L with reasoning to the founder's Slack.
📈 The outcome: Time to insight dropped from 12 hours to 22 minutes a week. Luca surfaced a creative-fatigue pattern on the top campaign 2 weeks earlier than the team caught it manually, preserving roughly €18K in ad spend.
⭐ Reviews
"Luca pings me when ROAS dips, and tells me why before I open Shopify. It replaced three reporting tabs in my morning routine." DTC operator Luca Customer Interview
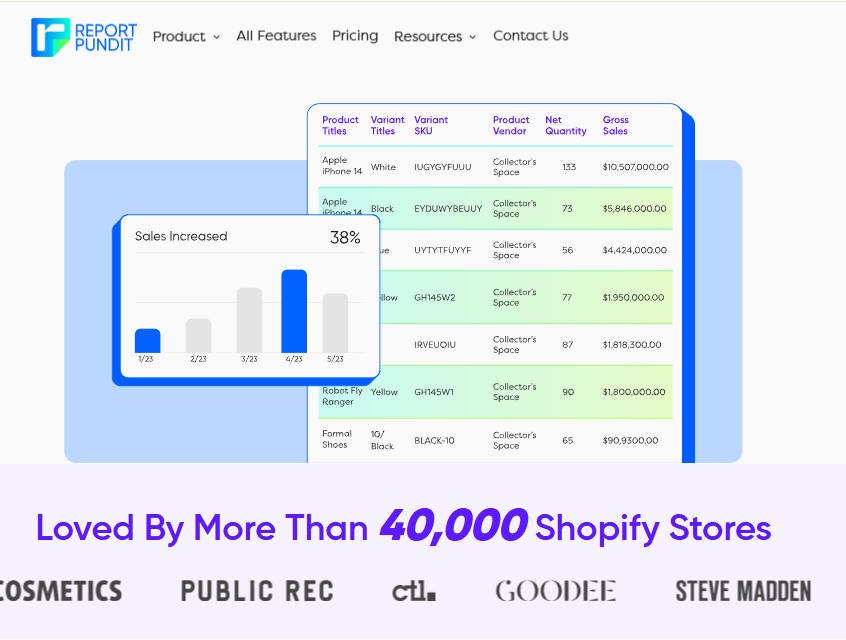
Report Pundit interface highlighting a Shopify reporting apps custom builder with product titles, variant SKUs, vendors, net quantity, and gross sales across 40,000 stores.
Why did we choose this tool?
Report Pundit covers what native Shopify reports cannot, including metafield-level data, multi-store consolidation, and Google Sheets sync. It is the operator default for custom report builders.
📊 Solutions Offered
✅ 200+ prebuilt reports across sales, inventory, tax, and customers
✅ Custom report builder with metafield and tag support
✅ Multi-store consolidation in a single dashboard
✅ Scheduled exports to email and Google Sheets
✅ Live chat support that builds reports for you
❤️ Best for
Operators running 2 or more Shopify stores who need custom reporting.
⭐ Reviews
"Pulls all your data from Shopify and allows you to create pretty much any report you can imagine. Even things like metafield data which Shopify does not pull into its native reports." Taco Moto Co., Verified Merchant Report Pundit Shopify App Store Verified Review
"They have some issues with data feeds, both from Shopify and also when exporting reports on set schedules to Google Sheets, but they have very responsive customer support and most issues are resolved within 24 hours." Verified Merchant Report Pundit Shopify App Store Verified Review
3. Better Reports
Why did we choose this tool?
Better Reports is the premium custom-report builder operators reach for when metafield depth and scheduling reliability matter more than price.
📊 Solutions Offered
✅ Custom report builder with deep metafield support
✅ 60+ prebuilt reports for sales, inventory, customers, and POS
✅ Scheduled exports to email, Google Sheets, and Drive
✅ Free report-building service with the team
✅ 14-day free trial across all tiers
❤️ Best for
Mid-market Shopify Plus stores with metafield-heavy catalogues.
⭐ Reviews
"I have used this app daily for 5 years. The customer support is second to none. They are extremely fast, friendly, patient, and do whatever it takes to help you get any information you need." Verified Shopify Merchant Better Reports Shopify App Store Verified Review
"The reports are also much more detailed than Shopify offers. I thought it was a little pricey, however their customer service has proven it to be worth it." Verified Shopify Merchant Better Reports Shopify App Store Verified Review
4. Lifetimely by AMP
Why did we choose this tool?
Lifetimely owns the cohort LTV and profit P&L conversation in DTC. Its CAC payback and historical cohort views are what most growth leads check on Monday morning.
📊 Solutions Offered
✅ Cohort LTV with 6, 12, and 24-month windows
✅ Real-time P&L with custom COGS and ad cost integration
✅ CAC, AOV, and repeat-purchase reporting by channel
"This app removes the hassle of calculating a customer's CAC, and a customer's LTV. I needed help figuring out something, and their customer support (Sam) answered immediately over chat." Verified Shopify Merchant Lifetimely Shopify App Store Verified Review
"Support is very slow, the app does not load the prices and the price is far too expensive. If I pay 150 euros a month, I expect direct live support." Verified Shopify Merchant Lifetimely Shopify App Store Verified Review
5. Polar Analytics
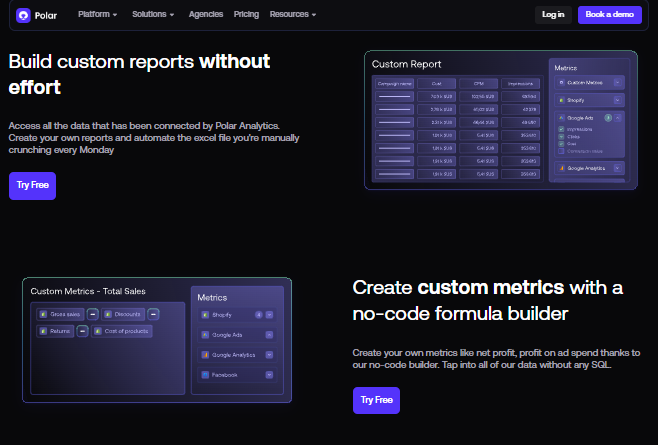
Polar Analytics interface showcasing Shopify reporting apps custom report creation, no-code metric builder, and net profit calculations across Shopify, Google Ads, and Facebook data.
Why did we choose this tool?
Polar Analytics consolidates Meta, Google, TikTok, Klaviyo, and Shopify into one cross-channel view, with the Polar Pixel for first-party signal.
📊 Solutions Offered
✅ Cross-channel marketing dashboards in one place
✅ Polar Pixel for first-party attribution signal
✅ AI insights and anomaly alerts
✅ Custom dashboards without SQL
✅ Native Shopify, Klaviyo, Meta, and Google integrations
❤️ Best for
Paid media leads who need attribution-aware reporting.
⭐ Reviews
"We went from having data in multiple different places to all of our sales data in one place. We have already started using the findings to adjust our paid media campaigns and have seen improvements in ROAS." Verified User Polar Analytics G2 Verified Review
"Polar does an even better job of the visualisations, but now we're able to easily interrogate the data further to help shape our activity and drive more results." Verified User Polar Analytics G2 Verified Review
6. Mipler Advanced Reports
Why did we choose this tool?
Mipler covers the unglamorous but critical reports finance teams ask for, including tax, inventory, and metafield-driven custom reports, with an AI Assistant that drafts new columns.
📊 Solutions Offered
✅ Sales, financial, tax, customer, and inventory reports
✅ Custom columns with metafields, tags, and note attributes
✅ Scheduled email exports as CSV, Excel, or PDF
✅ Public report sharing without Shopify admin access
✅ AI Assistant that helps create or adjust reports
❤️ Best for
Finance and operations leads who need tax-grade exports.
⭐ Reviews
"Easily generate sales, financial, tax reports, customer analysis and inventory reports. The AI Assistant helps create or adjust reports and even add new columns." Verified Merchant Mipler Advanced Reports Shopify App Store Verified Review
"Rated 5.0/5 by Shopify merchants, but the cheaper tiers can feel limiting once you're consolidating across stores." Verified Merchant Mipler Storecensus Verified Review
7. Report Toaster
Why did we choose this tool?
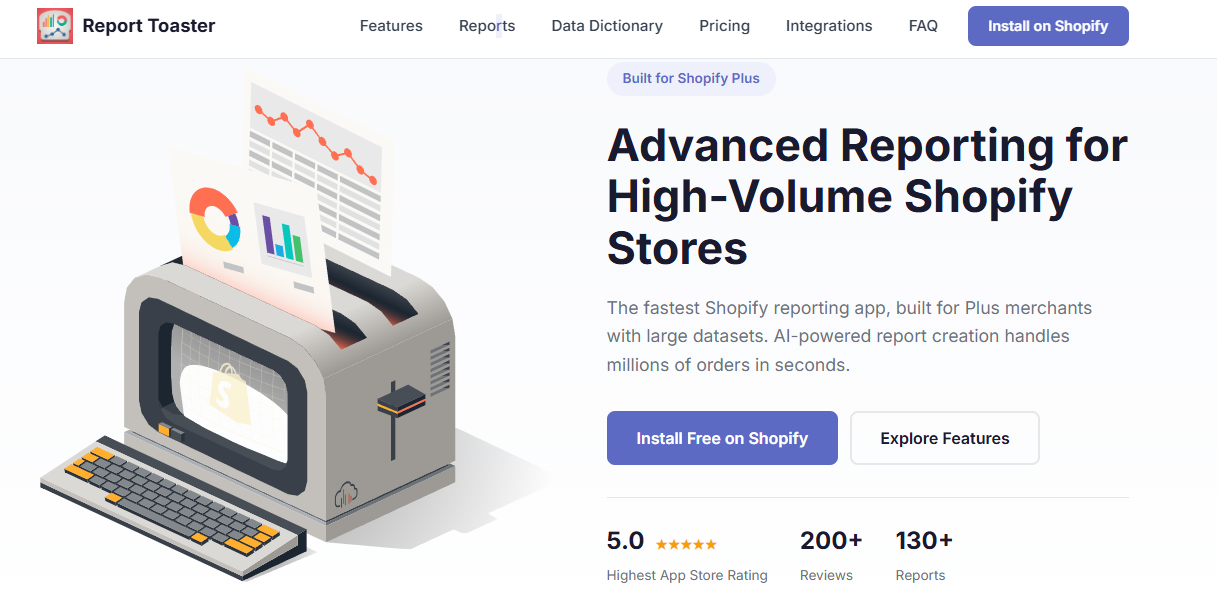
Report Toaster is the budget operator's pick for prebuilt reports plus a usable custom builder, recommended unprompted on r/shopify.
📊 Solutions Offered
✅ 80+ prebuilt reports, including inventory and POS
✅ Custom builder with filters and calculated fields
✅ Scheduled email reports
✅ Multi-store support on higher tiers
✅ Free starter plan
❤️ Best for
Sub €1M stores that want depth without €100/month commitments.
⭐ Reviews
"One of the best reporting apps I've ever used is Report Toaster. They have a ton of prebuilt reports but you can manually build almost anything." Shopify merchant, r/shopify Reddit Thread
Putler is the rare merchant dashboard that handles Shopify alongside Stripe, PayPal, WooCommerce, and Etsy in one view, with built-in RFM segments.
📊 Solutions Offered
✅ Multi-source dashboards across Shopify, Stripe, PayPal, and more
✅ Built-in RFM customer segmentation
✅ Sales, product, and subscription reporting
✅ Daily email digests
✅ Free 14-day trial
❤️ Best for
Operators selling on Shopify and at least one other platform.
⭐ Reviews
"Putler lets us monitor all our eCommerce data from a single dashboard, across Stripe and Shopify. It saves real time." Verified User Putler G2 Verified Review
"Reports are comprehensive, though the UI feels dated next to newer tools." Verified User Putler G2 Verified Review
What this list actually means for your Monday
Most of these apps stop at the chart. Luca sits as an AI layer over the same data warehouse, extracts the slice you ask for, predicts forward, simulates "what if" decisions, finds root causes, and pushes scheduled reports to Slack and email. After looking at thousands of Shopify P&Ls, what jumps out is that the operators who outgrow the rest do not have more dashboards. They have a system that pings them when something matters and leaves them alone the rest of the day.
Q2: How Did We Score These Shopify Reporting Apps? [toc=2. Scoring Methodology]
Choosing a reporting app on star count alone is how operators end up paying €299 a month for charts they never open. The shortlist above was scored against a five-criterion framework that respects how a real Shopify operator buys, uses, and renews a tool. We weight reasoning depth above feature counts, and we pull EU and UK data residency forward as a first-class criterion most listicles ignore.
The decision dilemma
Every reporting app in the Shopify App Store claims "powerful insights." Most of them deliver static charts that need a junior analyst to interpret. The real question for a founder is simpler.
Can this tool answer "why did MER drop on Tuesday?" without a 40-minute pivot-table session? MER means Marketing Efficiency Ratio, total revenue divided by total ad spend.
The flawed shortcuts to avoid
Two cheap heuristics get founders into trouble. First, picking the cheapest free-tier option, then realising it cannot read your metafields. Second, picking the app with the most integrations, regardless of whether they are useful.
❌ Cheapest tool wins, ignores total cost when you outgrow the tier.
❌ Most integrations wins, ignores whether the data is actually queryable.
✅ Best fit on reasoning depth, scheduling reliability, and compliance posture.
The 5-criterion scoring framework
Each app is scored out of 100. Weights are tuned for SMB and mid-market Shopify operators, not enterprise BI teams.
5-Criterion Scoring Framework for Shopify Reporting Apps
Criterion
Weight
What we tested
User Reviews
15%
Verified Shopify App Store and G2 reviews from the last 24 months
Reporting Depth and Reasoning
30%
Custom builder, cohort, profit, predictive vs historical, root-cause
Setup, Metafield Depth, and Scheduling
20%
Time to first useful report, metafield support, push cadence to Slack and email
Pricing Transparency
20%
Public pricing, free trial, no quote-to-cart games
Compliance and Data Residency for EU and UK
15%
GDPR posture, EU hosting, audit logs
The weights total 100. We do not publish raw scores in the article, only the resulting star band.
How to read the stars
⭐ 1 star, 0 to 20: skip unless you have a very narrow use case.
⭐⭐ 2 stars, 21 to 40: works for sub €1M stores with simple needs.
⭐⭐⭐ 3 stars, 41 to 60: solid mid-tier pick.
⭐⭐⭐⭐ 4 stars, 61 to 80: best-in-class for a specific use case.
⭐⭐⭐⭐⭐ 5 stars, 81 to 100: covers the full reasoning surface, not just visualisation.
Where Luca AI lands
Luca AI scores 5 stars for one reason that has nothing to do with our cap table. It is the only entry that reasons across the data warehouse rather than visualising it. Most analytics tools added AI. Luca is AI.
After looking at thousands of DTC P&Ls, what jumps out is that the operators who win do not own more dashboards. They own a system that extracts the slice, predicts forward, simulates "what if," and finds root causes on demand, then pushes scheduled reports to Slack and email without anyone asking.
The honest trade-off
Luca is overkill if you are sub €10K MRR or pure marketplace-only. In that case, Report Toaster or native Shopify Analytics is fine. Score the framework yourself before you renew anything.
Q3: Which Shopify Reporting App Wins Your Use Case, Profit, LTV, Cohort, Inventory, or Multi-Store? [toc=3. Use Case Winners]
Lifetimely and Polar Analytics lead profit and contribution-margin reporting. Lifetimely and Lebesgue dominate windowed cohort LTV (LTV means Lifetime Value, total gross profit a customer generates) and predictive LTV. Report Pundit and Mipler win multi-store and inventory consolidation. Better Reports leads metafield-deep custom builders. Putler covers light multi-store dashboards. Luca AI sits above all five as a reasoning layer pushing reports to Slack and email autonomously.
Profit and contribution margin
Contribution margin is revenue minus COGS minus variable costs like ad spend and shipping. It is the number that tells you if a sale was actually worth taking.
✅ Lifetimely connects Meta, Google, and Klaviyo costs directly against Shopify revenue, so the P&L is live, not weekly.
✅ Polar Analytics adds the Polar Pixel for first-party signal, useful when iOS attribution windows shrink your reported ROAS.
❌ Better Reports nails custom builds but needs you to wire COGS metafields yourself.
"This app removes the hassle of calculating a customer's CAC, and a customer's LTV. Their customer support answered immediately over chat." Verified Shopify Merchant Lifetimely Shopify App Store Verified Review
Cohort and LTV, historical vs predictive
Cohort analysis groups customers by their first-purchase month, then tracks cumulative spend over time. It is the cleanest way to see if Q1 acquisition pays back faster than Q3.
✅ Lifetimely is the historical leader on 6, 12, and 24-month windowed cohort LTV.
✅ Lebesgue is the predictive leader, projecting forward LTV with competitor benchmarks baked in.
❌ Polar handles cohorts, but its strength is cross-channel attribution, not LTV depth.
The LTV mirage
Most apps obsess over purchase frequency. Anthony Mink shared a contrarian read that customers buying across 3 or more product categories drive 50 to 100% higher LTV than frequency alone. Almost no reporting app surfaces that lens by default. Luca does, because it queries the warehouse, not a pre-built cohort dashboard.
Inventory and multi-store
Retailers lose roughly 6% of revenue to inventory distortion every year. Multi-store operators feel it twice.
✅ Report Pundit consolidates 2 or more Shopify stores in one report and exports to Sheets on schedule.
✅ Mipler covers tax, financial, and inventory reports, including AI-assisted column creation.
✅ Putler covers light multi-source dashboards across Shopify, Stripe, and PayPal.
❌ Native Shopify Analytics still cannot consolidate two stores cleanly without exports.
"Pulls all your data from Shopify and allows you to create pretty much any report you can imagine, even metafield data which Shopify does not pull into its native reports." Taco Moto Co., Verified Merchant Report Pundit Shopify App Store Verified Review
Custom builder, metafield depth, and scheduling
Operators get burned when scheduling fails silently or metafields drop on export.
✅ Better Reports has the deepest metafield support and reliable scheduled exports to email, Sheets, and Drive.
✅ Report Pundit matches on metafields and adds multi-store as a native column.
✅ Data Export IO is the piping layer to FTP, Drive, and Sheets when you already run downstream BI inside your tech stack.
❌ Cheaper tiers across all three throttle scheduling cadence below daily.
Segment activation
Reporting is wasted if the segments cannot reach Klaviyo or Meta.
✅ Lebesgue and similar tools can push RFM segments to Klaviyo without a manual CSV.
❌ Most pure reporting apps stop at the chart and leave activation to the founder.
The head-to-head table
Use Case Winners Across Shopify Reporting Apps
Use case
Winner
Runner-up
What to watch
Profit and margin
Lifetimely
Polar Analytics
COGS hygiene
Historical cohort LTV
Lifetimely
Polar Analytics
24-month window
Predictive LTV
Lebesgue
Polar Analytics
Forecast confidence
Inventory and multi-store
Report Pundit
Mipler
Schedule reliability
Metafield-deep custom builder
Better Reports
Report Pundit
Daily cadence on cheap tiers
Segment activation
Lebesgue
Datadrew
Klaviyo push fidelity
Eric's read
In our work with bootstrapped Shopify operators, the pattern is clear. Founders install three or four of these apps, then never open two of them. The honest fix is not "buy a fifth dashboard." It is to layer a reasoning engine over the same data sources, so the question "why did Q4 cohort LTV drop on Lifetimely vs Q3?" gets answered in chat, not in a 4-tab pivot session.
Q4: How Should You Match a Reporting App to Your Revenue Band, SKU Count, and Multi-Store Status? [toc=4. Match by Revenue Band]
Under €1M revenue with fewer than 500 SKUs, Report Toaster or Data Export IO is enough. €1M to €10M with active paid media, Lifetimely or Polar Analytics. €10M+ or multi-store, Report Pundit or Better Reports. SKU-heavy catalogues, Mipler. EU or UK operators with data-residency rules should filter for GDPR-compliant hosting before integration count. Operators who want answers, simulations, and root-cause reasoning should layer Luca AI over the warehouse.
Score your stack in 60 seconds
Tick every box that is true today. Each unchecked item is a gap your reporting app should close.
⏰ I can answer "what is my contribution margin by channel last week?" in under 60 seconds.
💸 I know my cash-conversion cycle, the days between paying suppliers and collecting from customers.
✅ My COGS sit in Shopify metafields or a connected source, not a Google Sheet.
✅ Scheduled reports land in Slack or email weekly, with reasoning attached.
✅ I can consolidate 2 or more Shopify stores without manual exports.
✅ I know if my data is hosted in the EU or US, and which my customers expect.
✅ My finance lead and growth lead see the same numbers, not different exports.
✅ My ad-spend volume above €25K a month gets attribution-aware reporting, not blended ROAS guesses.
Score interpretation
⭐⭐⭐⭐⭐ 7 to 8 ticks: your stack is mature, optimise rather than overhaul.
⭐⭐⭐ 4 to 6 ticks: you have real gaps, especially around scheduling and compliance.
⚠️ 0 to 3 ticks: you are running on fragmented data and weekly heroics.
The Delivery Cube
After looking at thousands of DTC P&Ls, the choice is rarely "which app." It is which delivery model.
DIY, manual spreadsheets, fine under €1M, breaks above.
DWY (Done With You), an agency or fractional analyst, fine when you have less than €10K a month to spend on labour.
GDPR-conscious operators should ask vendors three questions. Where is data hosted? What gets deleted on churn? Are audit logs available? Most listicles skip this entirely.
I could be off on edge cases. A €4M brand with 30,000 SKUs and a strict EU hosting clause looks more like a €10M tier, not the €1M to €10M default. Always score your own stack first, then pick.
Q5: What Did Amazon, Gymshark, and Allbirds Teach Us About Reporting? [toc=5. Lessons from Amazon, Gymshark, Allbirds]
Amazon runs on a 53-day negative cash conversion cycle (the days between paying suppliers and collecting from customers) because its reporting connects payments, inventory, and supplier terms in real time. Gymshark hit roughly £49M in stuck inventory partly because reporting could not surface the cash impact of scaling fast. Allbirds lost sales when warehouse and retail inventory reports lived in silos. Reporting is not a chart problem. It is a reasoning problem.
The benchmark hook, Amazon's negative 53 days
Amazon collects cash from customers almost instantly while paying suppliers 53 days later. That float, around $30B in working capital, funds AWS, logistics, and new bets. The reporting stack makes this visible daily, not quarterly.
The architectural insight: the company that controls its cash conversion cycle controls its growth velocity. Most Shopify operators run a 30 to 60 day cycle without knowing the number.
The Gymshark lesson
Gymshark scaled from a garage to a $1.4B valuation. By 2022, its filings showed close to £49M in inventory and a stretched cash position partly because reporting did not surface the cash drag of rapid growth.
❌ Their reporting stack tracked revenue beautifully.
❌ It struggled to show the cash impact of inventory expansion in real time.
✅ The fix was unifying inventory, supplier, and revenue reporting in one view.
"By the time the dashboards showed the problem, the cash was already locked in stock." DTC operator, r/ecommerce Reddit Thread
The Allbirds lesson
When Allbirds went omnichannel, warehouse-only fulfilment caused stockouts on best sellers in retail stores. They could measure lost sales but could not recover them because reports did not unify the two inventory pools.
The pattern across Amazon, Gymshark, and Allbirds is consistent. Visibility is a prerequisite to action. Without unified reporting, the founder becomes the manual integration layer at midnight.
The pattern recognition
Founders who control the cash conversion cycle outgrow those who do not, regardless of revenue tier.
Inventory distortion costs retailers an estimated $1 trillion a year, roughly 6% of revenue per brand.
Reporting failures rarely look like reporting failures. They look like cash crunches and stockouts.
What this means for a Shopify operator at €5M
You are not Amazon. You do not have 60-day supplier terms. The same physics still apply on a smaller scale. Every day cash sits locked in inventory or awaiting Stripe payouts is a day you cannot reinvest in a winning Meta campaign.
Eric's read
After looking at thousands of DTC P&Ls, what jumps out is that operators with siloed reporting always discover the problem 2 or 3 weeks late. Ari Tulla at ELO Health spent $10M building a proprietary algorithmic platform that was outperformed 10x by off-the-shelf LLMs within a year. Ken Price at Blake Mill described managing merchandising data without an intelligence layer as "drinking from a fire hydrant."
In our work with bootstrapped Shopify operators, the breakthrough rarely comes from a prettier chart. It comes from a system that reasons across the warehouse data and pings the founder when something matters. Amazon built a $1.5T business on cash cycle mastery. The smaller operator does not need the scale. They need the visibility.
Q6: Questions to Ask Before You Install a Shopify Reporting App [toc=6. Pre-Install Questions]
Most app-store regrets come from skipping 8 questions. Ask the vendor about hosting, metafield handling, scheduling cadence, multi-store consolidation, exit, segmentation push, AI claims, and reasoning depth. The answers separate dashboards from systems that actually reduce founder workload.
Q1, where is data hosted?
"Our compliance team needs EU hosting, can you confirm?" GDPR fines and customer trust both live here. Verify the hosting region in the contract, not just the marketing site.
A €40M omnichannel brand running NetSuite cannot afford a vendor that cannot name its data region in writing. Ask for the SOC 2 report and the sub-processor list before the second call.
Q2, how deep is metafield support?
"Will this read my custom metafield COGS, or only the default schema?" Native Shopify reports skip metafields entirely. Better Reports and Report Pundit handle them, others do not.
If your COGS, supplier lead time, or category tags live in metafields, half the apps in the App Store cannot read them. That gap quietly distorts every margin report you run.
Q3, how granular is scheduled-report cadence?
"Can I get a daily Slack push at 8 a.m., not just a weekly email?" Many cheap tiers throttle scheduling below daily. Ask for the exact cadence on your tier, in writing.
A growth operator 14 months into their first ecom role does not need another email digest at midnight. They need a Monday 8 a.m. Slack ping with last week's CAC by channel, not a chart they have to interpret.
Q4, can it consolidate two or more Shopify stores?
"What is the workflow for unified reporting across stores?" Most apps need one install per store and a manual merge. Report Pundit and Mipler are exceptions.
Q5, what happens to my reports if I churn?
"Do I get a CSV export of every saved report on cancellation?" Operators get burned when proprietary report logic vanishes with the subscription. Demand portability before signing.
A Head of Finance who lost 18 months of cohort logic to a vendor lockout will never trust the next vendor without a written portability clause. Get it in the order form.
Q6, can it push segments to Klaviyo or Meta?
"Can RFM segments (Recency, Frequency, Monetary) sync to my ESP automatically?" Reporting is wasted if activation needs a manual CSV upload. Lebesgue and Datadrew do this; most do not.
Q7, is the AI real or a chatbot wrapper?
"Show me the AI answering 'why did MER drop on Tuesday?' on my data, live." Many vertical apps bolt on a chatbot. r/shopify operators have called native Sidekick forecasting "rubbish" in evaluation threads.
A real reasoning engine pulls the slice, runs the math, and explains why. A chatbot wrapper rephrases your question and serves the same chart you already had.
Q8, can it reason or only visualise?
"Can it answer 'why' and simulate 'what if?'" Dashboards report what happened. A reasoning layer extracts, predicts, simulates, finds root causes, and surfaces influencing components.
✅ Reasoning engines pull the slice you ask for in plain English.
✅ They predict forward and simulate "if I cut Meta 20%."
❌ Static dashboards wait for you to ask, then show only what you queried.
Eric's read
I could be off here, but the founders who skip these 8 questions usually rebuild their reporting stack within 18 months. In our work with Shopify operators, the scheduling cadence question alone has saved teams from 2 hours a week of manual exports.
"You can build pretty much any report you can imagine, even metafield data which Shopify does not pull into its native reports." Taco Moto Co., Verified Merchant Report Pundit Shopify App Store Verified Review
If a vendor cannot answer Q7 and Q8 with a live demo, you are buying a chart, not a co-pilot.
Q7: How Does an AI Reasoning Layer Replace the Reporting App Stack? [toc=7. AI Reasoning Layer]
Most reporting apps stop at the chart. An AI reasoning layer sits over your data warehouse, ingesting Shopify, Meta, Klaviyo, Xero, and bank data, normalising on ingestion, then answering cross-functional questions in plain English. It extracts, predicts, simulates, finds root causes, and surfaces under and over-performing components. Agentic reports ship on schedule to Slack and email. Most analytics tools added AI. Luca is AI.
The fragmented reporting reality
A €5M Shopify brand typically uses 8 to 12 disconnected tools. Shopify for sales, Meta for ads, Klaviyo for retention, Xero for accounting, and Sheets for everything in between. Operators spend 10 to 15 hours a week reconciling data they should be acting on.
This is the Monday Shudder, the dread of opening 6 tabs to answer one question.
The dashboard critique
Looker, Tableau, and Triple Whale are excellent at one thing. They display history. CAC means Customer Acquisition Cost, total ad spend divided by new customers acquired.
❌ Static dashboards wait for the founder to ask.
❌ They miss cross-functional context, marketing data without cash flow, or revenue without inventory.
❌ Native Shopify Analytics cannot reconcile Meta spend against Xero cash without manual work.
The synthesis thesis
The next layer is not another chart. It is reasoning over the warehouse. The competitive advantage is no longer having data. It is having a system that can reason across it.
✅ Ask in plain English, no SQL, no analyst, no dashboard-building.
✅ The system extracts the slice, runs the math, and explains the answer.
✅ It simulates "if I cut Meta 20% and shift to TikTok, what happens to MER?"
What an AI reasoning layer actually does
We built Luca on six analytics capabilities, plus agentic delivery. It is the closest thing in market to a junior data analyst who never sleeps.
📊 Extract: pulls the relevant slice from the warehouse on demand
⏰ Predict: projects forward LTV, CAC, and inventory burn
🔁 Simulate: tests "what if" scenarios across marketing, finance, and ops
🔍 Root cause: explains why MER dropped, not just that it did
⭐ Identify influencing components: ranks the metrics actually moving the outcome
Agentic delivery means scheduled reports push to Slack and email with reasoning attached, not just charts. Operators set goals like "weekly CAC by channel with attribution baked in," and Luca runs them autonomously.
Cohort-level vigilance, without the cohort-level dashboard
Cohort vigilance used to require a dedicated dashboard and a junior analyst. The reasoning layer flips the model. Luca scans the cohort patterns 24/7 and pings the founder only when something deviates.
The defining quote
"Data needs action. Action needs reasoning. Most analytics tools added AI. Luca is AI." Eric Bidinger, Founder, Luca AI
What I'm Thinking About Next
Where I think this shifts in the next 18 months is honest. Most reporting apps will quietly ship "AI" features that are chatbot wrappers over their existing dashboards. A few will rebuild on a reasoning layer architecture, and the rest will shrink. The question I am sitting with is how Shopify operators will price the trade-off between paying €99 a month for prettier charts and paying €299 to €499 a month for a system that retires the Monday Shudder. If you are running that trade-off right now, I would love to hear what tipped the decision either way. Send me your stack and your weekly hours-on-reporting estimate, and I will share what we are seeing across pilots this quarter.
FAQ's
What is the best Shopify reporting app for profit and LTV in 2026?
For profit and Lifetime Value reporting in 2026, we rank Lifetimely by AMP and Polar Analytics at the top, with Lebesgue winning on predictive LTV. Lifetimely connects Meta, Google, and Klaviyo costs directly against Shopify revenue, so the P&L stays live, not weekly. Polar Analytics adds the Polar Pixel for first-party signal when iOS attribution windows shrink reported ROAS.
Historical cohort LTV: Lifetimely on 6, 12, and 24 month windows.
Predictive LTV: Lebesgue with competitor benchmarks baked in.
Cross-channel margin: Polar Analytics for paid media leads.
The honest caveat is that all three stop at the chart. If you want a system that reasons across margin, cohort, and cash flow in plain English, layer an AI reasoning engine over the same data warehouse. We unpack this in our guide to tracking e-commerce unit economics, which shows how contribution margin, CAC, and LTV connect into one decision view.
How do we choose a Shopify reporting app for multi-store and inventory reporting?
For multi-store and inventory reporting, we recommend Report Pundit and Mipler Advanced Reports first, with Putler as a lightweight alternative when you also sell on Stripe, PayPal, or WooCommerce. Native Shopify Analytics still cannot consolidate two stores cleanly without manual exports.
Report Pundit: consolidates 2 or more Shopify stores in one report, exports to Google Sheets on schedule, and reads custom metafields.
Mipler: covers tax, financial, and inventory reports with an AI Assistant for column creation.
Putler: light multi-source dashboards with built-in RFM segments.
Inventory distortion costs retailers an estimated 6% of revenue per brand every year, so visibility across stores is not optional. Multi-store operators should confirm scheduling cadence on the cheap tiers before signing, since most apps throttle daily delivery. We dig into this in our review of the best Shopify analytics apps for operators running 2 or more stores.
How do we score and compare Shopify reporting apps fairly?
We score every Shopify reporting app out of 100 across five weighted criteria, tuned for SMB and mid-market operators rather than enterprise BI teams.
User Reviews (15%): verified Shopify App Store and G2 reviews from the last 24 months.
Reporting Depth and Reasoning (30%): custom builder, cohort, profit, predictive vs historical, and root-cause capability.
Setup, Metafield Depth, and Scheduling (20%): time to first useful report, metafield support, and Slack or email cadence.
Pricing Transparency (20%): public pricing, free trial, no quote-to-cart games.
Compliance and Data Residency (15%): GDPR posture, EU hosting, audit logs.
Apps scoring 81 to 100 earn 5 stars, 61 to 80 earn 4, and so on. Most listicles ignore data residency entirely, which is a non-starter for EU and UK operators. We explain the buyer-side framework in detail in our note on why e-commerce founders are drowning in data.
Which Shopify reporting app is right for our revenue band and SKU count?
We match the reporting app to revenue, SKU count, and multi-store status, not feature count. Picking the wrong tier wastes 6 to 12 months of reporting hygiene.
Under 1M EUR, fewer than 500 SKUs: Report Toaster or Data Export IO.
1M EUR to 10M EUR, active paid media: Lifetimely or Polar Analytics.
10M EUR plus or multi-store: Report Pundit or Better Reports.
SKU-heavy catalogues (10,000 plus): Mipler.
Reasoning over the warehouse, any tier: an AI reasoning layer.
EU and UK operators with data-residency obligations should filter for GDPR-compliant hosting before integration count. Operators who would rather ask questions in plain English than build dashboards should layer an AI reasoning engine over the same warehouse, as we cover in our breakdown of agentic AI for e-commerce founders.
How does an AI reasoning layer differ from a Shopify reporting app?
A Shopify reporting app visualises history. An AI reasoning layer reasons across the data warehouse, then acts. Most apps stop at the chart; an AI layer ingests Shopify, Meta, Klaviyo, Xero, and bank data, normalises it on ingestion, and answers cross-functional questions in plain English.
Extract: pulls the relevant slice on demand without SQL.
Predict: projects forward LTV, CAC, and inventory burn.
Simulate: tests what-if scenarios across marketing, finance, and operations.
Root cause: explains why MER dropped on Tuesday, not just that it did.
Push: agentic scheduled reports land in Slack and email with reasoning attached.
Most analytics tools added AI features. We built Luca as AI from the ground up, so cohort-level vigilance happens without the cohort-level dashboard. We expand on this architecture in our explainer on what Luca AI is and why the AI Co-Founder model matters.
Enjoyed the read? Join our team for a quick 15-minute chat — no pitch, just a real conversation on how we’re rethinking Ecommerce with AI - Luca
Loading Schedule...
Your AI Co-Founder is here.
Here’s why:
Shopify, Meta, Xero - one brain.
"Should I scale?" Answered with real data.
Growth capital. No applications. One click.
Thank you! Your submission has been received! Please book a time slot for the Meeting
Oops! Something went wrong while submitting the form.