Predictive Analytics for E-commerce Operations: Fraud, Returns and Delivery
13
mins read
TL;DR
Fraud detection, returns prediction, and delivery prediction all forecast which orders will cost money after shipping, using the same order data.
Judge fraud settings on total cost: chargebacks, false declines, and review time. False declines can cost more than the fraud itself.
Returns are forecastable by SKU, size, bracketing, and customer history; put allocated return cost into contribution margin before scaling a product.
Predict delivery dates as processing plus transit time per lane, and use the median so one stuck parcel does not stretch every promise.
In an illustrative example, returns cost about $9,600 a month versus $660 in chargebacks, so rank every leak in dollars before fixing.
Keep order-level fraud screens; add a store-level analytics layer such as Luca AI to explain why risk moves across channels and SKUs.
It is 7:40 on a Monday. The ops lead at a Shopify apparel brand opens the admin and finds three things waiting. There are two chargeback notices from Stripe, a refund queue twice last week's size, and forty "where is my order" tickets. Each lives in a different tool. Each looks like a separate fire.
They are not separate. Ecommerce fraud detection, returns prediction, and delivery time prediction all answer one question: which of today's orders will cost you money after you ship them? All three are jobs for predictive analytics for e-commerce, and they run on the same order, customer, SKU, and carrier history. This guide shows how each forecast works, what it costs to ignore, and what to fix first.
How does ecommerce fraud detection actually work on a Shopify store?
Ecommerce fraud detection scores every order for risk before it ships. Rules or a machine learning model read signals such as billing and shipping mismatch, order velocity, device and IP data, and customer history. The order is then sorted into approve, review, or cancel. The goal is not zero fraud. It is the lowest total cost of chargebacks, false declines, and manual review time.
The three outcomes, and what each one costs
Every order lands in one of three buckets. Each bucket has a price, and most stores only measure one of them.
✅ Approve, review, or cancel
Approve: the order ships. If it was fraud, you eat a chargeback (a bank-forced refund the cardholder files).
Review: a person checks it. That costs staff time and delays a good customer's parcel.
Cancel: you refund before shipping. If the buyer was real, that is a false decline, and the customer rarely returns.
Stripe's merchant guide lists machine learning, multifactor authentication, and manual review as layers that work together, not alternatives [1]. Chargeback Gurus makes the same case more bluntly: one isolated detection method no longer covers the range of schemes merchants face [3].
Rules versus models
Rules are "if this, then that" checks. A rule might flag any order over $500 shipping to a new address. Rules are easy to read and easy to break, because fraudsters learn the thresholds.
⚠️ Where each approach fails
A model scores the combination of signals instead of one at a time. It learns from your past orders that were later charged back. Signifyd's guide notes that a fraud tool's accuracy depends almost entirely on the quality and quantity of data it can see [2]. A model trained on 300 orders guesses. A model trained on years of labelled orders predicts.
Luca AI does not screen individual orders, so this is not a pitch for a model. Luca AI's role sits one level up, reading whether chargeback rates are drifting across the whole store.
One order, walked through
Picture an order for $340 of jackets. Here is how a scoring engine reads it:
One order, walked through
Signal
What it shows
Risk effect
Billing ZIP matches card
Address verification (AVS) passed
Lowers risk
Shipping to a freight forwarder
Common in resale fraud
Raises risk
Account created 6 minutes ago
No history
Raises risk
Two failed card attempts first
Possible card testing
Raises risk sharply
No single row convicts the order. Together they push it into review.
💡 Why this is a forecast, not a filter
I think most operators frame fraud as a gate. It works better as a forecast. You are predicting the cost of this order 60 days from now, when the dispute window closes. That framing matters, because returns and delivery promises are forecasts of the same order too.
Luca AI treats chargebacks as one metric in a connected store view. When dispute rates rise, Luca AI checks whether refunds, late deliveries, or a new traffic source moved at the same time. It then pushes that pattern as an alert. The screening tool keeps deciding orders. Luca AI explains why the mix of risky orders changed.
Which fraud signals should a model watch before you ship?
The signals that carry the most weight are mismatches and speed. Watch for billing and shipping addresses that disagree, AVS and CVV failures, many card attempts in minutes, new accounts placing large first orders, freight-forwarder addresses, and high-resale SKUs. No single signal convicts an order. A model weighs combinations against your store's own history.
Payment signals
These come from the card network and your payment processor. They are the cheapest signals you have, because they are already in your Shopify order record.
💳 AVS, CVV, and 3D Secure
AVS (address verification service): checks the billing address against the bank's record.
CVV: the three-digit code on the card. A mismatch is a strong warning.
3D Secure: an extra bank check at checkout. It shifts some fraud liability to the card issuer.
Identity and address signals
Fraud rarely uses one clean identity. It shows up as small inconsistencies stacked together.
📦 What to flag
Billing and shipping in different countries or states
Freight-forwarder or reshipper addresses
Email domains created recently, or name and email that do not match
Phone numbers that fail basic format checks
Chargeflow's guide groups the main threats as friendly fraud, account takeover, card testing, and refund abuse [4]. Each leaves a different trace in these fields.
Velocity and card testing
Velocity means how fast things happen. Card testing is when bots run stolen cards through small orders to find which ones work. Bureau.id describes bots testing stolen card or credential combinations across many stores until one matches [5].
⏰ Speed signals
Many failed payment attempts from one device or IP in minutes
Several orders to one address with different cards
Sudden spikes in $1 to $5 orders
Luca AI can watch the store-level version of this. Ask Luca AI how many orders under $5 came in per hour this week versus last month. A card-testing wave shows up as a spike that no single order reveals.
Basket, SKU, and account signals
Some products attract fraud because they resell fast. Electronics, gift cards, and limited sneaker drops lead most lists.
⚠️ Account takeover and friendly fraud
Account takeover: a known customer's login used from a new device, with a changed shipping address.
Friendly fraud: a real customer receives the order, then disputes it. The order looks clean at checkout, so you predict it from history, not from the order.
Fraud models also run on sellers, not only buyers. Profit First for Ecommerce Sellers describes Amazon treating an unannounced bank account change as possible hijacking. It froze disbursements until the seller explained. The lesson carries over: notify the platform before you change payout details.
Read signals against your own baseline
A freight-forwarder address means something different for a store that sells abroad on purpose. Your baseline matters more than any generic checklist.
What does fraud really cost once you count false declines and frozen accounts?
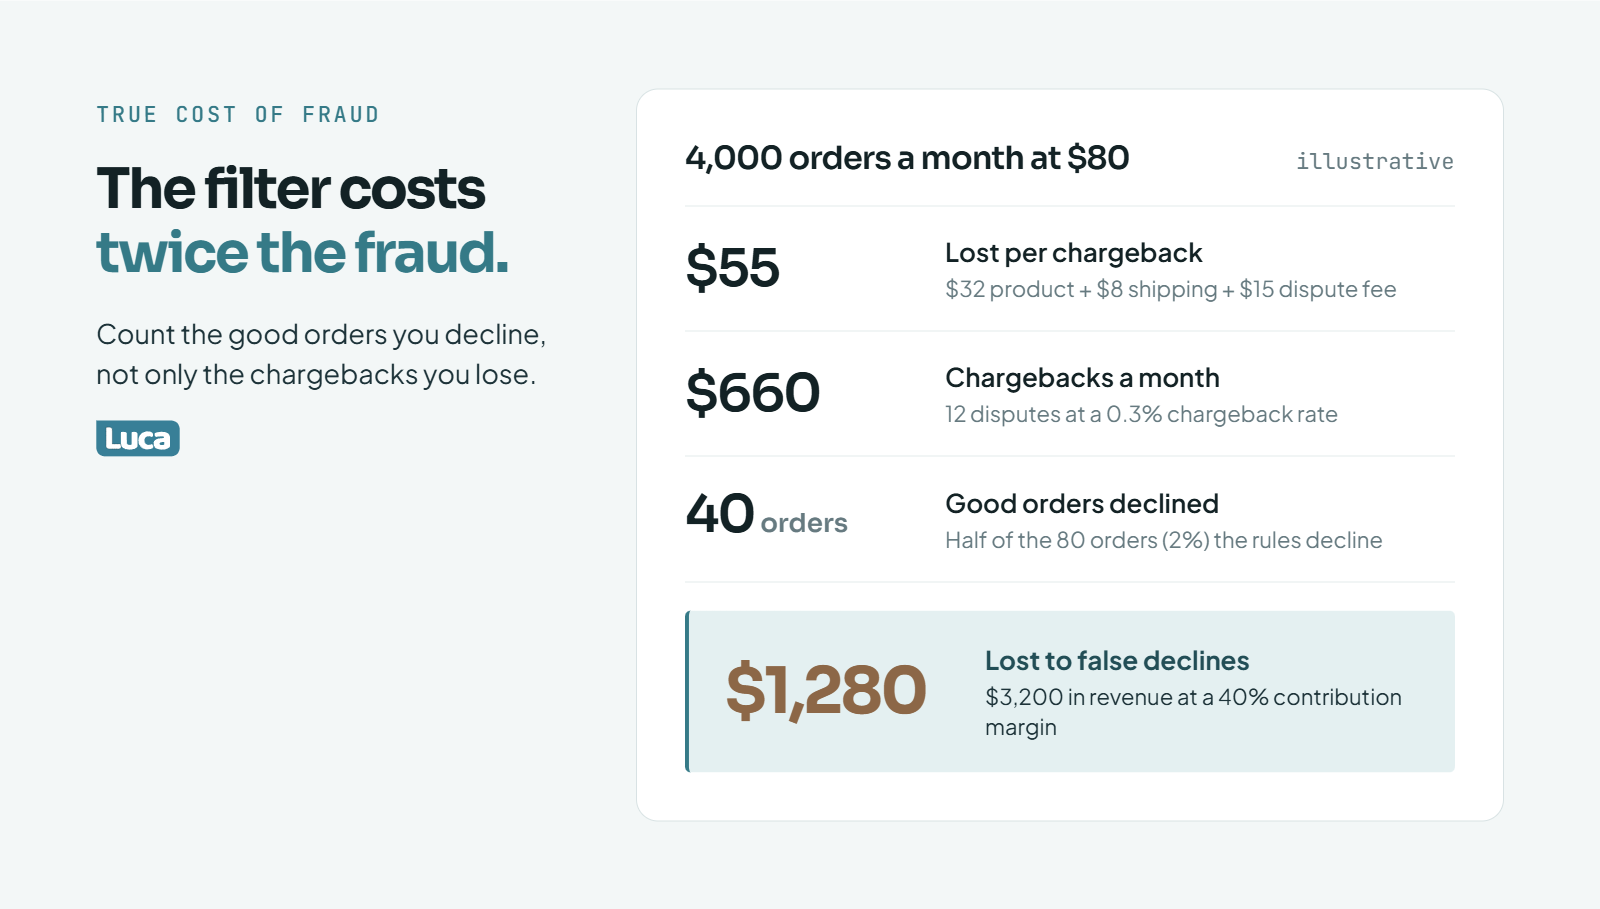
Count false declines too: here the fraud filter costs about twice what the fraud does.
A chargeback costs the product, the shipping, and a dispute fee, on top of the refunded sale. The quieter cost is the good order you declined and the customer who never comes back. For marketplace sellers, the biggest fraud cost is often an account suspension triggered by a false claim. Measure all three, or your fraud settings will optimize the wrong number.
The anatomy of a chargeback
When a dispute lands, the money leaves first and the argument comes later. You also lose the goods you shipped.
💸 What one chargeback takes
For an illustrative $80 order:
Sale refunded to the cardholder: $80 back out
Product cost already gone: $32
Outbound shipping already paid: $8
Dispute fee: $15
Net cash lost on that order: $32 + $8 + $15 = $55. And that is a dispute you never won.
False declines: the cost nobody reports
Here is a worked example, labelled as illustrative. A store does 4,000 orders a month at an $80 average order value. Its rules decline 2% of orders, which is 80 orders. Suppose half of those were real customers.
Now compare chargebacks. At a 0.3% chargeback rate, the same store sees 12 disputes. At $55 each, that is $660. In this example, the fraud filter costs about twice what the fraud does. Most fraud dashboards only show the $660.
Friendly fraud and refund abuse
Not all fraud starts with a stolen card. The Merchant Risk Council's 2025 report names refund and policy abuse as the top fraud threat merchants report [6]. That means real customers gaming refund rules, claiming "item not received", or returning used goods.
🔁 Why this ties fraud to returns
Refund abuse lives in your returns data, not your checkout data. A store that only scores checkout risk will miss it. That is why this guide treats returns as part of the same forecast.
When the platform itself is the risk
For Amazon sellers, fraud cost can mean losing the whole account. The authors of Profit First for Ecommerce Sellers put it bluntly:
"Everybody gets at least one product, if not their whole account, suspended by Amazon at some point... It's not a matter of if; it's a matter of when." Cyndi Thomason, Profit First for Ecommerce Sellers
They also describe sellers suspended over false counterfeit claims filed by competitors. Their tactic is practical. Keep a separate reserve account holding two to three months of operating expenses, so payroll survives a frozen account.
✅ What to measure each month
Chargeback count, rate, and dollars, split by reason code
Orders declined or cancelled for fraud, and an estimate of how many were real
Refund-abuse cases from your returns log
Days of operating cash held outside the selling platform
Luca AI can put these four numbers in one weekly report, sent to Slack or email. Because Luca AI joins payment, Shopify, and returns data, you see whether a tighter fraud rule cut chargebacks while quietly growing declines. That trade-off is invisible when each number sits in a different tool.
Which fraud tools fit a small or mid-size store, and where do they stop?
Start with Shopify's built-in fraud analysis and Shopify Protect if your orders qualify. Add a guaranteed screening tool such as Signifyd or NoFraud once chargebacks cost more than its fee. These tools judge one order at a time. None explains why chargebacks, refunds, and late deliveries are rising together, which is a store-level analytics question.
Native tools first
Shopify's fraud analysis flags orders as low, medium, or high risk inside the admin. It costs nothing extra and uses data Shopify sees across many stores. Shopify's own fraud guide treats it as a first layer, not the whole system [7].
⚠️ Read the eligibility terms
Shopify Protect covers only eligible orders, and eligibility depends on your payment setup, region, and shipping. Check the terms in your own admin before you count on it. Many stores assume they are covered when a large share of orders are not.
Guaranteed screening tools
Tools such as Signifyd and NoFraud score each order and offer a financial guarantee. If they approve an order that turns into a fraud chargeback, they cover it. Signifyd's guide stresses that its accuracy rests on data volume and quality [2].
💰 When the fee is worth it
Do the simple math. If your monthly fraud chargebacks plus review labor cost more than the tool's fee, switch. If not, stay native and review manually. Exclusions matter, so read what the guarantee leaves out, such as friendly fraud.
How the options compare
How the options compare
Option
Decides single orders
Financial guarantee
Sees returns and delivery data
Explains store-wide trends
Shopify fraud analysis
✅ Yes
❌ No
❌ No
❌ No
Shopify Protect
✅ Eligible orders
✅ Eligible orders
❌ No
❌ No
Signifyd or NoFraud
✅ Yes
✅ Approved orders, with exclusions
❌ No
❌ No
Luca AI
❌ No, not a screen
❌ No
✅ Yes, via connected sources
✅ Yes
The gap no order-level tool covers
Order-level tools answer "is this order safe?" They do not answer "why did refunds jump 40% after we launched that TikTok campaign?" Store owners feel this gap with native reporting too. One Shopify merchant described the manual work plainly:
"Shopify has built-in reports you can export, but on the lower-tier plans you only get the basics and you'll need to log in and pull them manually." Reddit user, r/shopify, Reddit Thread
Another founder built a tool after struggling with product-level performance "once returns and stock risk come into play" (Reddit Thread).
🧭 My take
Keep the screening tool. It does its job. But do not expect it to tell you where risk is coming from.
Returns prediction trains on your past orders, each labelled returned or kept. The strongest features are the SKU's own return history, size and variant, baskets holding the same item in several sizes, the customer's past return rate, discount depth, and sales channel. The output is a return probability for each order. Those probabilities roll up into expected return cost per SKU.
Why returns are more predictable than they feel
A return feels random when it arrives. Across thousands of orders, it is not. The same SKUs, sizes, and customer habits drive most of the volume.
📊 The scale of the problem
Appriss Retail and Deloitte put 2024 U.S. returns at 13.21% of retail sales, about $685 billion of merchandise [9]. The same report found that fraud and abuse made up 15.14% of those returns, roughly $103 billion [9]. Returns are both a cost line and a fraud surface.
Return rates also swing hugely by category. Kunle Campbell cites rates up to 25% in fast fashion. Heartland America, by contrast, runs about 2.6% by testing every vendor product in house and reading reviews before it buys inventory. Your own category baseline matters more than any industry average.
The features that predict a return
You do not need exotic data. Most of it already sits in Shopify.
✅ Order-level features
SKU return history: the single strongest predictor in most stores
Size and variant: some sizes run small, and the data shows it
Bracketing: buying one item in two or three sizes, planning to send most back
Customer return rate: past behavior predicts future behavior
Discount depth: heavy-discount orders often return at higher rates
Channel: orders from some ad campaigns or marketplaces return more
Bracketing and wardrobing (wearing an item once, then returning it) are where returns and fraud overlap. They look like normal orders at checkout.
Simple model or machine learning?
Start simple. A table of return rate by SKU and size, updated weekly, catches most of the signal. Logistic regression or gradient-boosted trees come next, once you have enough labelled orders.
🔬 What research shows
Return prediction is an established research problem. A 2018 IJCAI paper built a graph-based method for datasets with millions of customers. A 2025 study, Returnformer, reported its graph transformer beating four traditional machine learning models on a real e-commerce dataset [10]. Google and Myntra researchers estimated a shopper's return probability before purchase, using preferences, body shapes, and product views [11].
Those teams had data science staff. A $3M Shopify brand does not need their model. It needs the SKU-and-size table and the discipline to read it.
How accurate to expect
I would rather be honest here. You will not predict which single order comes back. You will predict, with useful accuracy, what share of a SKU's orders come back next month.
💡 Roll it up to dollars
That is the number that matters for cash. Multiply each SKU's expected return rate by its cost per return. You get expected return cost per SKU, which belongs inside contribution margin.
Luca AI does this roll-up from connected Shopify and returns data. Ask Luca AI which ten SKUs carry the highest expected return cost next month, and why. Luca AI answers with the SKU, the rate, and the driver it found, such as one size or one campaign.
How do return predictions actually cut return costs?
A return-risk score pays off only when it changes something upstream. High-risk SKUs get better size guidance, usage videos, or new packaging. High-risk baskets get an exchange-first or store-credit flow. One operator cut a knife set's return rate from 18% to 9% with usage videos and new packaging. That moved a loss-making hero product back to positive margin.
Most founders treat returns as overhead. Supply Chain Lara, who walks through the numbers in a widely shared case, argues the opposite:
"This is the cost founders underestimate most because they think about returns as exceptions. But when your return rate is 18% it's not an exception. It's a cost of doing business. And it needs to be in your unit economics." Supply Chain Lara, "Profitable on Paper, Broke in Reality"
💸 The allocated return cost math
Her method is simple. Take the return rate and multiply it by the full cost of one return. Spread that across every unit sold. At an 18% return rate and about $34 per return in lost product, shipping, and processing, the allocated cost came to about $6.20 per unit sold.
Maya's knife set
Maya, the founder in that case, believed her ceramic knife set was a winner at a 72% gross margin. Once returns and fragile packaging were allocated per unit, she was losing $21.31 on every set she sold.
✅ The turn
She added product usage videos to the product page, so buyers knew what to expect.
She redesigned the packaging to stop shipping damage.
She resized the shipping box, saving $0.80 per order.
The return rate fell from 18% to 9%. Contribution margin on the SKU moved to about +23%. Lara's sharpest line is that the data "was sitting right there in her systems the whole time." Maya just could not see it.
Policy levers that change behavior
Prediction tells you where to act. Policy is one of the levers. Kunle Campbell cites a Loop Returns client that began charging a return shipping fee. Within two months, exchange requests grew by just over 25% and refund requests fell by almost one-third.
⚠️ Free returns are not mandatory
Free returns can lift conversion in fashion. They can also fund bracketing. Test a fee on high-risk SKUs first, not across the store. Then watch whether conversion drops more than refunds do.
Exchange-first flows
Order the return portal so exchanges and store credit appear before a cash refund. Campbell describes this as a way to keep revenue that would otherwise leave. Pair it with your return-risk score: high-risk baskets see the exchange offer first.
❌ What not to do
Do not block returns from high-risk customers outright. That is a support and chargeback problem waiting to happen.
Do not judge a SKU's success on gross margin alone.
Do not change five things at once. You will not know which one worked.
Luca AI turns this into a standing watch. Set Luca AI to alert you when any SKU's return rate climbs above its 90-day norm. Each alert includes the allocated return cost and its effect on contribution margin. You decide the fix, whether that means a video, packaging, or policy change.
How does delivery time prediction work, and why should you use the median?
Promise delivery dates from the median so one stuck parcel does not stretch every estimate.
Delivery time prediction splits the promise into two forecasts. Processing time is how long you take to ship. Transit time is how long the carrier takes, by carrier, service, and destination zone. Use the median, not the mean, so one stuck parcel does not stretch every promise. Show a date range at checkout, then update it from carrier scans after dispatch.
Why a static estimate fails
Most stores show "ships in 3 to 5 days" on every product page. That number was set once and never checked. ShippyPro describes the usual approach as the carrier's stated transit time added to the dispatch date, which ignores real hub delays [12].
📦 What it costs to get wrong
Parcel Perform, a delivery-tracking vendor, says 41% of e-commerce sites show no estimated delivery date at checkout [13]. Treat that as a vendor figure. The operator cost is easier to see in your own data: wrong promises create "where is my order" (WISMO) tickets, cancellations, and "item not received" disputes.
Two forecasts, added together
Rithum splits the problem into a processing-time model and a transit-time model [14]. Kunle Campbell goes one step further and breaks total fulfillment time into source time, production time, and delivery time. Each node is a place where delay hides.
✅ Processing time
Measure the hours from order placed to label scanned, by warehouse and day of week. Monday orders after a weekend sale behave differently from Wednesday orders.
✅ Transit time
Measure days from first carrier scan to delivery scan, by carrier, service level, and destination zone.
Why the median beats the mean
Here is an illustrative set of ten transit times, in days: 2, 2, 3, 3, 3, 3, 4, 4, 5, and 21. One parcel sat in a depot for three weeks.
🔢 The math
Mean: 50 days ÷ 10 parcels = 5.0 days
Median: the middle of the sorted list = 3 days
The mean tells every customer to wait five days because of one stuck box. Kunle Campbell makes the same point: base lead time and transit "averages" on the median, so large outliers do not "wreak havoc on your customer satisfaction."
For the range, add a cautious upper bound. With one day of processing, this lane could show "arrives in 4 to 6 days." That comes from 1 day plus a median of 3, up to 1 day plus 5.
Update after dispatch
ShippyPro notes that predictive dates update as scan events and hub delays come in, and that carrier scan quality is the biggest accuracy factor [12]. A parcel that misses a hub scan should trigger a proactive email before the customer asks.
🔁 The link back to fraud
An "item not received" chargeback often starts as a late parcel with no update. Better delivery promises shrink a slice of your dispute log. That is the thread connecting this section to Q3.
Luca AI reads carrier, 3PL, and support data together. Ask Luca AI which carrier lanes had the most WISMO tickets per thousand orders last month. Luca AI can then alert you when a lane's median transit time moves past its usual range.
How do you forecast supply chain risk before it reaches your cash?
Supply chain forecasting for ecommerce means tracking how much lead times vary, not just their average, and tying that to cash. When a supplier slips or an inbound shipment stalls, the forecast should show which SKUs stock out, which delivery promises break, and how much cash is stuck. Luca AI connects inventory, 3PL, and accounting data so a lead-time shift appears as a stockout date and a cash figure.
Two train tracks
An operator quoted by TaxCloud and Settle described ecommerce as two parallel tracks:
"One side is your inventory, the other side is your cash. And those two need to be working on the same tracks in parallel with each other. Otherwise, you're going to go off the tracks." TaxCloud and Settle, "Smarter Inventory, Better Forecasts"
🚂 What breaks the tracks
Supply shocks hit inventory first and cash second. A late container means stockouts, refunds on preorders, and cash locked in goods you cannot sell yet.
When lead times explode
Deb Farnworth-Wood, CEO of Issada, watched supplier lead times jump from 16 weeks to 156 weeks during a global supply shock. The brand lost some wholesale customers because of it.
❌ The AI tool that did not help
Her inventory system added its own AI forecasting feature. The team tried it for about six months and shut it down. In her words, it was "hallucinating and telling fibs." I take that seriously. A forecast you cannot trace is worse than none, because you act on it.
When the shipment is stuck, or gone
Ryan Daniel Moran tells the story of Jared, whose Christmas inventory sat in FedEx customs for two weeks. He had 5,000 orders booked and had paid for expedited air freight. He called the customs manager and said he would go bankrupt without a release. The pallets arrived on his Wisconsin driveway in a snowstorm. Jared and 15 friends spent six hours packing 5,000 units by hand.
⚠️ Lost with no recourse
Amazon seller Leon Surrman described a large inbound shipment that simply vanished. Amazon told him the goods were gone and the money with them. He added that seller support "is very bad right now." Inbound loss is a supply risk your forecast should price in.
What to monitor weekly
You cannot prevent customs holds. You can see them earlier and size the damage.
✅ The weekly watch list
Median and worst-case lead time per supplier, versus last quarter
Inbound shipments past their expected arrival date
Preorders and promises at risk if a shipment slips two weeks
Luca AI builds this watch list from connected Shopify, inventory, 3PL, and accounting sources. Luca AI flags when a supplier's lead time drifts and shows the stockout date and cash impact. You decide whether to air-freight, pause ads, or move the promise date.
What does an operations risk forecast look like for one store, in numbers?
Rank leaks in dollars and fix the biggest first: returns, not the chargebacks that caused the panic.
For an illustrative Shopify store doing 4,000 orders a month, putting chargebacks, false declines, expected returns, and late-delivery costs side by side in dollars changes priorities. In this example, returns cost about five times more than chargebacks and false declines combined. The value of one sheet is ranking: you fix the leak that costs the most first, not the one that is loudest in Slack.
The example store
Everything below is an illustrative example, not client data. The numbers are round so you can check the arithmetic and swap in your own.
🏪 Store profile
4,000 orders a month on Shopify
$80 average order value
40% contribution margin, meaning $32 left per order after product, shipping, and fees
0.3% chargeback rate and 2% of orders declined for fraud
12% return rate
6% of parcels arrive after the promised date
Each leak, calculated
💸 Chargebacks
12 disputes (0.3% of 4,000) × $55 lost per dispute = $660. The $55 is product, shipping, and fee, as worked through in Q3.
💸 False declines
80 declined orders. If half were real customers, 40 × $32 lost contribution = $1,280.
💸 Returns
480 returns (12% of 4,000). Assume each return costs $20: $8 return shipping, $4 handling, and $8 average write-down for goods that cannot be resold. 480 × $20 = $9,600.
💸 Late deliveries
240 late parcels (6% of 4,000). If a quarter open a "where is my order" ticket at $5 of support time, that is 60 × $5 = $300. If 5% of late orders are cancelled, that is 12 × $32 = $384 lost. Total: $684.
Ranked
Ranked
Leak
Monthly cost
Share of total
Returns
$9,600
79%
False declines
$1,280
10%
Late deliveries
$684
6%
Chargebacks
$660
5%
Total
$12,224
100% (rounded)
🧭 What the ranking says
The fraud leak that triggered the Monday panic is the smallest line. Cutting the return rate from 12% to 10.8%, a 10% relative drop, removes 48 returns. That saves 48 × $20 = $960 a month, more than all chargebacks combined.
This does not mean fraud is unimportant. A card-testing attack can multiply that $660 in a weekend. It means steady-state money sits in returns for most apparel and home goods stores. Your ranking may differ, and that is exactly why you run it.
Monday actions for this store
Pull return rate by SKU and size for the last 90 days.
Pick the three SKUs with the highest allocated return cost and fix one thing on each.
Loosen the fraud rule that drives the most declines, and watch chargebacks for 60 days.
Replace the static shipping promise with a median-based range per carrier lane.
Luca AI produces this ranking from connected sources rather than a spreadsheet. Ask Luca AI to show monthly cost of chargebacks, declines, returns, and late deliveries side by side. Luca AI pulls each figure from Shopify, payments, returns, carrier, and support data and states the assumptions it used, so you can challenge them.
What data do you need before predictions are worth trusting?
You need labelled outcomes: chargebacks tagged by reason, returns with reason codes, and promised versus actual delivery dates. My working rule is a few hundred outcomes of each type before trusting a simple model. Below that, use thresholds and manual review. Clean, joined data across Shopify, payments, carriers, and support matters more than the choice of algorithm.
Labels come first
A prediction learns from outcomes. If the outcome is not recorded, there is nothing to learn from.
✅ The three label sets
Fraud: every chargeback with its reason code, linked to the original order ID
Returns: every return with a reason code, SKU, size, and condition on arrival
Delivery: promised date at checkout and actual delivery scan, per order
Most stores have the first, half have the second, and few store the promised date at all. Start recording it today, because history cannot be backfilled.
Volume floors
There is no magic number, and I would distrust anyone who gives you one. What I have seen is that rules work from day one, while models need enough positive cases to learn from.
Hundreds of returns a month: a SKU-and-size return table is reliable and useful.
Thousands of shipments per lane: median transit times are stable enough to promise from.
Signifyd makes the same point from the vendor side: a fraud tool's accuracy depends almost entirely on the quality and quantity of its data [2].
Joining the sources is the hard part
The order lives in Shopify. The dispute lives in Stripe or Shopify Payments. The return lives in a returns app. The delivery scan lives with the carrier or 3PL. The complaint lives in the help desk.
🔗 Why joins fail
Each system uses its own IDs and timestamps. Teams stitch them by hand in spreadsheets, and the stitching breaks every time an app changes an export. Most predictive projects I have watched stall here, not at the model.
Luca AI handles this join on ingestion. Luca AI connects Shopify, payment, ad, email, accounting, 3PL, and support sources and normalizes them, so an order, its return, and its ticket line up without a weekly cleanup.
When to wait
Deb Farnworth-Wood's experience with a native AI forecasting feature is the warning. Her team ran it for about six months, could not rely on it, and shut it down. A model fed thin or messy data produces confident, wrong answers.
🧭 My position
If you cannot list your last 50 chargebacks with reasons, fix the record-keeping first. Prediction comes second.
Where does Luca fit, and where does a point tool still win?
Luca AI is not a fraud screen. Order-level tools such as Signifyd or NoFraud should keep approving or declining orders. Luca AI connects Shopify, ad, email, accounting, 3PL, and support data, normalizes it on ingestion, and answers plain-English questions such as "why did refunds rise last month?" It also alerts you before a returns or delivery problem turns into a cash problem.
What point tools do well
A fraud screen decides one order in seconds and backs the decision with a guarantee. A returns app runs the portal and the label. A tracking app sends shipping updates. Each is good at its single job.
✅ Keep them
I would not rip any of these out. Replacing a working fraud screen with an analytics layer would be a mistake, and Luca AI is not built to approve orders.
The gap between them
Each tool sees its own slice. None of them sees that refunds, chargebacks, and WISMO tickets all rose after one campaign, or after one carrier change. Even well-liked analytics tools carry this friction. One G2 reviewer of a popular ecommerce analytics product put it this way:
"Some data we still notice discrepancies between platforms, for example, tracking ads, and differences in the reported metrics like revenue." G2 reviewer, Triple Whale - G2 Verified Review, 4 stars
Another gave it 3 stars, noting it "does not update the numbers correctly and has errors with synchronisation" (Triple Whale - G2 Verified Review). The same reviewer still valued seeing daily profit. Attribution tools do their marketing job. They are not built to reason across returns, carriers, and disputes.
❌ What the gap costs
The founder becomes the integration layer, matching exports at night. That is how a $9,600 returns leak hides behind a $660 fraud alarm, as in Q9.
Where Luca AI fits, and where it does not
Where Luca AI fits, and where it does not
Need
Best fit
Approve or decline a single order
Fraud screen (Signifyd, NoFraud, Shopify)
Run the returns portal
Returns app
Explain why chargebacks, returns, and late deliveries moved together
Luca AI
Alert when a SKU, lane, or channel drifts from pattern
Luca AI fits SMB and mid-market stores with enough order history to reason against. It is not the right fit for enterprises with a full data team, or for stores too early to have meaningful data.
💬 A next step for Monday
Pick one question you cannot answer today, such as "which SKUs cost me the most in returns and disputes last quarter?" Try answering it with your current tools and time how long it takes.
What is the difference between ecommerce fraud detection and fraud prevention?
Fraud detection finds risky orders. Fraud prevention stops them from becoming losses. In practice, a store needs both, and they run in sequence.
Detection scores each order before it ships, using signals such as address mismatches, failed card attempts, order velocity, and account age.
Prevention is what you do with that score: approve, send to manual review, add a verification step such as 3D Secure, or cancel.
Response covers what happens after a dispute lands, such as fighting chargebacks with tracking proof.
We think the useful frame is cost, not catch rate. A setting that blocks more fraud but declines many real customers can lose more contribution than the fraud it stops. In the illustrative example we use, a 2% decline rate on 4,000 monthly orders cost about $1,280 in lost contribution, while chargebacks cost about $660.
Detection also extends beyond checkout. Refund abuse and item-not-received claims show up in returns and delivery data, not payment data. That is why we treat fraud as one part of predictive analytics for e-commerce, alongside returns and delivery forecasts, all built on the same order history.
Can predictive analytics reduce friendly fraud and refund abuse?
Yes, but not at checkout. Friendly fraud happens when a real customer receives an order and then disputes it. The order looks clean when it is placed, so payment signals rarely catch it. Prediction works from history instead.
Customers with past disputes or a high return rate
Item-not-received claims on parcels the carrier marked delivered
SKUs and campaigns where refund requests run far above the store norm
Late deliveries with no proactive update, which often turn into disputes
The Merchant Risk Council's 2025 report named refund and policy abuse as the top fraud threat merchants report, so this is not an edge case. We recommend three moves. Keep dispute reason codes linked to order IDs. Send proactive delivery updates when a parcel stalls. Put exchange or store-credit options ahead of cash refunds for high-risk baskets.
Luca AI helps here by joining Shopify, payment, returns, carrier, and support data, so you can ask which customers, SKUs, or carrier lanes drive most refund and dispute volume. Our guide to ecommerce customer analytics covers how to segment repeat-dispute customers without punishing loyal buyers.
How many orders do I need before a fraud or returns prediction model is useful?
There is no single magic number, and we would distrust anyone who gives you one. What matters is how many labelled outcomes you have, not total orders.
Fraud: if you see fewer than about 100 chargebacks a year, a model will chase noise. Use Shopify's built-in fraud analysis, simple rules, and manual review.
Returns: a few hundred returns a month makes a return-rate table by SKU and size reliable and useful.
Delivery: thousands of shipments per carrier lane make median transit times stable enough to promise from.
Labels come before models. Record chargeback reason codes against order IDs, return reason codes with SKU and size, and the delivery date you promised at checkout. Many stores never store the promised date, and history cannot be backfilled.
The harder part is joining data across Shopify, your payment processor, returns app, carrier, and help desk. Each system uses its own IDs. Luca AI normalizes these sources on ingestion so an order, its return, and its support ticket line up. If you are still stitching exports by hand, start with our guide to ecommerce data integration.
Should a small ecommerce store charge for returns to cut return costs?
Sometimes, and it is worth testing rather than assuming free returns are mandatory. Free returns can lift conversion, especially in fashion. They can also fund bracketing, where shoppers buy several sizes planning to send most back.
Kunle Campbell cites a Loop Returns client that began charging a return shipping fee. Within two months, exchange requests grew by just over 25% and refund requests fell by almost one-third. That is one client, not a law, but it shows that policy changes behavior.
We suggest a narrow test first:
Pick the SKUs with the highest allocated return cost, not the whole catalog.
Offer free exchanges or store credit, and charge only for cash refunds.
Track conversion rate, refund rate, and exchange rate on those SKUs for 60 days.
Keep the fee only if refund savings beat any conversion loss.
Fix product causes before policy. In one case, usage videos and new packaging cut a knife set's return rate from 18% to 9%. Luca AI can alert you when a SKU's return rate rises above its 90-day norm and show the impact on contribution margin, so you know which SKUs deserve a policy test.
How does Luca AI help with fraud, returns, and delivery risk?
Luca AI is not a fraud screen, and it does not approve or decline orders. Tools such as Shopify's fraud analysis, Signifyd, or NoFraud should keep that job. Luca AI works one level up, across the whole store.
Connects sources: Luca AI links Shopify, payment, ad, email, accounting, 3PL, and support data and normalizes it on ingestion.
Answers questions in plain English: for example, which SKUs cost the most in returns and disputes last quarter, or which carrier lanes create the most WISMO tickets.
Sends proactive alerts: when chargebacks, refund rates, or delivery delays drift from their usual pattern.
Schedules reports: a weekly operations summary to Slack or email, with the reasoning behind each change.
The value is ranking. In our illustrative worked example, returns cost about $9,600 a month while chargebacks cost about $660. A store watching only its fraud tool would fix the smaller leak first.
We built Luca AI for SMB and mid-market stores with enough order history to reason against. It is not the right fit for enterprises with a full data team. See the Luca AI use cases to judge whether your store fits.
Enjoyed the read? Join our team for a quick 15-minute chat — no pitch, just a real conversation on how we’re rethinking Ecommerce with AI - Luca
Loading Schedule...
Your AI Co-Founder is here.
Here’s why:
Shopify, Meta, Xero - one brain.
"Should I scale?" Answered with real data.
Growth capital. No applications. One click.
Thank you! Your submission has been received! Please book a time slot for the Meeting
Oops! Something went wrong while submitting the form.