RFM Analysis and Customer Segmentation for E-commerce
13
mins read
TL;DR
RFM analysis scores customers on recency, frequency, and monetary value, then groups them so each group gets its own message instead of one blast.
Set your recency window from your own median days between orders, not a generic 90 days, and use fixed bands for lumpy order counts.
Shopify scores 1 to 5 into 11 groups; Klaviyo scores 1 to 3 into 6 groups and needs 500+ ordering customers. Pick one system per decision.
Win back At risk and Previously loyal first, time second-order nudges to your repurchase clock, suppress Dormant, and stop discounting Champions.
Cohort analysis shows whether newer customers are weaker than older ones; RFM cannot, because recent customers score well on recency by default.
RFM ignores what customers buy. Category diversity can drive lifetime value more than frequency, and RFM inputs feed churn and CLV models.
RFM analysis scores every customer on three numbers: how recently they bought (recency), how often they buy (frequency), and how much they have spent (monetary value). Similar scores are then grouped into segments such as Champions, At risk, and Dormant, so each group gets its own message. Shopify and Klaviyo now both calculate RFM natively, but they score it differently [2][3].
Picture an operator who sells specialty coffee and brewing gear on Shopify. The store does about $90,000 a month, has 6,000 customers, and sends one Klaviyo campaign to the whole list every Thursday. Unsubscribes creep up each month. Her best customers get the same 15% code as people who bought one bag two years ago.
This guide is written for her. It covers how to score customers, what each segment means, what to send each one, and where RFM stops being enough. It sits inside our wider guide to predictive analytics for e-commerce, which covers the forecasting methods that build on it.
What is RFM analysis, and why does it still work for e-commerce?
RFM analysis scores each customer on recency (days since last order), frequency (number of orders), and monetary value (total spend), then groups similar scores into segments. It works because it uses only order data every store already has. It tracks what customers do rather than what they say. It tells you who to reward, who to win back, and who to stop emailing.
📬 The Thursday blast problem
Most small stores start with one list and one message. It feels efficient, because one campaign takes one afternoon. The cost shows up later, in unsubscribes, spam complaints, and discount codes handed to people who would have paid full price.
Kunle Campbell, in E-commerce Growth Strategy, describes Electronic Arts as an extreme version of this [1]. He writes that the company once spent about 22% of revenue sending every gamer the same marketing. A coffee store is not EA, but the logic scales down. Every identical send spends attention you cannot get back.
🔍 Three questions, three columns
RFM replaces the single list with three simple questions about each customer:
Recency: How many days since their last order? Fewer days usually means a warmer customer.
Frequency: How many orders have they placed? More orders signal a habit.
Monetary value: How much have they spent in total? This shows what they are worth to you so far.
Each answer becomes a score, usually 1 to 5. A customer scored 5-5-5 bought recently, buys often, and spends the most. A 1-1-1 customer bought once, long ago, and spent little.
🧠 Why behavior beats surveys
Campbell's book sums up the principle as paying attention to what people do, not what they say [1]. You need two facts per order: when it happened and how much it was worth. No quiz, no demographic data, and no extra tracking pixel.
An RFM score is only useful if it changes a send. Here is what Luca AI's read is, after watching operators run this: a segment that does not change who gets which message is decoration. The three decisions RFM makes easy are:
Who gets early access and no discount (your best, most recent buyers).
Who gets a win-back flow before they go cold.
Who you stop emailing, so your deliverability stays healthy.
Luca AI connects Shopify and Klaviyo and normalizes the order data on ingestion. That means the three RFM inputs are already clean when you ask, in plain English, which customers moved between segments this month. You still decide what to send. The difference is that the question takes a minute instead of an export.
How do you score recency, frequency and monetary value?
Customer F spends heavily and buys often but has gone quiet, which a 345 score makes easy to spot.
Export every order, then compute days since last order, order count, and total spend per customer. Rank each measure and split it into five equal groups (quintiles), giving 5 to the best 20% and 1 to the worst. Recency is reversed: fewer days scores higher. Combine the digits into a score like 5-4-3. Stores under about 500 customers should use fixed thresholds instead.
🧾 The data you need
You need one row per customer with three numbers. Shopify's customer export already holds the last order date, order count, and amount spent. Before you score anything, clean three things:
Refunds: subtract fully refunded orders, or a returner looks like a Champion.
Zero-value orders: Klaviyo excludes orders with no positive value, such as 100% discount orders [3]. Do the same.
Test and staff orders: remove them, because they inflate frequency.
📊 Two ways to set the cutoffs
Quintiles split customers into five equal-sized groups per measure. Shopify uses this logic: a 5 means the customer is in the top 20% of that dimension for your store [2]. It adapts to your data automatically.
Fixed thresholds use cutoffs you choose, such as "3 or more orders scores high." Campbell offers useful starting points [1]:
Under about 4 months since the last order is recent for many industries.
Past about 12 months, you may treat the customer as churned.
About 3 purchases a year marks a frequent buyer for most brands.
⚠️ Frequency is lumpy
In most stores, a large pile of customers has exactly one order. Quintiles cannot split a pile of identical values, so frequency scores come out uneven. Klaviyo notes that customers with the same value get the same score, so groups are not equal [3]. I use fixed bands for frequency and quintiles for recency and spend.
⏱️ Set recency from your own repurchase clock
A mattress store and a coffee store cannot share a recency window. Campbell makes the same contrast between mattresses and chocolate [1]. Your own median days between first and second order is the right anchor.
Use the median, not the mean. Campbell's point is that the mean gets dragged by extreme values [1]. Here is an example for the coffee store, using seven customers' gaps between first and second order:
Set recency from your own repurchase clock
Gaps (days)
Median
Mean
21, 24, 28, 30, 33, 41, 160
30
48.1
One slow returner pulls the mean up by 18 days. Set "recent" from the median and the window stays honest. Luca AI can return this median from Shopify orders when you ask for it in plain English.
🧮 A worked example with 10 customers
This is an illustrative example. Recency and spend use quintiles (two customers per score). Frequency uses fixed bands: 1 order scores 1, 2 orders score 2, 3 orders score 3, 4 to 5 orders score 4, and 6 or more score 5.
A worked example with 10 customers
Customer
Days since last order
Orders
Spend
R
F
M
Score
A
12
6
$540
5
5
5
555
B
25
3
$210
5
3
3
533
C
40
1
$65
4
1
1
411
D
70
4
$380
4
4
4
444
E
95
2
$150
3
2
3
323
F
130
5
$460
3
4
5
345
G
180
1
$45
2
1
1
211
H
220
2
$120
2
2
2
222
I
300
3
$260
1
3
4
134
J
410
1
$80
1
1
2
112
Customer F is the one to watch. F spends heavily and buys often, but has gone quiet for 130 days. Luca AI flags customers like F when their usual gap stretches, so you see the slide before the score drops.
Shopify scores 1 to 5 and Klaviyo scores 1 to 3: which RFM system should you use?
Use Shopify to see your base and Klaviyo to trigger flows, since they can score one customer differently.
Shopify's RFM report scores each customer 1 to 5 per dimension, relative to your own store, and maps them into 11 groups [2]. Klaviyo scores 1 to 3, uses 180 and 365 day recency defaults, and maps 27 combinations into 6 groups [3]. Klaviyo needs at least 500 ordering customers and 180 days of history [3]. Use Shopify to see your base, and Klaviyo where a segment must trigger a flow.
🔀 Two tools, two labels for one customer
Most operators run both tools. Each one now has its own RFM model. The models disagree, and nobody tells you which to trust.
Luke Bean of Valente described a version of this pain in an interview with Luca AI [5]. His team migrated from Klaviyo to Bloomreach to get a single point of truth on the customer. He called the move expensive and difficult. A small store cannot afford that fix, so it needs a rule instead.
Take a coffee customer whose last order was 200 days ago. Klaviyo's default puts that customer in recency 2, because it falls between 180 and 365 days [3]. Shopify might score the same customer 1 if most of your buyers ordered more recently [2]. Same person, two labels.
Neither tool is wrong. They answer different questions. Shopify's relative scale shows where a customer sits against your other customers. Klaviyo's fixed windows show whether a customer is inside a time limit you chose.
Sends and flows: Klaviyo, because its RFM properties update daily inside the tool that sends [3].
Below 500 customers: a spreadsheet, because Klaviyo's model will not run yet.
Operators who stitch tools together know this mismatch well. One G2 reviewer of Triple Whale described a related clash:
"Triple Whale will attribute more revenue to the email that was sent out, but the platform will attribute more revenue to the SMS that was sent out." G2 reviewer, 4 stars, April 2023 Triple Whale - G2 Verified Review "Some stats are not so accurate in pulling in data; they do not tally with shopify." G2 reviewer, 4 stars, April 2023 Triple Whale - G2 Verified Review
Luca AI reads Shopify and Klaviyo data in one place. You can ask why a customer is Loyal in one tool and slipping in the other, without exporting either. The answer shows the raw dates and totals behind both labels, so you choose the rule, not the tool.
What are the 11 RFM segments, and what does each one tell you?
Shopify's 11 RFM groups are Champions, Loyal, Active, New, Promising, Needs attention, Almost lost, At risk, Previously loyal, Dormant, and Prospects [2]. Each group is defined by recency (R) and an averaged frequency-monetary score (FM). Champions have R of 5 and FM above 3. Previously loyal have R of 2 or lower with FM above 4. At risk and Previously loyal usually hold the most recoverable money.
🗺️ The full map
Shopify calculates FM as frequency plus monetary, divided by two, rounded down [2]. The group then depends on R and FM:
The full map
Group
Rule (R, FM)
What it tells you
Champions
R = 5, FM above 3
Recent, frequent, high spend. Your core.
Loyal
R of 3 or 4, FM above 3
Strong history, still fairly recent.
Active
R of 4 or 5, FM above 1 and up to 3
Recent and moderate. Room to grow.
New
R = 5, FM of 1 or less
Just bought, once or twice, low spend.
Promising
R = 4, FM of 1 or less
Recent but light. Second order not yet made.
Needs attention
R = 3, FM = 3
Average on everything and starting to cool.
Almost lost
R = 3, FM of 2 or less
Cooling and never very valuable.
At risk
R of 2 or less, FM above 2 and up to 4
Was decent, now gone quiet.
Previously loyal
R of 2 or less, FM above 4
Was one of your best. Now absent.
Dormant
R of 2 or less, FM of 2 or less
Old, light, and unlikely to return.
Prospects
No orders yet
Subscribed or registered, never bought.
Source: Shopify Help Center group definitions [2].
🧮 Our 10 customers, placed
Using the worked example from Q2, here is where each customer lands:
Champions: A (R 5, FM 5).
Loyal: D (R 4, FM 4) and F (R 3, FM 4).
Active: B (R 5, FM 3).
Promising: C (R 4, FM 1).
Almost lost: E (R 3, FM 2).
At risk: I (R 1, FM 3).
Dormant: G, H, and J.
Customer F sits in Loyal today with a recency of 3. One more quiet month could push F toward At risk, which is the move worth catching.
💸 Where the money sits
Campbell's guidance maps neatly onto these groups [1]. High-value customers deserve perks and invitations to advocate. Lapsed but frequent customers are ripe for win-back flows. Lapsed customers who were never frequent should generally be left alone.
In Shopify's map, that makes Previously loyal and At risk the priority. They already proved they will buy. Dormant is the group to suppress, not chase.
👀 Watch movement, not the snapshot
A single month's group sizes tell you little. The signal is flow between groups. If Champions shrink while Previously loyal grows, your best buyers are leaving, even if revenue looks fine.
"It also allows you to segment and export customer data based on purchase frequency, product, and lifetime value." G2 reviewer, 3.5 stars, September 2019 Glew - G2 Verified Review
Luca AI watches these group sizes over months and sends an alert when one moves outside its usual pattern. A slide from Champions into Previously loyal shows up in Slack or email before it shows up in revenue. You decide what to send; Luca AI makes sure you see the shift in time.
What should you send each RFM segment?
Reward Champions and Loyal customers with early access and referral asks, not discounts. Send New and Promising customers a second-purchase flow timed to your median repurchase day. Run win-back flows for At risk and Previously loyal customers. Suppress Dormant customers from regular campaigns to protect deliverability. Klaviyo's 2017 benchmark found highly segmented campaigns earned $0.19 per recipient against $0.06 for unsegmented ones [4].
💰 Why segmenting pays before you write a word
Klaviyo analyzed over 2.5 billion emails sent by US customers in the last quarter of 2017 [4]. Highly segmented lists returned more than three times the revenue per recipient. Unsegmented campaigns also had about twice the unsubscribe rate.
That data is old, and it is Klaviyo's own. Treat it as direction, not a promise. Luca AI's read is that the gap is real but smaller today, because inbox providers now punish low engagement harder than in 2017. Either way, the cost of blasting everyone has gone up, not down.
📋 The segment playbook
The segment playbook
Segment
Goal
What to send
Discount?
Champions
Keep and amplify
Early access, new product previews, referral ask, review request
No
Loyal
Move up to Champions
Bundles, cross-category picks, loyalty perks
Rarely
Active
Build the habit
Replenishment reminders, how-to content
Small, if any
New
Earn order two
Welcome series, then a second-order nudge at your median day
Campbell's guidance is to treat high-value customers with exclusive perks and give them chances to advocate for the brand [1]. For the coffee store, that is first access to a limited single-origin lot. It costs margin on nobody who would have paid anyway.
⏰ Time the second order to your own clock
New and Promising customers decide whether they become regulars. Time the nudge to your median gap between orders, which was 30 days in the Q2 example. A reminder at day 25 lands before the bag runs out.
Campbell describes how Doe Lashes used a short quiz to ask first-time visitors if they were new to false lashes [1]. The answers shaped follow-up emails that taught newcomers how to apply them. RFM cannot tell you a buyer is new to your category. A one-question quiz can.
🔁 Win-back and suppression
At risk and Previously loyal customers already proved they will pay. Campbell calls lapsed but frequent customers ripe for win-back flows [1]. Start with a plain note and what is new. Add an offer only in the second or third email.
Dormant customers are different. Campbell advises generally avoiding lapsed customers who were never frequent [1]. Keep sending to them and your open rates fall, which hurts inbox placement for everyone else. Send one sunset email, then suppress.
⚠️ Automate most of it
Campbell reports that automated email series were just 1.8% of sends in 2020 but drove almost 30% of email revenue [1]. He suggests about 80% of messaging should be automated sequences or transactional messages, and about 20% campaigns [1]. RFM segments are the triggers that make that split possible.
Luca AI can send a weekly report of flow revenue by RFM group, with the reasoning behind any change. That shows whether win-back is recovering At risk customers or just discounting people who would have returned anyway. You read it Monday and decide which flow to adjust.
How do you build RFM in a spreadsheet, or inside Shopify and Klaviyo?
In a spreadsheet, export customers with last order date, order count, and amount spent, then use PERCENTRANK to assign 1 to 5 per column. In Shopify, open Analytics, then Reports, then RFM customer analysis, and build segments with the rfm_group filter [2]. In Klaviyo, open RFM analysis under customer insights and create segments from it [3]. A spreadsheet goes stale the day you build it, so plan a monthly refresh.
📄 Path 1: The spreadsheet build
This works for any store, including those below Klaviyo's 500-customer minimum [3]. It takes an afternoon the first time.
Score frequency with bands.=IFS(E2>=6,5,E2>=4,4,E2=3,3,E2=2,2,TRUE,1).
Join the digits.=G2&H2&I2 gives a score like 534.
Map to groups. Add FM as =FLOOR((H2+I2)/2) and apply the Shopify rules from Q4.
Change the ranges to match your row count. PERCENTRANK.INC returns each value's position from 0 to 1, so multiplying by five gives the quintile.
🛍️ Path 2: Shopify's native report
Go to Analytics, then Reports, and filter the category to Customers[2].
Open RFM customer analysis. Each group shows its share of customers, days since last order, orders, and spend.
Click a group. Choose View report for the customer list, or Preview segment to open the segment editor.
In Customers, then Segments, combine rfm_group with other filters, such as email subscription status.
Shopify does not show individual RFM scores in the admin, only the group [2]. That is fine for targeting but limits analysis.
📧 Path 3: Klaviyo's RFM analysis
Check the minimums: 500+ ordering customers, 180+ days of history, and orders in the last 30 days [3].
Open RFM analysis under customer insights (the menu path depends on your plan).
Use the RFM segments card to create segments, or pick the RFM profile property when building a segment.
Use those segments to trigger flows. The properties update daily [3].
⚠️ The reporting trap
The spreadsheet is fine for a first pass. It becomes a problem as a weekly ritual. Richie Jones of VAST told Luca AI that, in the early days, most of the business was tied up in Excel reports built from Shopify and returns exports [6].
Operators on Reddit and G2 say the same about native exports:
"Even on higher plans, Shopify doesn't really offer automated scheduled exports by itself." Reddit user, r/shopify Reddit Thread "Being able to pull this into a .csv file is great too, so I can manipulate the data even further." G2 reviewer, 5 stars, June 2023 Glew - G2 Verified Review
Luca AI replaces the monthly export. Ask for this month's RFM groups and which customers moved, and it answers from live Shopify data. The score logic stays yours; the copy-and-paste goes away.
What does cohort analysis show that RFM cannot?
Cohort return rates tell you how many buyers come back next year before you spend a dollar on ads.
Cohort analysis groups customers by when they first bought and tracks how many return over time. RFM shows where each customer stands today. Cohorts show whether this year's customers behave better or worse than last year's. One operator Luca AI interviewed sees about 30% of last year's buyers buy again this year, 10% of buyers from two years back, and 5% from three [7].
📅 What a cohort is
A cohort is a group of customers who share a start date, usually the month of their first order. You then track what share of each cohort comes back after 30, 60, and 90 days. The result is a triangle, because newer cohorts have less history.
Here is an illustrative example for the coffee store:
What a cohort is
First-order month
Customers
Repeat by day 30
Repeat by day 60
Repeat by day 90
January
400
18%
27%
33%
February
450
17%
25%
31%
March
520
15%
22%
Not yet
April
610
12%
Not yet
Not yet
🔎 How to read it
Read down each column. If repeat rates fall as cohorts get larger, your newer customers are weaker. In this example, April's 30-day repeat rate (12%) is well below January's (18%). That often means acquisition is pulling in bargain hunters, even while revenue grows.
RFM would not show this. April's customers are recent, so many score well on recency today. The cohort view shows they are not coming back at the same rate.
📈 The tailwind math
The 30%, 10%, and 5% pattern above is what that operator called the tailwind of the business [7]. It tells you how much revenue arrives next year before you spend a dollar on ads.
Here is an illustrative calculation. Say 4,000 people bought last year, 3,000 the year before, and 2,000 the year before that:
30% of 4,000 = 1,200 returning buyers
10% of 3,000 = 300 returning buyers
5% of 2,000 = 100 returning buyers
Total: 1,600 returning buyers to plan around
📊 What strong looks like
Luke Bean of Valente shared his own cohort numbers with Luca AI [5]. About 20% of new customers make a second purchase within 30 days. He said that by 12 months, roughly 65 to 75% have made multiple purchases. That is one brand, not a benchmark, but it shows what a strong repeat business can reach.
⚠️ The COVID distortion
The same operator who shared the tailwind numbers warned that COVID broke the pattern [7]. Customers acquired during COVID decayed at different rates, which made forecasting hard afterward. If your 2020 and 2021 cohorts look odd, exclude them from the averages you plan with.
"The retention and segmentation features have been very useful." G2 reviewer, January 2018 Mixpanel - G2 Verified Review
RFM vs cohorts vs predictive segments: which should you use when?
Use RFM to decide who gets which message this week. Use cohort analysis to judge whether acquisition quality is improving and to forecast next year's returning revenue. Use predictive segments, such as churn probability or predicted lifetime value, once you have enough order history for a model to beat simple rules. Stores under 500 customers should run RFM in a sheet first and review cohorts quarterly.
⚖️ The decision table
The decision table
-
RFM
Cohort analysis
Predictive segments
Question it answers
Who should get which message now?
Are newer customers better or worse?
Who will buy or leave next, and how much will they spend?
Data needed
Order dates and amounts
First-order date plus repeat orders
12+ months of orders, ideally more signals
Unit
One customer
A group by start month
One customer
Refresh
Monthly, or daily in tools
Monthly or quarterly
Weekly or monthly
Best for
Sends, offers, suppression
Acquisition quality, forecasting
Budget and retention spend
Weak spot
Looks backward
Hides individuals
Needs enough data to trust
🌱 Match the method to your stage
Campbell relays advice from Ivan Mazour that early brands should put budget into acquisition until they have a real list [1]. Mazour also notes that a few hundred visitors a day is not enough for accurate A/B tests [1]. The same applies to segmentation software. Below a few hundred customers, segments are too small to learn from.
For the coffee store with 6,000 customers, the order is clear. Run RFM monthly. Review the cohort table each quarter. Add predictions only when a decision depends on them, such as how much to spend on win-back.
🎯 Choose segments that change what you do
April Dunford, in Obviously Awesome, argues that useful segments are built on traits you can actually spot, not broad demographics [8]. In her view, focus belongs on buyers who care most about what you do better than others, and the group must be large enough to matter. That is a positioning idea, but it applies here. An RFM segment only earns a flow if it is identifiable and big enough to pay back.
❌ What none of these replace
Campbell also warns that multi-touch attribution is not customer journey tracking [1]. Attribution credits clicks to campaigns. RFM, cohorts, and predictions describe customers. Keep them separate in your head and in your reports.
Luca AI fits stores with enough history to reason against, and not stores below that line. For those that qualify, it runs RFM, cohort, and predictive questions from the same connected Shopify and Klaviyo data, so the three views never disagree on the underlying orders.
What does RFM miss about your best customers?
RFM counts orders and dollars but ignores which products were bought. Two customers with identical scores can be worth very different amounts next year. Anthony Mink of Live Bearded ran cohort analyses and found product-category diversity was the leading driver of lifetime value: customers who added body care rose about 50 to 100% in lifetime value [9]. Add a category-count column next to your RFM score.
🧔 The common view, and the surprise
Most retention advice says the same thing. Get customers to buy more often. Launch new products. Push the hero item again.
Anthony Mink, who runs Live Bearded, believed that too. In an interview with Luca AI, he described running four or five cohort analyses with Claude Code on his store data [9]. The result surprised him:
"I would have never thought product category diversity was the leading driver of lifetime value." Anthony Mink, Live Bearded, interview recorded by Luca AI [9]
He found that customers who bought body care jumped about 50 to 100% in lifetime value. Adding apparel and accessories lifted it again [9]. His team rebuilt their post-purchase sequence around one goal: moving single-category buyers into a second category.
💡 Why RFM hides this
In RFM, a beard-oil buyer with four orders and a buyer with four orders across oil, wash, and a hat score the same. Same recency, same count, maybe the same spend. Mink's data says they are not the same customer.
Luca AI's read is that this is the most common blind spot in RFM programs we see. The score tells you who to email. It does not tell you what to put in front of them.
📉 The trend inside the score
There is a second blind spot. RFM is a snapshot, so it misses direction. Campbell describes work by Peter Fader, a Wharton marketing professor, on site visits [1]. A customer with high baseline visits whose visits are falling was less likely to convert. A low-visit customer whose visits were rising was more likely to convert.
Two customers in the same segment can be heading in opposite directions. The segment label will not tell you which is which.
✅ What to add to your sheet
Add three columns next to the RFM score:
Categories bought: count of distinct product categories per customer.
Last gap vs usual gap: days since last order divided by the customer's own median gap. Above 1.5 means they are late.
First product: the item in the first order, which often predicts what they buy next.
A Loyal customer with one category is your cross-sell list. A Champion whose last gap is twice their usual is an early warning.
"It lacks the ability to draw out specific metrics for more detailed dive through." G2 reviewer, 4 stars, April 2023 Triple Whale - G2 Verified Review
⚠️ Too many reports is its own problem
Mink also described the other side. His AI analysis produced about 20 executive summaries, each roughly 25 pages long [9]. The insight was there, but he was left asking how to act on it. More analysis is not the goal. One clear next move is.
Luca AI can answer "what is lifetime value for customers who bought from two or more categories versus one" directly against Shopify orders. It returns the numbers and the reasoning in one reply, not a 25-page summary. You decide which cross-category flow to build.
How do you move from RFM to churn and CLV predictions?
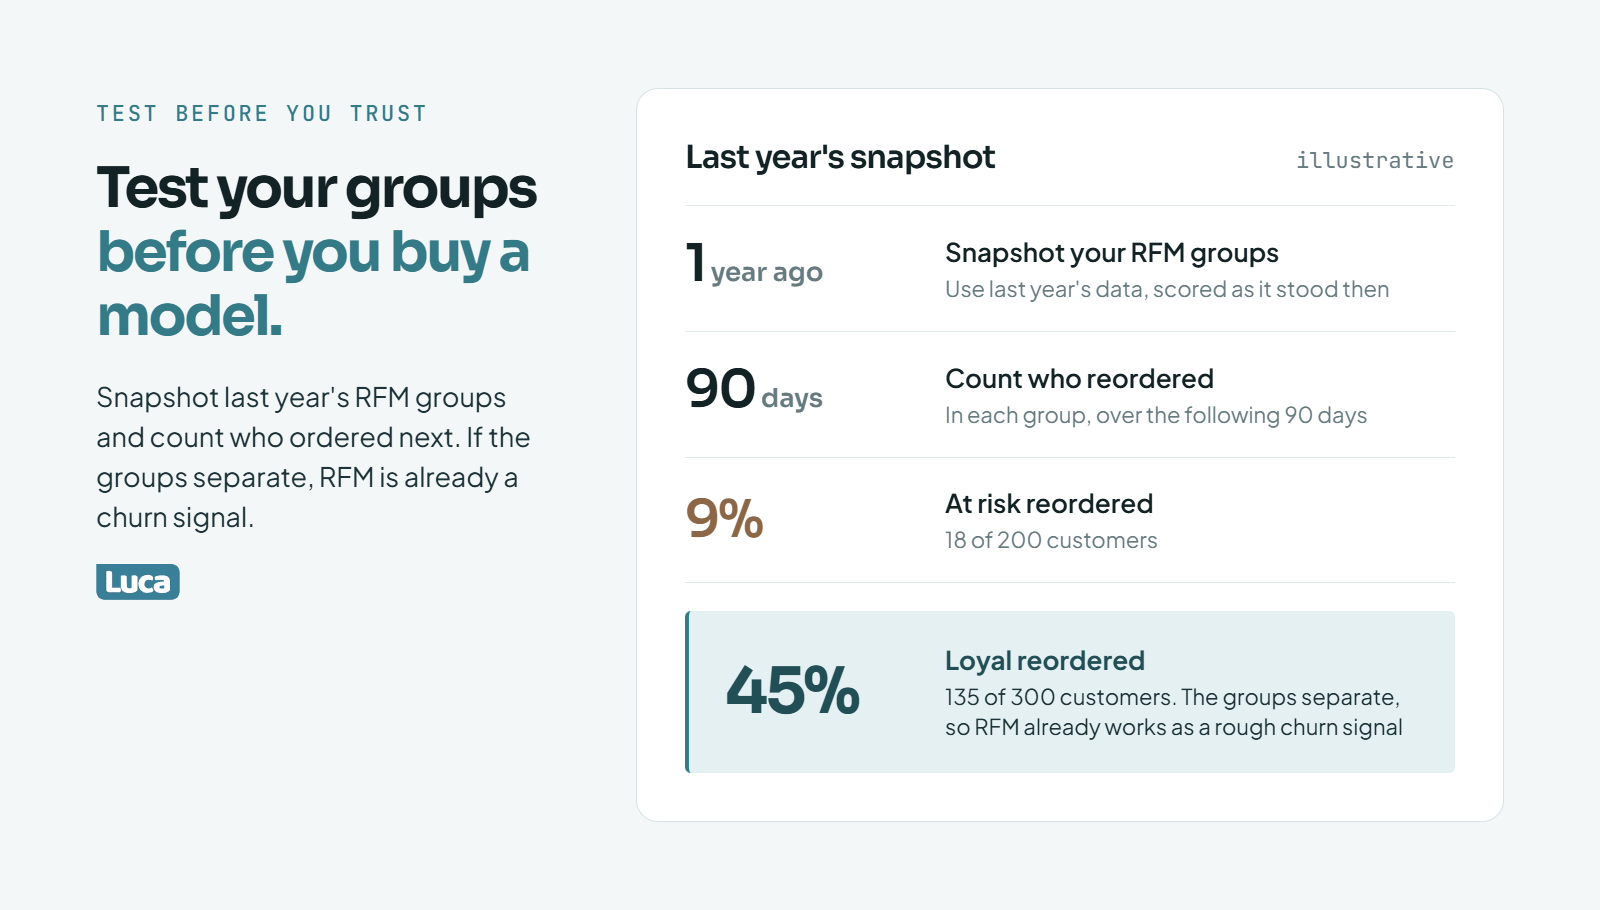
If your RFM groups separate like this, they already work as a rough churn signal before you buy a model.
Recency, frequency, and monetary value, plus how long each customer has been with you, are the exact inputs of classic customer lifetime value (CLV) models such as BG/NBD with Gamma-Gamma [10][11]. RFM sorts customers by what already happened. A predictive model estimates how likely each one is to buy again and how much they will spend. Before trusting any model, check that your At risk segment really does churn faster than Loyal.
🔬 Same inputs, different question
In 2005, Peter Fader, Bruce Hardie, and Ka Lok Lee published the BG/NBD model [10]. It predicts how many future purchases a customer will make. It uses three numbers per customer: repeat purchases, the time of the last purchase, and the customer's age with you.
The same authors linked RFM directly to CLV in a 2005 paper in the Journal of Marketing Research[11]. A companion model, Gamma-Gamma, estimates average order value from past spend. Together they turn an RFM table into a predicted dollar value per customer.
🔁 What changes when you predict
What changes when you predict
-
RFM segment
Predictive score
Output
A label, such as At risk
A probability or a dollar figure
Time frame
What happened so far
What is likely next
Example
Customer F is Loyal
Customer F has a 40% chance of ordering in 90 days
Best use
Choosing the message
Choosing how much to spend on a customer
The 40% figure is illustrative. It shows the kind of output a model gives, not a benchmark.
🧪 Test before you trust
Do not buy a churn model until you have tested your RFM groups. Here is a simple test using last year's data:
Take a snapshot of your RFM groups from a date one year ago.
Count who in each group ordered in the following 90 days.
Compare the rates.
An illustrative result: 18 of 200 At risk customers reordered (9%), while 135 of 300 Loyal customers reordered (45%). If your groups separate like this, RFM is already working as a rough churn signal. If they do not, fix your scoring windows first. A model trained on badly scored data will just be confidently wrong.
💸 When the model is worth it
Prediction earns its keep when it changes a budget. For example, it can set how much to spend winning back a Previously loyal customer, or cap ad spend at predicted lifetime value. If the score will not change a send or a spend, stay with RFM.
Ari Tulla, founder of ELO Health, told Luca AI his company spent about $10 million building systems to turn data into meaning [12]. He said large language models then did the job far better. Most stores should not build this from scratch.
🧭 Where this goes next
Churn probability and predicted CLV are the next layer of the same customer data. Start with the RFM groups you trust, then let a model refine the ones where money is at stake.
Luca AI runs churn and lifetime value questions on the Shopify and Klaviyo data you already connected. There is no data team and no custom build like the one ELO Health paid for. You ask which Loyal customers look likely to lapse this quarter, and it returns the list with the reasoning behind each.
References
Kunle Campbell, E-commerce Growth Strategy (book). RFM principle, recency and frequency thresholds, median repurchase interval, segment actions, automation share, Doe Lashes and Electronic Arts examples, and Peter Fader's visit-frequency finding.
Luke Bean, Valente, interview recorded by Luca AI.
Richie Jones, VAST, interview recorded by Luca AI.
Luca AI operator interview on multi-year cohort retention, recorded by Luca AI.
April Dunford, Obviously Awesome (book), on segmentation and positioning. Paraphrased, not quoted.
Anthony Mink, Live Bearded, interview recorded by Luca AI.
Peter S. Fader, Bruce G. S. Hardie, and Ka Lok Lee, "Counting Your Customers the Easy Way: An Alternative to the Pareto/NBD Model," Marketing Science 24(2), 2005. https://doi.org/10.1287/mksc.1040.0098
Peter S. Fader, Bruce G. S. Hardie, and Ka Lok Lee, "RFM and CLV: Using Iso-Value Curves for Customer Base Analysis," Journal of Marketing Research 42(4), 2005. https://doi.org/10.1509/jmkr.2005.42.4.415
Ari Tulla, ELO Health, interview recorded by Luca AI.
FAQ's
How often should we re-run RFM analysis?
Monthly is the right default for most Shopify stores. RFM scores shift as customers order or go quiet, and a score that is three months old will send win-back emails to people who already came back.
Inside Shopify or Klaviyo: the groups refresh on their own. Klaviyo updates its RFM profile properties daily, so flows always act on the latest group.
In a spreadsheet: re-export and re-score once a month, on the same day each month, so the changes are comparable.
After big promotions: re-score once the sale ends. A Black Friday spike can push one-time bargain buyers into Active or New.
We also recommend keeping last month's scores beside this month's. The movement between groups is the real signal. If Champions shrink while Previously loyal grows, your best buyers are drifting, even if revenue looks fine.
Luca AI removes the monthly export step. It reads live Shopify and Klaviyo data, so you can ask which customers changed groups since last month and get the list with the reasoning. Our guide to automated e-commerce reporting covers how to schedule that as a weekly or monthly report instead of a manual task.
How many customers do we need before RFM analysis is useful?
RFM starts to earn its keep once you have a few hundred customers with orders, and it works best above about 500. Below that, each segment holds too few people to learn from, and one customer can swing a whole group.
Under a few hundred customers: spend on acquisition first. Segmenting a tiny list rarely changes what you send.
A few hundred to 500: run RFM in a spreadsheet with fixed thresholds instead of quintiles, so groups stay stable.
500 and up: Klaviyo's native RFM model becomes available. It needs at least 500 ordering customers, 180 days of history, and orders in the last 30 days.
History matters as much as headcount. A store with 2,000 customers who all bought in the last two months has no real recency spread yet. Give it at least six months.
Luca AI is built for stores with enough order history to reason against, and we say so plainly. If you are below that line, a spreadsheet and the Shopify analytics basics will serve you better than any paid segmentation tool.
Is RFM analysis the same as customer lifetime value?
No. They use the same raw data but answer different questions.
RFM analysis describes the past. It ranks each customer by how recently they bought, how often, and how much, and puts them in a segment.
Customer lifetime value (CLV) is the total revenue or profit a customer brings over the whole relationship. Historical CLV adds up what they already spent. Predicted CLV estimates what they will spend next.
The link between them is close. Academic CLV models such as BG/NBD with Gamma-Gamma take recency, frequency, monetary value, and customer age as their inputs. So a clean RFM table is the first step toward predicted CLV.
In practice, we use RFM to decide which message a customer gets this week, and CLV to decide how much we can afford to spend keeping or winning them. Mixing the two up leads to errors, such as spending heavily on a win-back for a customer who was never worth much.
Luca AI calculates both from the same connected Shopify orders, so the segment and the value number never disagree on the underlying data. For the full picture of how lifetime value works, see our guide to e-commerce customer lifetime value.
Does RFM analysis work for subscription brands or products people rarely rebuy?
Yes, but you have to change the windows. Standard RFM assumes customers choose when to reorder. Subscriptions and rare purchases break that assumption in different ways.
Subscriptions: recency and frequency are set by the billing cycle, so active subscribers all look alike. Score one-off orders separately, and track churn monthly for the subscription itself.
Rare purchases: a mattress store and a coffee store cannot share a recency window. Set yours from your own median days between orders, not a blog's default.
Mixed catalogs: if you sell both a durable item and refills, score the refill behavior. That is where the repeat habit lives.
For long-cycle products, monetary value and the first product bought often matter more than frequency. A customer who bought a high-end grinder once may be worth more than one who bought three sample packs.
Luca AI can return your median repurchase interval by product category in one question, which tells you which window fits each part of your catalog. Our guide to customer retention strategies for e-commerce covers what to do once the right customers are found.
Which RFM segment should we act on first?
Start with At risk and Previously loyal. These customers have already proven they will buy, they have recently gone quiet, and a win-back email costs almost nothing compared with acquiring a new customer.
First: a win-back flow for At risk and Previously loyal, opening with what is new and adding an offer only in a later email.
Second: a second-order flow for New and Promising customers, timed to your median repurchase day.
Third: suppress Dormant customers from regular campaigns to protect deliverability.
Fourth: early access and referral asks for Champions, without discount codes.
We put Champions last on purpose. They are already buying, so the risk there is over-discounting, not losing them. The money you can recover this month sits in the groups that are slipping.
Measure each flow by revenue per recipient against a holdout group that receives nothing. That shows whether the flow recovers customers or just discounts people who would have returned anyway.
Luca AI can report flow revenue by RFM group every week, with the reasoning behind any change. For a broader view of who your customers are, read our guide to e-commerce customer segmentation.
Enjoyed the read? Join our team for a quick 15-minute chat — no pitch, just a real conversation on how we’re rethinking Ecommerce with AI - Luca
Loading Schedule...
Your AI Co-Founder is here.
Here’s why:
Shopify, Meta, Xero - one brain.
"Should I scale?" Answered with real data.
Growth capital. No applications. One click.
Thank you! Your submission has been received! Please book a time slot for the Meeting
Oops! Something went wrong while submitting the form.