Ecommerce predictive analytics examples fall into six use cases: demand forecasting, churn and CLV, personalization, pricing, marketing payback, and replenishment timing.
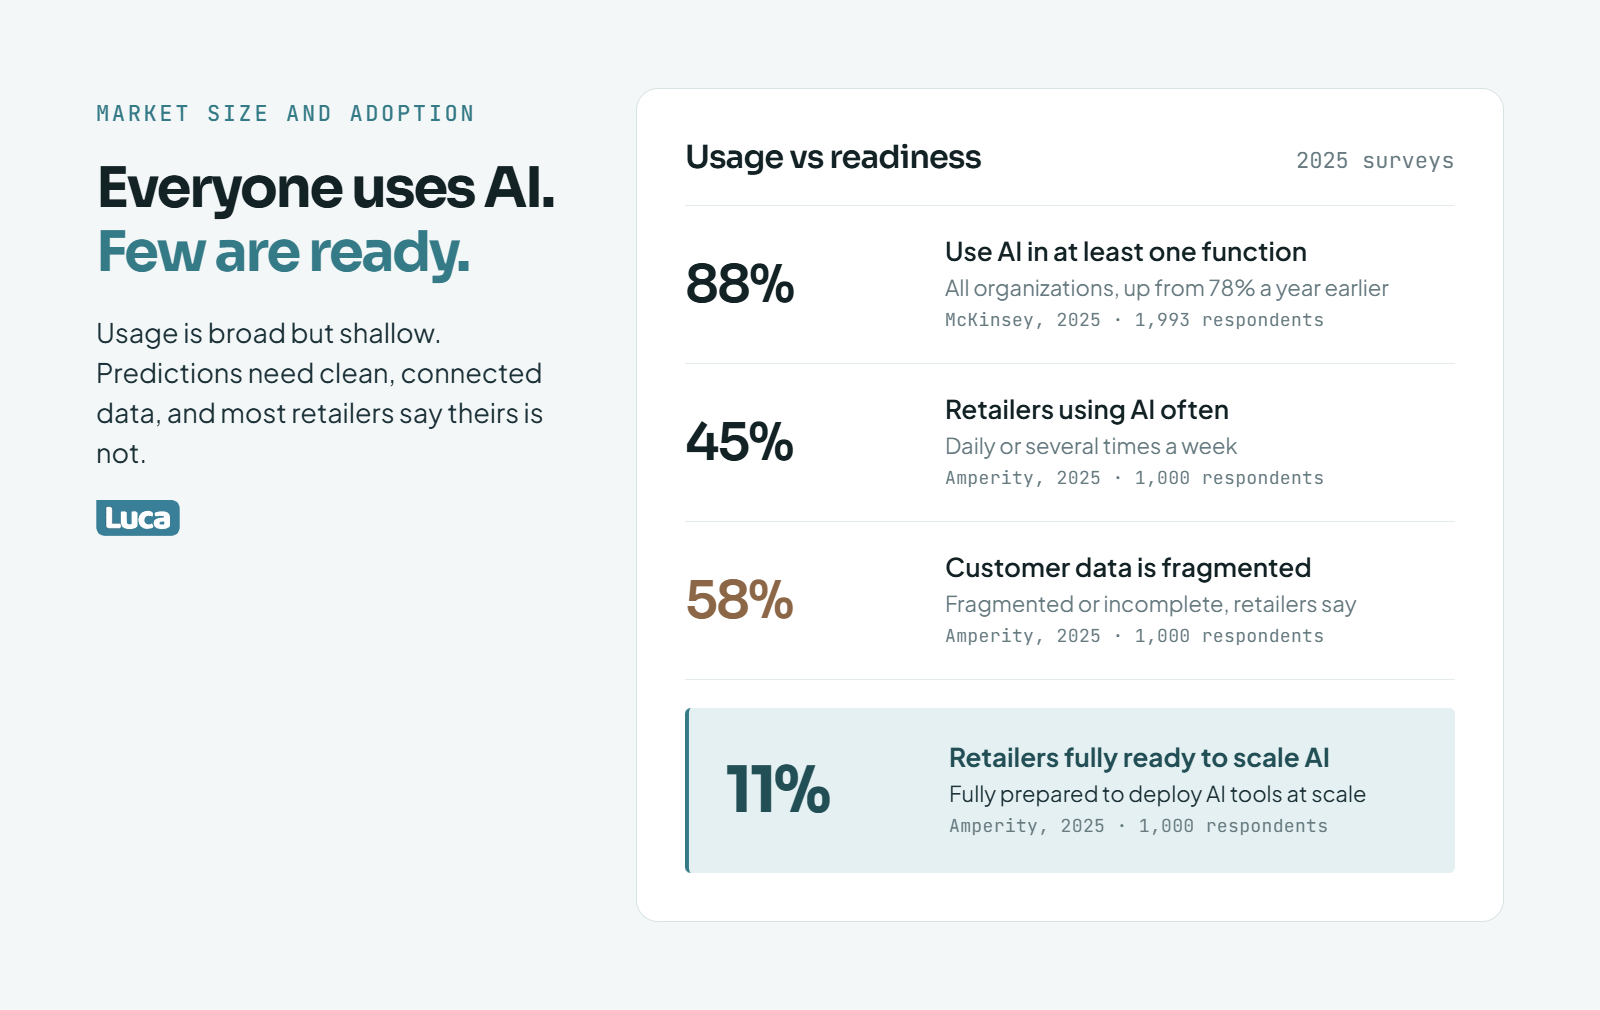
Grand View Research valued the market at $18.9 billion in 2024, and McKinsey found 88% of organizations used AI in at least one function in 2025.
Usage is not readiness: Amperity found only 11% of retailers feel fully prepared to scale AI, and 58% call their customer data fragmented.
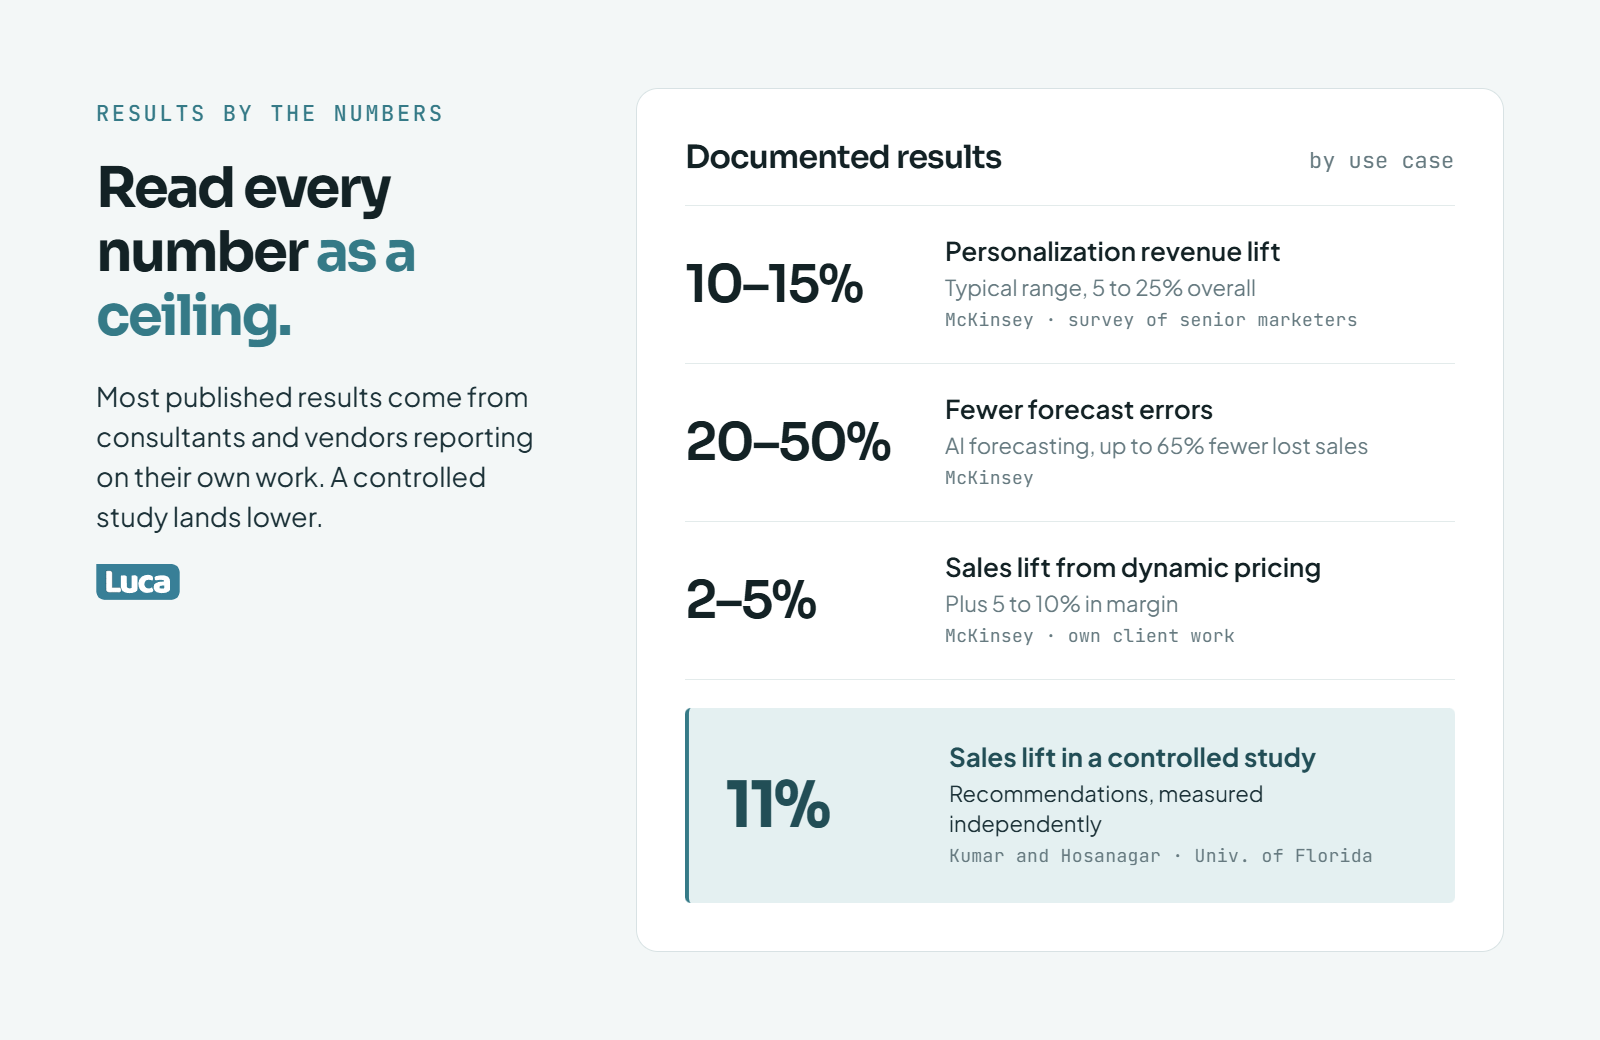
Documented results are ceilings, not promises: personalization lifts revenue 10 to 15%, forecast errors fall 20 to 50%, and pricing adds 2 to 5% in sales.
Winning examples share three traits: unified data, one prediction tied to one decision, and an action that runs without a meeting.
Start by stage: rules under 500 customers, built-in Klaviyo predictions up to about 10,000, then unified forecasting. Retire the 35% Amazon claim.
Predictive analytics examples in ecommerce include demand forecasting, churn and lifetime value scoring, product recommendations, dynamic pricing, and predicted marketing payback. The documented results are real but narrower than vendor decks suggest: personalization typically lifts revenue 10 to 15%, and AI forecasting cuts forecast errors 20 to 50% (McKinsey, 2021; McKinsey). Below are the examples, the numbers, and where each one breaks.
A founder I'll call Maya runs a skincare brand on Shopify. She has about 9,000 customers, Klaviyo for email, and three months of cash sitting in inventory. Last quarter she opened a vendor deck promising "AI-powered predictions" and closed it ten minutes later. Every example was a hospital, a jet engine, or Amazon. None of it told her whether a prediction would pay for itself in her store.
This article is written for Maya. Every statistic has a date and a source, and every example follows one chain: problem, signal, prediction, action, result. For the methods behind these examples, start with our guide to predictive analytics in e-commerce.
How big is the predictive analytics market, and how many companies actually use it?
AI use is broad but shallow: few retailers have the clean, connected data that predictions need.
Grand View Research valued the global predictive analytics market at $18.9 billion in 2024 and projects $82.3 billion by 2030. Adoption is broad but shallow. McKinsey's 2025 survey found 88% of organizations use AI in at least one business function. Amperity's 2025 retail survey found only 11% of retailers feel fully prepared to deploy AI at scale, and 58% call their customer data fragmented or incomplete.
💰 What the market size estimates say
Research firms disagree on the exact number because they define the market differently. Some count only software. Others add services and consulting. The spread is still useful, because every estimate points the same way.
CAGR means compound annual growth rate, the average yearly growth over the forecast period. For Maya, the takeaway is simple. Vendors are pouring money into this category, so predictive features will show up inside tools she already pays for.
📊 How many companies actually use it
McKinsey surveyed 1,993 respondents across 105 countries between June and July 2025. 88% said their organization uses AI in at least one function, up from 78% a year earlier. Only 23% said they were scaling AI agents anywhere in the business.
Retail looks similar. Amperity surveyed 1,000 retail professionals in 2025. Here is what they reported:
45% use AI daily or several times a week.
97% plan to keep or raise AI spending.
11% feel fully prepared to deploy AI tools at scale.
58% say their customer data is fragmented or incomplete.
⚠️ Usage is not readiness
That last number is the one I would pin above my desk. Most teams are using AI to write product copy or summarize reports. Far fewer have the clean, connected data that predictions need. Kunle Campbell, in E-commerce Growth Strategy, cites Amperity research showing consumer companies misidentify up to 23% of their best customers, who drive over 50% of revenue. A churn model fed that data will confidently score the wrong people.
So the honest adoption picture has two layers. The tools are everywhere. The data underneath them is not ready in most stores.
✅ What this means for a store doing $150k a month
If you run a store Maya's size, you do not need to "adopt predictive analytics." You probably already own it. Klaviyo, Shopify, and most inventory apps ship predictive fields today. The question is whether your data is clean enough for those fields to be right.
Luca AI's read is that most stalled predictive projects fail at the data layer, not the model. We see the same pattern the Amperity numbers describe: Shopify says one thing, Meta says another, and Klaviyo counts a third set of customers.
Luca AI connects Shopify, Meta, Google, and Klaviyo, then normalizes and standardizes that data on ingestion. That addresses the barrier 58% of retailers named, before any prediction runs. You can then ask a plain-English question, like "which SKUs will stock out before my next PO lands?", and get an answer built on one version of the numbers.
What results do predictive analytics examples actually deliver, by the numbers?
Treat consultant and vendor results as ceilings; an independent controlled study found an 11% lift.
Documented results cluster in four places. McKinsey reports personalization typically lifts revenue 10 to 15%. AI forecasting cuts forecast errors 20 to 50% and lost sales up to 65% (McKinsey). Dynamic pricing adds 2 to 5% in sales and 5 to 10% in margin for McKinsey's retail clients. Netflix estimates its recommendations save over $1 billion a year through lower churn (Gomez-Uribe and Hunt, 2015).
📈 The benchmark table
Documented predictive analytics results by use case
Notice who produced most of these figures. Consultants report results from their own clients. Netflix reports on its own system. None of that makes them false, but it does make them upper bounds.
The University of Florida study is the useful reality check. It measured an 11% sales lift from recommendations (University of Florida). That is strong. It is also nowhere near the "35% of Amazon's sales" figure that gets repeated in vendor decks.
🛒 AI in ecommerce statistics worth knowing
Shoppers are also arriving through AI tools now. Adobe reported that traffic to US retail sites from generative AI tools rose 693.4% year over year in the 2025 holiday season. Those visitors converted 31% better than other traffic (Adobe AI traffic data).
That matters for prediction because new channels break old forecasts. A model trained on 2023 traffic has never seen this source.
🧮 Size the result for your own store first
Here is how I would test any benchmark before believing it. This is an illustrative example, not a client result.
Say Maya's Klaviyo flows drive $30,000 a month. A 10% lift on that is $3,000 a month, or $36,000 a year. If the tool that promises the lift costs $1,500 a month, the net gain is $18,000 a year. That is worth doing. If the realistic lift is 5%, the gain is $18,000 a year and the net is zero.
Campbell cites Bain research that the average ecommerce customer takes 12 months to break even. So a prediction that improves retention compounds. One that only nudges a click rate usually does not.
Run that arithmetic for each use case. The table above stops being a brochure and becomes a shortlist.
How do ecommerce brands use predictive analytics for demand and inventory?
Demand forecasting predicts unit sales per SKU and location, so you reorder before a stockout and stop overbuying slow movers. The stakes are large. IHL Group estimates inventory distortion, meaning out-of-stocks plus overstocks, costs retailers $1.73 trillion a year. Walmart forecasts with an in-house neural network (Retail Dive). A Shopify store can start with SKU velocity, lead times, and seasonality.
🏬 Situation: the cost of guessing
IHL's September 2025 figure equals roughly 6.5% of global retail sales (IHL Group, 2025). Every brand feels it in two ways. A stockout loses the sale and often the customer. An overstock locks cash in boxes that discount later.
Maya's version is concrete. Her best-selling serum stocks out for 11 days every spring. Meanwhile, two seasonal SKUs sit in the warehouse for six months.
🧠 How the big players forecast
Walmart uses a multi-horizon recurrent neural network, built in-house, to predict demand at several future points (Retail Dive). A recurrent neural network is a model that reads sequences, like daily sales, and learns patterns over time. Walmart then shifts inventory toward regions where an item sells faster.
Shein takes a different route. Campbell describes it releasing 6,000 to 10,000 new items a day in batches of 100 to 500 units. Trend data predicts what might sell. Small batches test it. Winners get reordered and losers get dropped.
❌ Complication: when the forecast lies
Not every forecasting tool earns trust. Deb Farnworth-Wood, CEO of Issada, described a native AI forecasting feature in her inventory system this way:
"We tried that for about 6 months I think but we couldn't rely on it... we had it definitely hallucinating and telling fibs, and we had to shut it down." Deb Farnworth-Wood, CEO of Issada, Luca operator interview
Analytics tools carry the same risk when the inventory data itself is wrong. One Polar Analytics customer with six Shopify stores sharing a warehouse wrote:
"I've also reported an issue with inventory levels, as our inventory is multiplied with 6, since we have 6 different shopify stores connected to the same warehouse." Maja, Polar Analytics - Trustpilot Review, November 7, 2025
A forecast built on six times the real stock will never trigger a reorder.
✅ Resolution: a reorder point you can trust
Here is an illustrative worked example. Maya's serum sells a median of 40 units a day over eight weeks. Her last six supplier lead times were 18, 20, 21, 21, 22, and 45 days.
Mean lead time: 147 ÷ 6 = 24.5 days.
Median lead time: 21 days.
Safety stock: 7 days × 40 units = 280 units.
Reorder point with the median: (40 × 21) + 280 = 1,120 units.
Reorder point with the mean: (40 × 24.5) + 280 = 1,260 units.
That one 45-day outlier adds 140 units. At a $12 landed cost, that is $1,680 of cash tied up for no reason. Campbell recommends median, not mean, lead times for exactly this reason.
🔔 Turning the forecast into a purchase order
A forecast only pays when it triggers an action. Luca AI watches stock levels against sales velocity and pings you on Slack or email when inventory falls below a threshold you set. Luca AI also reasons across ad spend, so a planned Meta push shows up as higher expected demand before the reorder point is hit.
How do stores predict customer lifetime value, churn and the next order?
Customer prediction scores each buyer on future value, churn risk, and the likely date of their next order, using order count, timing, and spend. Klaviyo calculates predicted customer lifetime value (CLV) over a one-year window by default. It requires at least 500 customers with orders, 180 days of order history, and some customers with three or more orders (Klaviyo).
🧾 What the models actually use
CLV is the total revenue you expect from a customer over a set period. Churn risk is the chance they never buy again. Klaviyo's churn probability drops each time a customer orders and rises as time passes between orders.
Klaviyo also predicts an expected date of next order. Where a customer has no clear pattern, it borrows from how your other customers behave (Klaviyo). That fallback is useful, but it means one-time buyers get an average, not a personal forecast.
⚠️ The threshold most stores skip past
The 500-customer floor matters. Below it, the model has too few repeat buyers to separate signal from noise. A store with 300 customers should segment by RFM instead. RFM stands for recency, frequency, and monetary value: how recently, how often, and how much someone buys.
🧔 The Live Bearded finding
Anthony Mink, CEO of Live Bearded, ran four or five cohort analyses on his Shopify data with Claude Code. He expected purchase frequency to drive lifetime value. It did not.
"I would have never thought product category diversity was the leading driver of lifetime value... anybody who buys body care ultimately jumps up about 50 to 100% in LTV." Anthony Mink, CEO of Live Bearded, Luca operator interview
He rebuilt post-purchase flows around getting buyers into a second category. That is a prediction turned into a specific action.
📱 Next-order timing in practice
310 Nutrition, a supplement brand, runs automated SMS flows through Postscript, integrated with Shopify and ReCharge. Postscript reports $100K+ in weekly SMS revenue, a 59x return on automations and campaigns, and $2.65+ per text. Timing messages to when a customer is likely to run out is the predictive part.
👀 A signal most tools ignore
Peter Fader and Wendy Moe found that changes in visit frequency predict conversion better than averages (Kunle Campbell, E-commerce Growth Strategy). A loyal visitor who visits less often is cooling. An occasional visitor who visits more often is warming. Few dashboards show this.
Tools that report CLV often stop at the export. One Glew user put it plainly:
"I think the software could also offer better automatic & actionable insights... [based] on performance by audience, channel, and product." Verified user, Glew - G2 Verified Review, September 6, 2019
🔁 From score to action
Luca AI provides cohort-level vigilance without the cohort-level dashboard. Ask Luca AI which first-order categories produce the highest 12-month value, and it compares cohorts across Shopify and Klaviyo. Luca AI then flags when a cohort's repeat rate drifts below its usual pattern, so you adjust the flow before the quarter closes.
What do personalization and recommendation examples look like in practice?
Personalization uses past behavior to predict what each shopper is likely to want next, then changes the product, offer, or message they see. McKinsey puts the typical revenue lift at 10 to 15%. Netflix reports that recommendations influence about 80% of hours streamed (Gomez-Uribe and Hunt, 2015). Twilio Segment's 2023 survey found 56% of consumers say they become repeat buyers after a personalized experience.
🎯 How the prediction works
A recommendation engine looks at what you bought, viewed, or skipped. It then finds products that similar shoppers bought next. The output is a ranked list: "people who bought this cleanser bought this toner."
The prediction is the easy part now. Shopify themes, Klaviyo, and most search apps include it. The hard part is choosing where it shows up, and whether the data behind it is right.
☕ Netflix and Starbucks: two documented examples
Netflix is the clearest public case. Carlos Gomez-Uribe and Neil Hunt wrote that personalization and recommendations save Netflix more than $1 billion a year, mainly through lower churn (Gomez-Uribe and Hunt, 2015). The gain comes from retention, not from bigger baskets.
Starbucks built an AI platform called Deep Brew in 2019. Then-CEO Kevin Johnson said it would "increasingly power our personalization engine, optimize store labor allocations, and drive inventory management" (Restaurant Dive). Drive-thru menu boards suggest items based on weather, time of day, store inventory, and purchase history.
⚠️ Where prediction gets creepy
Target is the cautionary tale. Charles Duhigg reported in 2012 that a Target statistician found about 25 products that, analyzed together, produced a pregnancy prediction score (The New York Times). Target then mailed baby coupons based on it.
The famous detail, a father learning about his daughter's pregnancy from coupons, is disputed. Eric Siegel of Predictive Analytics World calls that anecdote a myth. The lesson holds either way. A correct prediction delivered badly costs trust.
🧪 The small-store path: rules before models
Here is my contrarian take. Below roughly 10,000 contacts, a personalization engine is usually the wrong buy. Campbell quotes Ivan Mazour of Ometria on this exact point:
"Expensive personalization tools and website A/B testing can wait. Instead, opt for simpler but effective solutions." Ivan Mazour, quoted in Kunle Campbell, E-commerce Growth Strategy
For Maya's skincare brand, that means a product quiz that asks skin type, then a flow per answer. Rules built on what customers tell you, called zero-party data, beat a model that has too few buyers to learn from.
✅ What to test first
Post-purchase cross-sell based on first category bought.
Replenishment reminders timed to typical use-up dates.
Browse-abandon emails showing the exact product viewed.
Measure each against a holdout group that gets no personalization. If the lift is under 5%, the setup cost may not be worth it.
Luca AI fits after this stage. Luca AI compares which first purchases lead to second purchases across Shopify and Klaviyo, so you can pick the cross-sell pairs from your own data, not a vendor default.
How is predictive analytics used for pricing and markdowns?
Pricing models predict how demand changes as price changes, then set prices or markdowns that clear stock at the best margin. McKinsey reports 2 to 5% sales growth and 5 to 10% margin gains for retail clients using dynamic pricing. A vendor case study reports a 2.4% seasonal revenue gain and 2% lower markdown loss for a European apparel retailer (invent.ai).
📉 The mechanism in plain English
Price elasticity means how much demand moves when price moves. If a 10% discount lifts units 30%, demand is elastic. If it lifts units 3%, you are giving away margin.
A pricing model estimates elasticity per product from past discounts, seasonality, and stock levels. It then answers one question: what price sells the remaining stock by a deadline, at the highest total profit?
The last two are vendor case studies. They are self-reported and not audited. I include them because they show the realistic range: low single digits, not doubled profits.
🧮 A worked markdown example
This is an illustrative example with made-up numbers. Maya has 600 units of a seasonal body oil left, eight weeks before the season ends. Full price is $40. Landed cost is $14. Anything unsold goes to a clearance partner at $18.
Option A, hold full price. The forecast predicts 200 units sell at $40, which is $8,000. The other 400 clear at $18, which is $7,200. Revenue is $15,200.
Option B, 20% off now. At $32, the forecast predicts 450 units sell, which is $14,400. The other 150 clear at $18, which is $2,700. Revenue is $17,100.
Cost is $8,400 either way (600 × $14). Gross profit is $6,800 for A and $8,700 for B. The earlier markdown earns $1,900 more, because the prediction says this product is price-sensitive.
❌ When not to do it
Dynamic pricing breaks in two places for small brands:
Thin data. A SKU with 40 sales a year cannot produce a reliable elasticity estimate.
Brand price integrity. Customers who see prices move every week learn to wait for the discount.
My position: most Shopify brands should predict markdown timing, not change prices daily. The money is in clearing seasonal stock earlier, not in chasing competitors.
Luca AI supports this by forecasting sell-through per SKU from Shopify sales history. Ask Luca AI which SKUs will still have stock at season end, and you get a list to plan markdowns around.
How do marketing teams use predictive analytics to spend smarter?
Marketing teams use prediction to decide who to target, when to send, and which channel earns the next dollar back fastest. Electronic Arts replaced mass emails with behavioral segments. Brinks Home went from 2 or 3 daily tests to over 50,000 and reported a 9.5% revenue lift (Kunle Campbell, E-commerce Growth Strategy). For a store, predicted payback and blended marketing efficiency ratio keep spend tied to customers who return.
💸 Why payback is the number to predict
Campbell cites Bain research that the average ecommerce customer takes 12 months to break even. That means most of your ad spend is a loan to future repeat orders. If you can predict which customers will repeat, you can bid more for them and less for one-time buyers.
Blended marketing efficiency ratio (MER) is total revenue divided by total ad spend across every channel. It ignores each platform's own attribution claims. That makes it a steadier input for a payback forecast.
🎮 Electronic Arts and Brinks Home
Campbell describes Electronic Arts in 2013, voted "worst company in America" while sending identical mass emails. Its data teams moved to segments based on how players actually behaved. Net revenue later reached nearly $7 billion by fiscal 2022 ($7.5 billion in net bookings), with FIFA Ultimate Team alone generating $1.62 billion. Many factors drove that growth, so treat segmentation as one contributor, not the cause.
Brinks Home, a home security company, combined smart-home and security data to enrich customer profiles (Kunle Campbell, E-commerce Growth Strategy). It scaled from 2 or 3 daily A/B tests to more than 50,000. The reported result was a 9.5% revenue lift.
"Some data we still notice discrepancies between platforms, for example, tracking ads, and differences in the reported metrics like revenue." Verified user, Triple Whale - G2 Verified Review, April 20, 2023, 4 stars
Even the happy customer does manual checks. A payback model built on misaligned revenue will over-bid somewhere.
🤖 The new channel no model has seen
Adobe found generative AI referrals to US retail sites converted 31% better than other traffic in the 2025 holidays. A propensity model trained before 2025 has no history for this source. Watch it as its own segment until you have a full season of data.
How do Amazon, Netflix, Walmart and other big brands do it?
Amazon documented item-to-item collaborative filtering for recommendations in 2003 (IEEE Internet Computing, 2003) and was granted a patent for anticipatory shipping in 2013 (US Patent 8,615,473). Netflix credits personalization with over $1 billion a year in retention value (Gomez-Uribe and Hunt, 2015). Walmart forecasts demand with an in-house neural network (Retail Dive). Starbucks uses Deep Brew for personalization, labor, and inventory (Restaurant Dive). The copyable part is the loop from prediction to action.
📦 Amazon: recommendations and anticipatory shipping
Greg Linden, Brent Smith, and Jeremy York described Amazon's approach in IEEE Internet Computing in 2003. Instead of matching similar customers, it matches similar items. "Customers who bought X also bought Y" is computed ahead of time, so it scales to millions of products.
US Patent 8,615,473, granted in December 2013, covers "anticipatory package shipping". The idea is to move items toward a region before anyone orders them, based on signals like searches, wish lists, and cart activity. A patent is not proof of deployment, so treat this as intent, not a documented result.
❌ The 35% claim you should stop quoting
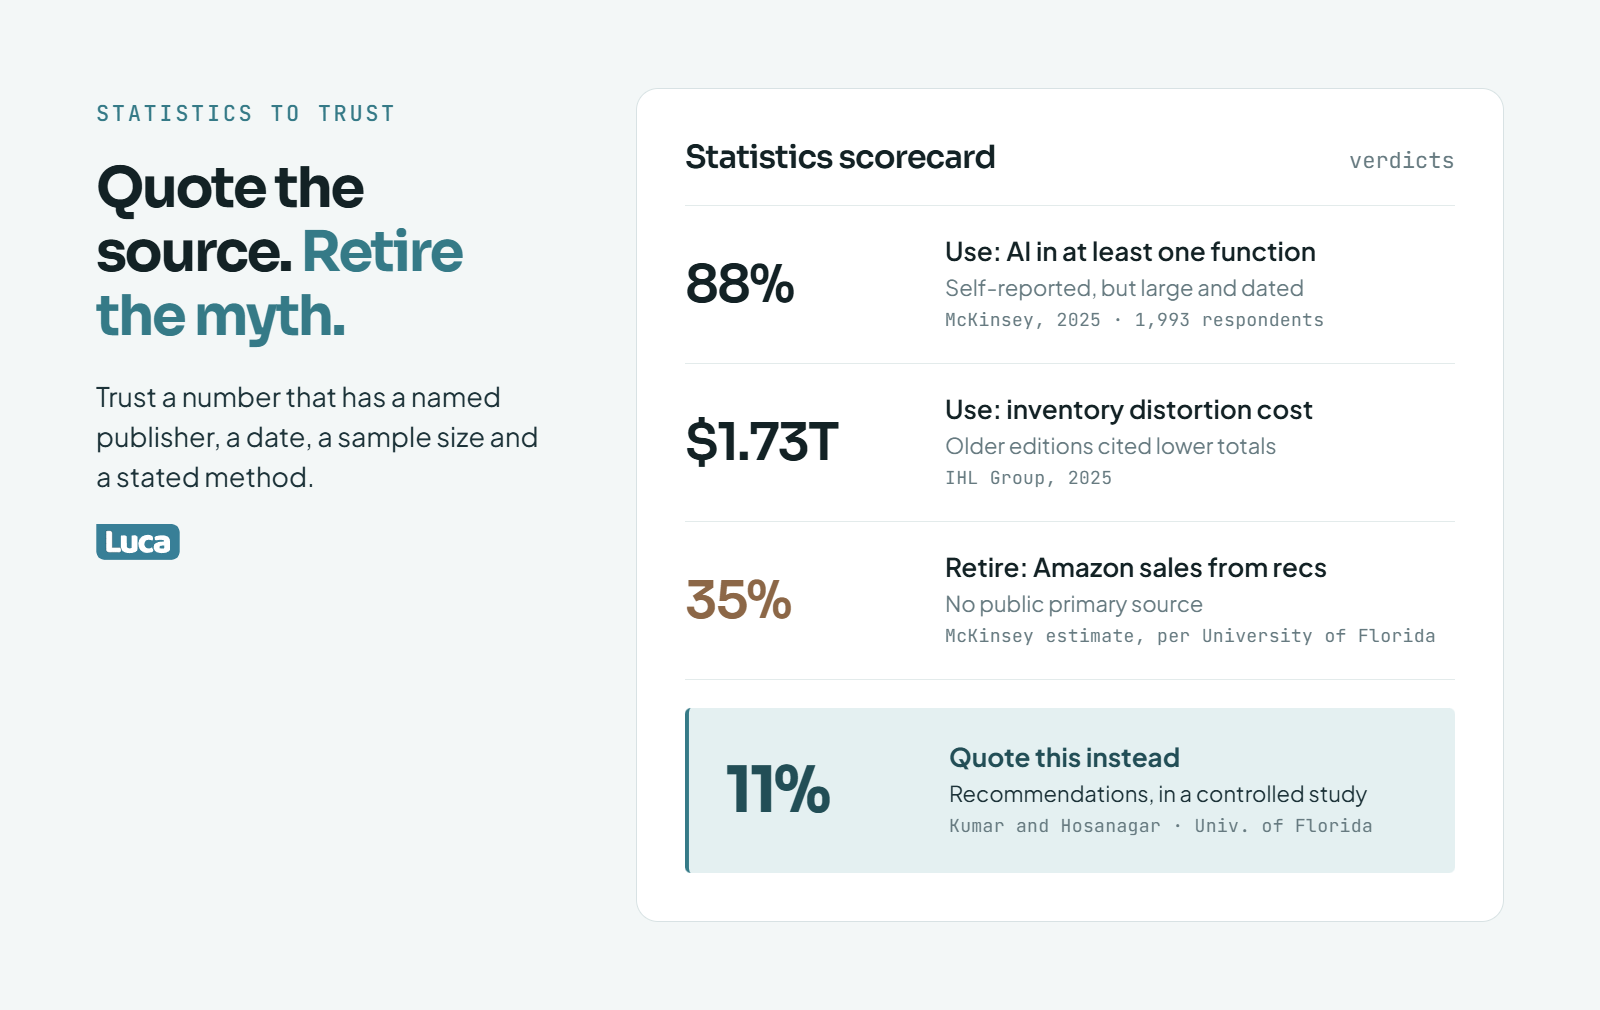
You have probably seen "recommendations drive 35% of Amazon's sales." The University of Florida traced it to a McKinsey estimate, and professor Anuj Kumar said, "These estimates are hard to believe". His controlled study found an 11% sales lift. Quote that instead.
🗂️ Side by side
What big brands predict, and the small-store version
Campbell compares a billion-dollar company to a cargo ship and a smaller brand to a jet ski. The jet ski cannot build Amazon's infrastructure. It can copy the loop. Each example above pairs one prediction with one automatic action.
That is the pattern worth stealing. Pick one prediction you already have, such as Klaviyo's expected date of next order. Then wire it to one action that runs without a meeting.
Luca AI is built around that loop for stores without a data team. Luca AI connects the sources, surfaces the prediction in plain English, and pushes it to Slack or email when it crosses a threshold you set.
What do the predictive analytics examples that worked have in common?
The examples that paid off share three traits: clean, unified data; a prediction tied to one decision; and an action that runs without a meeting. Failed projects usually miss the first or the third. Amperity found 58% of retailers call their customer data fragmented. Luca AI normalizes and standardizes connected data on ingestion, which removes that first failure point before any prediction runs.
🧱 Trait one: the data is unified before the model
Campbell cites Courtheoux's finding that up to 80% of data strategy success comes down to the quality and type of data you have. Every example in this article starts there. Walmart owns its sales history end to end. Netflix owns every play event.
Amperity's survey shows the payoff in numbers. Retailers with a customer data platform were more than twice as likely to report full AI adoption across several business units, 22% against 10% without one (Amperity, 2025). Amperity sells customer data platforms, so read that with care. The direction still matches what operators report.
⏰ What unification costs when you do it by hand
Luke Bean, CEO of Valente, described his brand's move from Klaviyo to Bloomreach in a Luca operator interview. He called it "a really significantly both expensive and difficult migration," done to get "a sort of single point of truth around the customer." It took about six months.
"Shopify has built-in reports you can export, but on the lower-tier plans you only get the basics and you'll need to log in and pull them manually." Reddit user, r/shopify, Reddit Thread
🎯 Trait two: one prediction, one decision
Each winning example answers one question. Will this SKU stock out before the PO lands? Will this customer order again in 30 days? Which item should sit next to this one?
Projects that fail usually predict everything and decide nothing. Anthony Mink, CEO of Live Bearded, described pointing an AI tool at his business data:
"I got like 20 executive summaries that are 25 pages long, and it's like the most interesting intel on my business." Anthony Mink, CEO of Live Bearded, Luca operator interview
His next question was how to actually use any of it. The data was interesting. It was not yet a decision.
🔁 Trait three: the action runs without a meeting
Amazon's recommendations render on the page automatically. Klaviyo's next-order prediction can trigger a flow automatically. Neither waits for someone to read a report on Friday.
❌ The expensive version of getting this wrong
Ari Tulla, CEO of Elo Health, spent heavily on a custom engine and then watched newer models overtake it:
"We spent about $10 million of our money in the company to build a system that is able to take the data and turn it into meaning... LLM come and they are 10 times better than you can be even after spending $10 million." Ari Tulla, CEO of Elo Health, Luca operator interview
Luca AI is designed around those two gaps. Luca AI connects Shopify, Meta, Google, Klaviyo, and accounting data into one place, then pushes insights, recommendations, and alerts to Slack, email, or the app. The prediction reaches the person who acts on it, and that person still makes the call.
Which predictive analytics example should your store start with?
Start where your data is deepest and the decision is most expensive. Below about 500 customers with orders, use RFM segments and reorder points instead of machine learning. Klaviyo's predictive fields need at least 500 customers with orders and 180 days of history. Past roughly 10,000 contacts and several channels, unify the data first, then forecast across sources.
🪜 The three stages
Where to start by store stage
Stage
Data you have
Start with
Skip for now
1. Early
Under 500 customers with orders
RFM segments, reorder points with median lead times, a product quiz
Machine learning personalization, dynamic pricing
2. Growing
500 to about 10,000 customers, 180+ days of orders
Unified data, cross-source demand forecasts, payback by channel, cohort monitoring
Building your own model from scratch
The 10,000 line is a working rule, not a law. Campbell's sources put the threshold anywhere from 1,000 to 100,000 contacts, depending on the business. I use 10,000 because below it, most stores lack enough repeat buyers for a model to beat simple rules.
🌱 Stage 1: rules beat models
At this stage, your best prediction is a well-built segment. Sort customers by recency, frequency, and spend. Email the high-spend, lapsing group first. Set reorder points from median lead times, as in the Q3 example.
Operators on Reddit give the same advice:
"Keep it simple first, use Shopify's built-ins to spot where people drop off, and try basic 'bestsellers/related' blocks before paying for fancy apps." Reddit user, r/ShopifyeCommerce, Reddit Thread
📈 Stage 2: switch on what you already pay for
Most stores at Maya's size already own a churn model in Klaviyo and never use it. Turn on predicted CLV and expected next order. Build one flow from each. Measure against a holdout group for 60 days.
⚠️ A caution on trusting the tool
Before you act on any prediction, check it against what actually happened last quarter. Deb Farnworth-Wood's team at Issada dropped a forecasting feature after about six months because it could not be relied on. Run the comparison yourself before you let a prediction move cash.
Shows the data; the founder still reasons across it
Luca AI
Connected sources, normalized on ingestion; plain-English questions; proactive alerts and scheduled reports
Not an attribution pixel; not built for enterprises with data teams
Luca AI fits stage 2 and stage 3 stores with enough data to reason against. It does not fit stores below the data threshold, and it does not replace an enterprise data team. If you are in stage 1, the rules above will earn you more than any tool.
Which predictive analytics statistics can you trust, and which should you stop quoting?
Quote statistics with a named source, date and sample, and drop recycled claims like the 35% Amazon figure.
Trust statistics with a named publisher, a date, a sample size, and a stated method. McKinsey's 2025 survey of 1,993 respondents and Amperity's 2025 survey of 1,000 retail professionals meet that bar. Retire recycled numbers. The claim that recommendations drive 35% of Amazon's sales traces to a McKinsey estimate that a University of Florida researcher called "hard to believe".
Retire. Quote the 11% controlled-study lift instead.
A 5% retention gain raises profits 25 to 95%
Commonly attributed to Frederick Reichheld of Bain
Use with care. It is decades old, the range is wide, and the attribution varies by source.
💰 Why market size numbers disagree
Grand View Research puts the 2024 market at $18.9 billion. Fortune Business Insights puts 2025 at $22.22 billion. Neither is wrong. They define "predictive analytics" differently, some counting services and some only software. Always quote the firm and the year with the number.
🧾 Numbers from this article's own sources
Some figures here come from Kunle Campbell's E-commerce Growth Strategy and operator interviews, not from public reports. The Bain 12-month payback figure, the Brinks Home results, and the Shein batch sizes all come through that book. They are cited secondhand, and I have labeled them that way.
Vendor case studies, such as the invent.ai, Peak, and Postscript results, are self-reported (Peak). I kept them because they show realistic ranges. I would not put them in a board deck without the caveat.
Luca AI applies the same rule to its own outputs. When you ask Luca AI a question, the answer is built from your connected store data, so you can check the number against Shopify or Klaviyo yourself. A statistic you can trace beats a bigger one you cannot.
Carlos A. Gomez-Uribe and Neil Hunt, "The Netflix Recommender System: Algorithms, Business Value, and Innovation," ACM Transactions on Management Information Systems, 2015. https://dl.acm.org/doi/10.1145/2843948
What are some real examples of predictive analytics in ecommerce?
We group the examples that actually pay off in ecommerce into six use cases. Each one pairs a prediction with a decision that moves cash.
Demand forecasting: unit sales per SKU, which sets reorder points and purchase orders. Walmart does this with an in-house neural network.
Churn and lifetime value: which customers will buy again and what they are worth. Klaviyo calculates predicted CLV and an expected date of next order.
Recommendations and personalization: what each shopper wants next. Netflix credits this with over $1 billion a year in retention value.
Pricing and markdowns: the price that clears stock at the best margin before a season ends.
Marketing payback: which customers and channels earn back their acquisition cost.
Replenishment timing: when a repeat buyer is about to run out, as in 310 Nutrition's SMS flows.
The examples that worked share one trait. The prediction triggers an action automatically, without waiting for a weekly meeting. For the methods behind each one, see our guide to predictive analytics for e-commerce.
How big is the predictive analytics market?
The answer depends on which research firm you ask, because each one defines the market differently. We recommend always quoting the firm and the year together.
Grand View Research valued the global market at $18.9 billion in 2024 and projects $82.3 billion by 2030, a 28.3% compound annual growth rate.
Fortune Business Insights puts the 2025 market at $22.22 billion.
Some firms count only software. Others include services and consulting. That is why two credible reports can disagree by billions of dollars in the same year.
For an ecommerce operator, the exact figure matters less than what it signals. Vendors are investing heavily, so predictive features are showing up inside tools you already pay for, such as Shopify apps and email platforms. The practical question is not whether to buy predictive analytics. It is whether your data is clean enough for the predictions you already own to be right.
Luca AI starts at that layer. Luca AI connects store data and normalizes it on ingestion, so predictions run on one consistent version of the numbers. We cover how to integrate e-commerce data sources in more depth separately.
What percentage of retailers actually use AI and predictive analytics?
Usage is high, but readiness is low. We think that gap is the most important adoption statistic for any store owner.
McKinsey, 2025: 88% of organizations use AI in at least one business function, up from 78% a year earlier. The survey covered 1,993 respondents in 105 countries.
Amperity, 2025: 45% of retailers use AI daily or several times a week, and 97% plan to keep or raise AI spending.
The catch: only 11% of retailers feel fully prepared to deploy AI at scale, and 58% say their customer data is fragmented or incomplete.
Most teams use AI for copy, summaries, and reports. Far fewer have the connected data that predictions need. Amperity also found retailers with a customer data platform were more than twice as likely to report full AI adoption across several business units.
Luca AI sees the same pattern when stores connect their sources: Shopify, Meta, and Klaviyo each count customers and revenue differently. If that sounds familiar, our guide to e-commerce data management walks through what to fix first.
How much data does a Shopify store need before predictive analytics works?
More than most vendors admit. We use a simple three-stage rule based on how many customers have actually ordered.
Under 500 customers with orders: skip machine learning. Use RFM segments (recency, frequency, monetary value) and reorder points based on median supplier lead times.
500 to about 10,000 customers: turn on the predictions you already own. Klaviyo's predictive analytics needs at least 500 customers with orders, 180 days of order history, recent orders, and some customers with three or more orders.
10,000+ contacts across several channels: unify your data first, then forecast across sources and model payback by channel.
The 10,000 line is a working rule, not a law. Sources cited in Kunle Campbell's E-commerce Growth Strategy put the threshold anywhere from 1,000 to 100,000 contacts.
Luca AI fits stores in the second and third stages, where there is enough data to reason against. Below that, simple rules will earn you more than any tool. Our article on e-commerce customer segmentation is a good place to start.
Is it true that recommendations drive 35% of Amazon's sales?
We would stop quoting that number. It traces back to a McKinsey estimate with no public primary source, and it has been repeated in vendor decks for years.
A University of Florida article on the claim quotes professor Anuj Kumar saying, "These estimates are hard to believe." His controlled study with Kartik Hosanagar of Wharton found recommendations increased sales of the recommended products by 9% and overall product sales by 11%. That is a strong result, and it is far more credible.
What Amazon has documented is the method. Greg Linden, Brent Smith, and Jeremy York described item-to-item collaborative filtering in IEEE Internet Computing in 2003. Amazon also holds US Patent 8,615,473 for anticipatory shipping, though a patent is not proof of deployment.
Our rule for any statistic is simple:
Name the publisher and the year.
Check the sample size and method.
Make sure you can reach the original source.
If you are building a board deck, a smaller, sourced number protects your credibility better than a big, recycled one. See how we approach e-commerce reporting for more.
Enjoyed the read? Join our team for a quick 15-minute chat — no pitch, just a real conversation on how we’re rethinking Ecommerce with AI - Luca
Loading Schedule...
Your AI Co-Founder is here.
Here’s why:
Shopify, Meta, Xero - one brain.
"Should I scale?" Answered with real data.
Growth capital. No applications. One click.
Thank you! Your submission has been received! Please book a time slot for the Meeting
Oops! Something went wrong while submitting the form.