10 Best AI-Powered Analytics Tools for Ecommerce in 2026: Chat Interfaces, Autonomous Analysts and Vertical Tools Compared
13
mins read
TL;DR
The ten best AI-powered analytics tools for ecommerce in 2026 are Luca AI, Triple Whale, Polar Analytics, Northbeam, Peel Insights, Glew.io, Daasity, Lebesgue, ThoughtSpot Spotter, and Julius AI.
Tools split into three archetypes: chat interfaces answer what you ask, autonomous analysts investigate unprompted, and vertical dashboards arrive pre-modeled for Shopify data.
Operators report 15% to 25% revenue variance between pixel-based dashboards and Shopify Analytics on identical orders, so pick one platform as your financial source of truth.
Gross margin hides the damage. One operator's 72% gross-margin hero product delivered 8% real contribution margin once shipping, returns, and support cost were allocated.
AI traffic and orders to Shopify storefronts both tripled year over year in Q2 2026, so AI referrals now need their own channel row in reporting.
Buy by GMV band: under $2M start free plus one cheap app, $2M to $20M pair a reasoning layer with one vertical tool, above $20M add warehouse depth.
Q1. What Are the 10 Best AI-Powered Analytics Tools for E-commerce in 2026? [toc=1. Top 10 Tools]
The ten best AI-powered analytics tools for ecommerce in 2026 are Luca AI, Triple Whale (Moby), Polar Analytics, Northbeam, Peel Insights, Glew.io, Daasity, Lebesgue, ThoughtSpot Spotter, and Julius AI. Luca AI ranks first as an AI reasoning layer over your unified store, ad, inventory, and finance data. It finds root cause and pushes scheduled findings to Slack. The rest split across chat interfaces, autonomous analysts, and vertical dashboards.
I tested every tool on this list with one question, the same question, in the same week: "which SKU lost contribution margin last week, and why?" Some tools returned a cause. Most returned a chart. That gap is the whole story of this category in 2026, and it is why I built the ranking around three archetypes instead of feature counts. Below is the shortlist, then the comparison table, then each tool in detail.
Triple Whale - Best for DTC marketing attribution and pixel-based ad reporting
Polar Analytics - Best for Shopify-native reporting without a data team
Northbeam - Best for paid media incrementality and media mix modeling
Peel Insights - Best for cohort and retention analytics
Glew.io - Best for multichannel profitability reporting
Daasity - Best for warehouse-backed data modeling on omnichannel brands
Lebesgue - Best for benchmark-driven marketing audits on small stores
ThoughtSpot - Best for natural language search across an enterprise warehouse
Julius AI - Best for ad hoc analysis on exported files and spreadsheets
The 2026 Comparison Table
10 Best AI-Powered Analytics Tools for E-commerce in 2026
Tool (Rating)
Key Capabilities Offered
Best For
Pricing (per month)
Luca AI ⭐⭐⭐⭐⭐
Unified data layer across commerce, ads, accounting, and ops; plain English questions; root cause analysis; predictive reorder and sales alerts; scheduled push reports to Slack, email, and app
Ecommerce operators at $1M to $5M who need answers, not dashboards
Paid-media-heavy DTC brands optimizing Meta and Google spend
Free tier available, paid plans scale with order volume
Polar Analytics ⭐⭐⭐⭐
Shopify-native metrics, custom dashboards, blended reporting, AI insights layer
Shopify brands wanting fast reporting without engineering
Quote-based
Northbeam ⭐⭐⭐⭐
Multi-touch attribution, media mix modeling, incrementality views
Brands spending heavily across three or more ad channels
Quote-based
Peel Insights ⭐⭐⭐
Cohort analysis, retention and LTV curves, product affinity, automated insights
Subscription and repeat-purchase brands focused on retention
Quote-based
Glew.io ⭐⭐⭐
Multichannel profitability, inventory and product reporting, marketplace connectors
Brands selling across Shopify, Amazon, and retail
Quote-based
Daasity ⭐⭐⭐
Managed ELT, data warehouse modeling, BI templates for ecommerce
Omnichannel brands ready to own a warehouse
Quote-based
Lebesgue ⭐⭐⭐
Marketing audits, competitor and industry benchmarks, AI recommendations
Small stores under $1M validating ad performance
Published app-store tiers, low entry point
ThoughtSpot Spotter ⭐⭐⭐
Natural language search, agentic analytics, warehouse-native governance
Companies with a warehouse and a data team already in place
Quote-based, enterprise contracts
Julius AI ⭐⭐⭐
File and spreadsheet analysis, chart generation, statistical modeling in chat
Analysts running one-off analysis on exports
Published consumer tiers, low entry point
Pricing above reflects what each vendor publishes. Most ecommerce analytics vendors quote against your GMV, so treat any single number you read online as a starting point, not a contract.
1.1 Luca AI [toc=1.1 Luca AI]
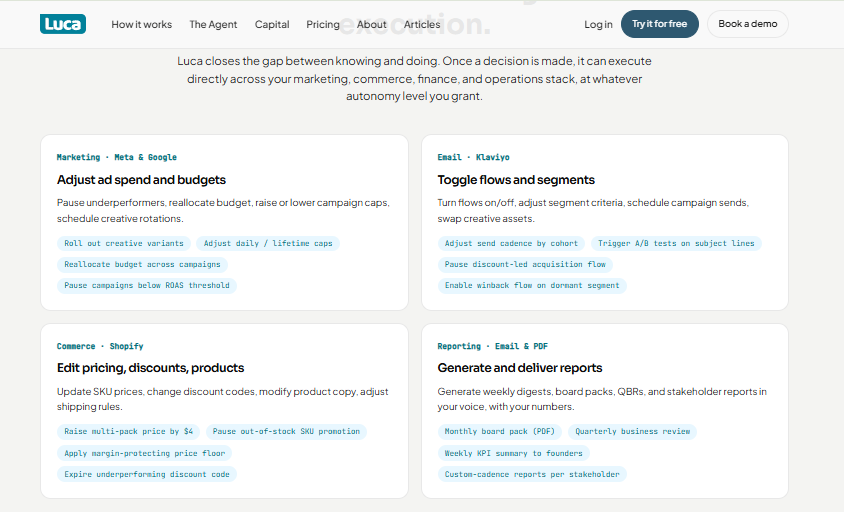
Luca AI executes across marketing, commerce, finance and operations at the autonomy level you grant.
Luca AI is an AI intelligence layer that sits on top of your store's data, connecting commerce, advertising, accounting, banking, and operations sources into one normalized model you can question in plain English.
🤔 Why did we choose this tool?
I am the co-founder of Luca AI, so I will be direct about the conflict and direct about the reason. I put Luca first because it is the only tool on this list that reasons across functions instead of inside one channel. Most tools on this list answer marketing questions well. Luca AI answers business questions: why margin moved, which cost line caused it, what happens if you scale, and what to do next. It also normalizes data on ingestion, so you skip the cleanup year that reverse ETL projects demand.
📊 Solutions Offered
Data coverage: 200+ native connectors across Shopify, Meta, Google, Klaviyo, Xero, QuickBooks, banking, and 3PL, which removes most manual ecommerce data integration work
Query method: Plain English chat, no SQL, no analyst, no dashboard building
Autonomous monitoring: 24/7 scans that ping you on ROAS dips, CAC spikes, and inventory thresholds
Report delivery: Scheduled reports with graphs and reasoning pushed to Slack, email, or mobile
Analysis depth: Root cause analysis, cohort work, predictive reorder, and sales forecasting
✅ Best for
Ecommerce operators between $1M and $5M revenue sitting on unused data
Teams with no data analyst and no appetite for a warehouse project
Founders who want the finding delivered to them rather than logging in to look for it
⚠️ Not the right fit for
Enterprises that already run a data team and a modeled warehouse
Stores too early to have enough history to reason against
Anyone shopping for an attribution pixel, since Luca AI does not replace one
💰 Pricing
[ Starter: €299 / Month | Growth: €499 / Month | Scale: Custom Pricing ]. Full plan details sit on the Luca AI pricing page.
📈 Case Study: A Home Goods Brand at Roughly $3M
What was the problem? A European home goods brand selling across Shopify and one marketplace could not explain a quiet profit slide. Revenue was flat, ad spend was steady, and the founder was reconciling exports from four systems every Sunday night to find the leak.
How did Luca AI help? Luca AI connected Shopify, Meta, Google, the accounting ledger, and the 3PL feed, then normalized them into one model. Asked why contribution margin fell, it traced the drop to a single product family where return rate and per-order shipping cost had both crept up, quietly outrunning a mid-tier margin.
What was the outcome? The brand repriced that family, pulled it from a discount bundle, and moved spend toward two SKUs with healthier unburdened margin. The Sunday reconciliation ritual was replaced with a Monday morning Slack report carrying the same numbers plus the reasoning, which is the shift from manual work to automated ecommerce reporting. 💸
1.2 Triple Whale (Moby) [toc=1.2 Triple Whale]
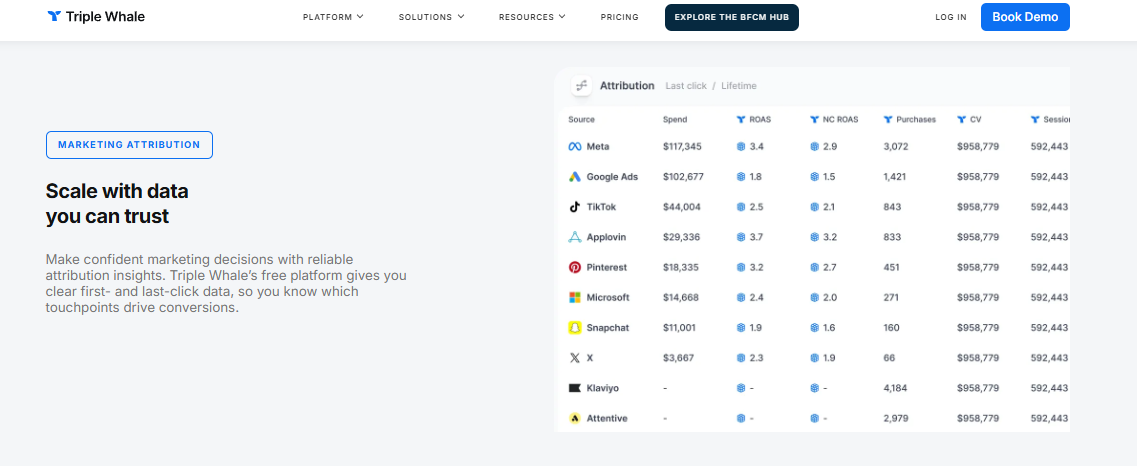
Triple Whale reports first and last-click channel attribution across Meta, Google, TikTok and more.
Triple Whale is the default attribution dashboard for paid-media-heavy DTC brands, built on its own first-party Triple Pixel, with Moby as its chat and agent layer for automated marketing analysis.
🐋 Why did we choose this tool?
Triple Whale earned its place because nothing else on this list collects first-party ad data as aggressively. If your day is spent inside Meta and Google, the blended view is genuinely useful, and Moby agents will run scheduled marketing analysis without you asking. It holds a 4.4 out of 5 average across more than 350 G2 reviews, which is a real signal from real operators.
The honest limit is architectural, not cosmetic. Triple Whale sees commerce and marketing. It does not connect to your accounting ledger or banking, so it cannot tell you what a budget reallocation does to your cash position. Users also report attribution figures diverging from Shopify totals, with variance in the range of 15% to 25% on the same orders, and marketplace or offline sales landing in paid channels. If that gap is your blocker, the fuller list of Triple Whale alternatives covers the trade-offs in detail.
📊 Solutions Offered
Data coverage: Shopify plus major ad platforms via Triple Pixel and native connectors
Query method: Moby chat and scheduled Moby agents for marketing questions
Autonomous monitoring: Anomaly alerts on marketing metrics
Report delivery: In-app dashboards, summaries, and scheduled agent outputs
Analysis depth: Multi-touch attribution, media mix modeling, and creative performance
✅ Best for
DTC brands spending meaningfully on Meta and Google every day
Growth leads who need one blended ad view instead of three ad managers
Teams that already treat Shopify, not the dashboard, as the financial source of truth
⚠️ Not the right fit for
Finance leads who need P&L, cash flow, or working capital visibility, which is closer to ecommerce cash flow forecasting territory
Brands where marketplace and offline revenue is a large share of orders
Operators unwilling to reconcile dashboard totals against platform totals monthly
💬 Reviews
"We utilize Triple Whale and I highly endorse it!" — u/Prestigious_Row_4022, r/shopify Reddit Thread
"The biggest challenge is that it can take some time to get comfortable with all the features and customize dashboards to match specific needs. The pricing can also feel high, especially for smaller teams." — Verified reviewer, E-commerce Growth Triple Whale - G2 Verified Review
💰 Pricing
Free tier available, with paid plans priced against order volume. Operators reported increases of 30% to 50% during the 2024 pricing change, so ask for the renewal curve before you commit.
Luca AI takes a different starting point than an attribution dashboard: it normalizes commerce, ad, accounting, and operations data on ingestion, then answers why a number moved rather than only reporting that it did. That is the reason it sits at position one on a list where I have an obvious interest, and the reason the next eight entries are judged on the same axis. The Luca AI use cases page shows the same reasoning applied across marketing, inventory, and profit questions.
1.3 Polar Analytics [toc=1.3 Polar Analytics]
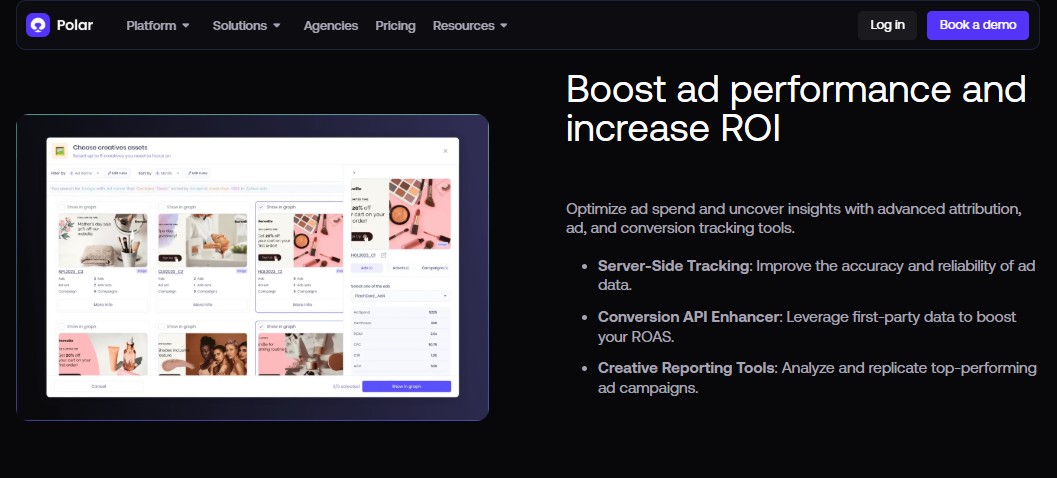
Polar Analytics focuses on ad performance, server-side tracking and creative reporting for Shopify brands.
Polar Analytics is a Shopify-native reporting platform that centralizes store, ad, and email data into custom dashboards, with an AI assistant for plain English questions.
🧭 Why did we choose this tool?
Polar earns its spot on setup speed and support quality. Operators consistently say they got dashboards running without a developer, and the LTV and cohort modeling is genuinely strong. It carries a 4.6 to 4.8 rating on G2 across roughly 21 to 30 reviews, depending on the snapshot you pull.
The trade-off is cost and depth. Third-party reviewers put entry pricing between $470 and $720 per month, priced against GMV. Reviewers also flag that it lacks product-level profitability, so SKU margin work still happens elsewhere. If that gap decides your shortlist, the deeper breakdown of Polar Analytics alternatives walks through each option.
📊 Solutions Offered
Data coverage: Shopify, Amazon, major ad platforms, Klaviyo, and 45+ native connectors
Query method: Custom dashboards plus an AI assistant for natural language queries
Autonomous monitoring: Metric alerts and scheduled report delivery
Report delivery: In-app dashboards, email, and Slack summaries
Analysis depth: Blended CAC, cohort LTV, and pixel-enriched attribution
✅ Best for
Shopify brands past $2M GMV that want reporting without hiring an analyst
Growth teams that will actually invest a week in configuring custom metrics
Brands whose main question is channel efficiency, not product-level margin
⚠️ Not the right fit for
Early-stage stores, since there is no free tier to test with
Anyone who needs non-standard connectors without paid support help
💬 Reviews
"Powerful out of the box insights, no tech skills needed. Can connect all data sources without extra costs." — Verified reviewer, Growth Lead Polar Analytics - G2 Verified Review
"Slow to load sometimes between views and reports. Limited reports on mobile. Expensive." — Verified reviewer, Ecommerce Manager Polar Analytics - G2 Verified Review
💰 Pricing
Quote-based, with third-party reviewers reporting entry points around $470 to $720 per month and GMV-tiered increases from there.
1.4 Northbeam [toc=1.4 Northbeam]
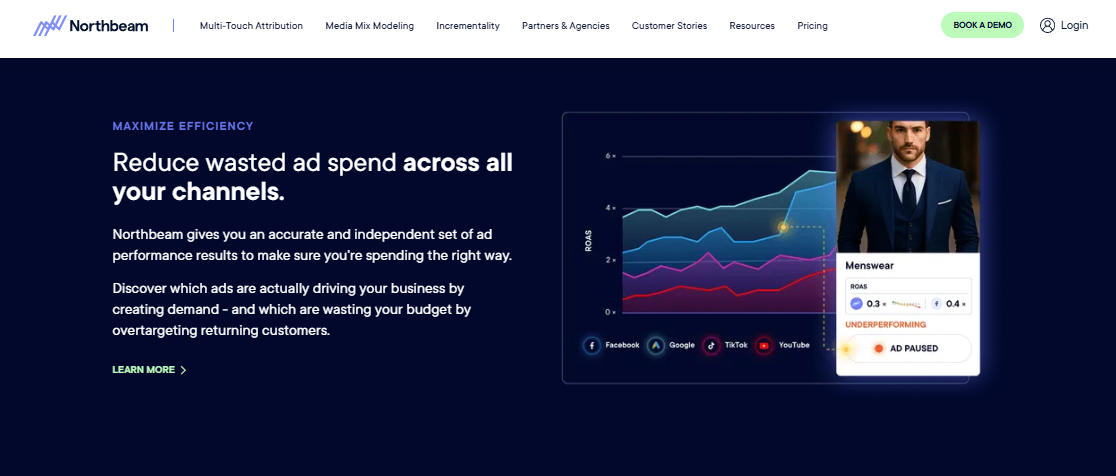
Northbeam gives independent ad performance results to reduce wasted spend across every paid channel.
Northbeam is a paid media measurement platform built on multi-touch attribution and media mix modeling, aimed at brands running spend across several channels at once.
🎯 Why did we choose this tool?
Northbeam is the tool agencies reach for when platform-reported numbers stop being believable. Reviewers praise data accuracy and the ability to see past platform bias, which is the whole point of independent measurement.
It is also the heaviest lift on this half of the list. G2 reviewers describe a lot of data and customization to absorb before it becomes useful. Attribution is modeled, not counted, so treat its output as directional and reconcile revenue against your platform totals, which is the same discipline behind declining platform ROAS versus true profitability.
📊 Solutions Offered
Data coverage: Shopify and major ad platforms via first-party tracking
Query method: Dashboards, saved views, and custom reporting
Autonomous monitoring: Performance alerts on media metrics
Report delivery: In-app reports and scheduled exports
Analysis depth: Multi-touch attribution, media mix modeling, and incrementality views
✅ Best for
Brands spending across three or more paid channels every day
Agencies managing measurement for multiple client accounts
Teams with someone whose actual job is media measurement
⚠️ Not the right fit for
Founders who need finance, inventory, or cash visibility
Small stores running one channel, where the complexity outweighs the gain
Teams expecting numbers to match Shopify exactly out of the box
💬 Reviews
"The accuracy of the data. Myslef and my clients are confident we're seeing what's really driving performance for their business." — Verified reviewer, Agency Media Buyer Northbeam - G2 Verified Review
"It can feel overwhelming at first because there's so much data and customization. It takes some time to get fully comfortable with the platform." — Verified reviewer, Performance Marketer Northbeam - G2 Verified Review
💰 Pricing
Quote-based, scaled against ad spend and data volume.
1.5 Peel Insights [toc=1.5 Peel Insights]
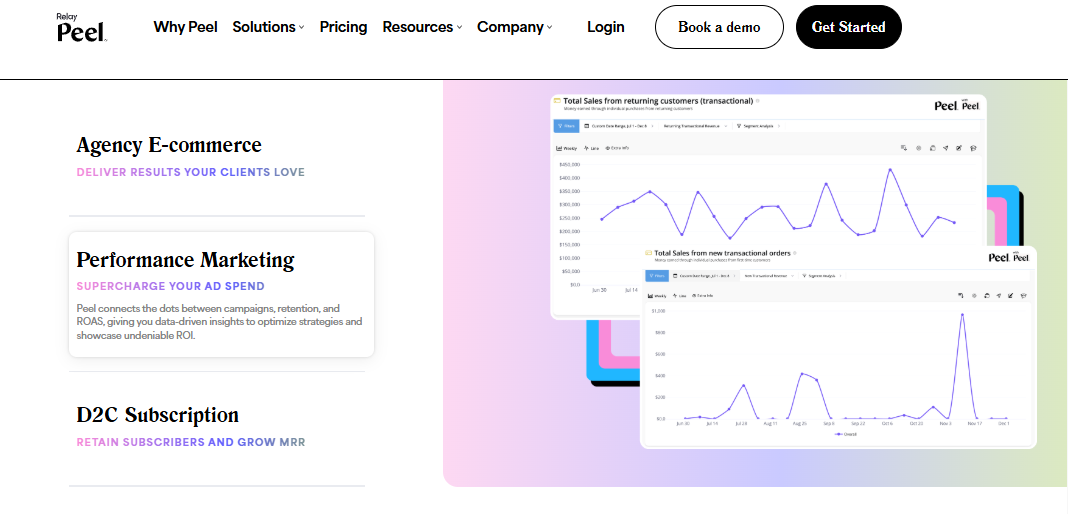
Peel Insights connects campaigns, retention and ROAS through cohort and subscription analytics for DTC brands.
Peel Insights is a retention analytics platform for Shopify and Amazon brands, running monthly cohort breakdowns across more than 30 retention and LTV metrics.
🔁 Why did we choose this tool?
Peel does one job better than anything else here: cohorts. It offers 30+ cohort KPIs filtered by channel, product, and campaign, and dashboards populate within about 24 hours of connecting, with historical backfill and no pixel work.
It holds a perfect 5.0 average across 34 Shopify App Store reviews, which is rare and worth a small grain of salt in a curated review environment. Attribution is not its strength, and it expects real order volume before it earns its price. For the wider retention picture, our guide to ecommerce customer lifetime value covers the metrics behind these cohorts.
📊 Solutions Offered
Data coverage: Shopify, Amazon, Meta, Google, TikTok, and Pinterest
Query method: Prebuilt cohort dashboards and filters
Autonomous monitoring: Automated insight summaries on retention shifts
Report delivery: Scheduled email and Slack digests
Subscription and repeat-purchase brands where retention drives the P&L
Brands above roughly 6,000 monthly orders, which is the practical volume floor
Teams that want cohort work without building a single dashboard
⚠️ Not the right fit for
Early-stage stores below the order volume threshold
Brands where Snapchat or niche networks carry real spend
Anyone buying it as their primary attribution tool
💬 Reviews
"Fantastic app for cohort analysis. The on-boarding process is really smooth, and their team is super responsive and helpful if you have and queries." — Shopify merchant, Store Owner Peel Insights - Shopify App Store Verified Review
"I used this app to get LTV and cohort data which comes standard. My only problem so far is that I can't exclude data when it's impacting the averages." — Shopify merchant, Store Owner Peel Insights - Shopify App Store Verified Review
💰 Pricing
Reported by independent reviewers at roughly $179 per month at entry, rising to the $449 to $899 range on higher tiers.
1.6 Glew.io [toc=1.6 Glew]
Glew.io is a multichannel business intelligence platform for retailers, pulling sales, product, inventory, and marketplace data into prebuilt reports and dashboards.
🛒 Why did we choose this tool?
Glew is the practical pick for brands whose platform reporting is genuinely thin, especially on BigCommerce and marketplace setups. Reviewers credit it with making sales, revenue, order, and product reporting possible where the native platform could not. It holds a 4.0 average across 57 G2 reviews.
The gaps are speed and setup docs. Users mention 10 to 20 second load times when reports compile, and initial setup documentation that thins out on custom connectors. Brands weighing a switch usually start with the comparison of Glew alternatives.
📊 Solutions Offered
Data coverage: Shopify, BigCommerce, marketplaces, ad platforms, and ERP feeds
Query method: Prebuilt report library and dashboard builder
Autonomous monitoring: Scheduled report triggers and segment alerts
Report delivery: Emailed reports and shared dashboards
Analysis depth: Product and channel profitability, inventory, and customer segmentation
✅ Best for
Brands selling across Shopify, Amazon, and physical retail at once, where ecommerce omnichannel analytics becomes the core requirement
Retailers whose ecommerce platform reporting is genuinely limited
Ops and merchandising teams that live in product-level reports
⚠️ Not the right fit for
Teams wanting conversational analysis rather than report navigation
Brands needing custom connectors without hands-on setup support
Users who expect instant load times on heavy compiled reports
💬 Reviews
"I like Glew because it makes reporting on sales, revenue, orders, or products sold possible, which BigCommerce lacks." — Verified reviewer, Ecommerce Director Glew - G2 Verified Review
"Sometimes the data takes 10-20 seconds to load, when it compiles its the only frustration we have." — Verified reviewer, Retail Operations Glew - G2 Verified Review
💰 Pricing
Quote-based, tiered by connectors and data volume.
1.7 Daasity [toc=1.7 Daasity]
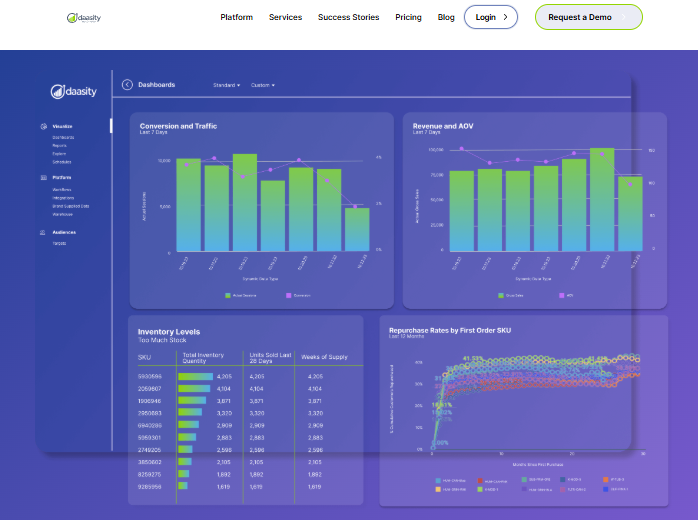
Daasity models warehouse data into conversion, inventory and repurchase dashboards for omnichannel brands.
Daasity is a managed data platform that extracts, models, and loads ecommerce data into a warehouse, then layers BI templates and analyst support on top.
🏗️ Why did we choose this tool?
Daasity is the honest answer for brands that have outgrown app-level reporting and are ready to own a warehouse. Reviewers describe combining scattered platform data into one comprehensive business view, with prebuilt reports plus the option of custom report suites and agency help. It carries a 4.7 average on G2, though across a small review base of about 12.
The known friction is a steep learning curve and refresh timing. One reviewer notes some channels still need manual entry, and that reports refresh overnight rather than in real time. Teams comparing that model against a managed layer usually review the Daasity alternatives first.
📊 Solutions Offered
Data coverage: Commerce, ads, email, retail, and ERP sources into your warehouse
Query method: BI tools on top of modeled data, plus SQL for analysts
Autonomous monitoring: Exception reporting on operational KPIs
Report delivery: Scheduled BI dashboards and email reports
Analysis depth: Modeled marketing, customer, and operational analytics
✅ Best for
Omnichannel brands with wholesale, retail, and DTC in the same P&L
Teams that already have or want a warehouse they control
Companies with at least part-time analyst capacity in house
⚠️ Not the right fit for
Founders who want answers this week, not a modeling project
Teams that need real-time refresh rather than overnight
Brands with unusual channels that lack automated connectors, where ecommerce API integrations become a build task
💬 Reviews
"With daasity, I'm able to get critical insights and answers to how our business is performing." — Verified reviewer, Data Lead Daasity - G2 Verified Review
"There are a few platforms that are not yet automated (we market in a few unique channels), so at times there is manual entry to create an overall marketing performance." — Verified reviewer, Marketing Analyst Daasity - G2 Verified Review
💰 Pricing
Quote-based, priced by data sources, modeling scope, and support level.
1.8 Lebesgue [toc=1.8 Lebesgue]
Lebesgue is a Shopify app that audits marketing performance, models LTV and churn, and benchmarks your ads against industry and competitor data using AI recommendations.
🧮 Why did we choose this tool?
Lebesgue is the cheapest useful entry point on this list. It holds a 4.9 rating across 120 Shopify App Store reviews, with a free plan available and paid tiers starting near $19 per month. Merchants describe getting analytics and recommendations in one dashboard, plus competitor visibility they cannot get natively.
The honest limits are platform scope and category-wide attribution skepticism. Capterra reviewers want feature parity beyond Shopify, and operators broadly distrust any tool that claims to know where signups came from. Brands outgrowing it typically move through the Lebesgue alternatives list.
📊 Solutions Offered
Data coverage: Shopify, WooCommerce, Meta, Google, TikTok, and competitor data
Query method: Guided dashboards with AI-generated recommendations
Autonomous monitoring: Automated marketing audits and mistake alerts
Report delivery: In-app insights and email digests
Analysis depth: LTV, churn, retention, ad audits, and industry benchmarks
✅ Best for
Stores under $1M that need a sanity check on ad performance
Solo operators without budget for a premium analytics contract
Brands wanting competitor and category benchmarks alongside their own data
⚠️ Not the right fit for
Non-Shopify-centric businesses wanting the same depth elsewhere
Brands needing finance, inventory, or cash flow reasoning
Teams that treat modeled attribution as gospel
💬 Reviews
"Super useful! I was impressed with the analytics and recommendations I found in the dashboard. I've tested out other similar tools and definitely Lebesgue to be the most comprehensive and helpful." — Shopify merchant, Store Owner Lebesgue - Shopify App Store Verified Review
"Too much centered on shopify. I would like to see the same features for other platforms such as Wordpress." — Verified reviewer, Marketing Manager Lebesgue - Capterra Verified Review
💰 Pricing
Free plan available, with paid tiers reported from around $19 per month.
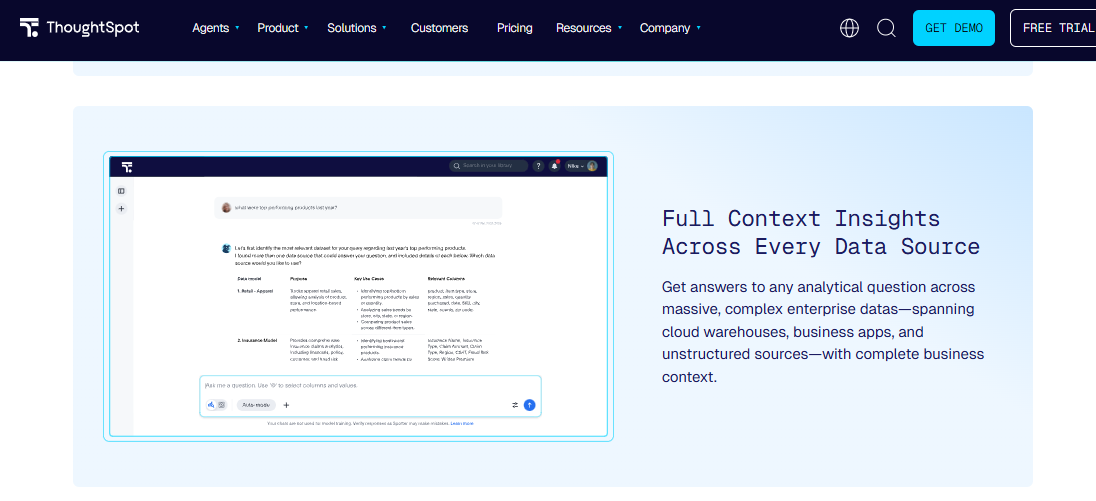
ThoughtSpot Spotter answers analytical questions across warehouses, apps and unstructured enterprise data sources.
ThoughtSpot is a search-first analytics platform with Spotter as its agentic layer, letting users ask questions in natural language against a governed data warehouse.
🔍 Why did we choose this tool?
ThoughtSpot belongs here as the enterprise benchmark for natural language analytics. Reviewers credit it with letting people explore data without waiting on someone to write a query, and it holds a 4.4 average across roughly 316 to 340 G2 reviews.
It is also the least suited to a lean ecommerce team. The most common G2 complaints are a steep learning curve (24 reviews), missing features and customization limits (15 reviews), and pricing that climbs with query consumption (7 reviews). Several reviewers had to build every metric in dbt first, which is the exact overhead that conversational analytics tools built for commerce data avoid.
📊 Solutions Offered
Data coverage: Cloud warehouses including Snowflake, BigQuery, Databricks, and Redshift
Query method: Natural language search plus Spotter agentic follow-ups
Autonomous monitoring: Change analysis and automated anomaly detection
Report delivery: Liveboards, scheduled subscriptions, and embedded views
Analysis depth: Governed metrics, drill-down, and root cause style change analysis
✅ Best for
Companies that already run a modeled warehouse and a data team
Enterprises needing governance, permissions, and audit trails
Organizations embedding analytics into their own product
⚠️ Not the right fit for
Ecommerce operators without a warehouse or an analyst
Teams that need ecommerce metrics defined out of the box
Budgets that cannot absorb consumption-based pricing growth
💬 Reviews
"ThoughtSpot has empowered us with solid data dynamics that have enhanced firm decision making." — Verified reviewer, Business Analyst ThoughtSpot - G2 Verified Review
"I think it's very difficult to learn how to use ThoughtSpot. It takes a long time to really learn it, and I'm still not even close to where I want to" — Verified reviewer, Data Team Member ThoughtSpot - G2 Verified Review
💰 Pricing
Quote-based enterprise contracts, with G2 reviewers noting costs rise as query consumption increases.
1.10 Julius AI [toc=1.10 Julius AI]
Julius AI is a chat-based analysis tool that reads uploaded files or connected databases, writes code behind the scenes, and returns charts and statistical output in conversation.
💬 Why did we choose this tool?
Julius is the fastest way to interrogate a CSV you exported five minutes ago. For quick exploration and chart generation, it is genuinely good, and it sits around 4.5 on G2 with a large consumer user base.
The reasons it sits last are real and documented. Because it generates fresh code per query, the same question on the same data can return different results between runs. Reviewers also report it occasionally analyzing invented data, no live dashboards, and database connectors that were added after the file-first design, which is the trade-off explored in ChatGPT for ecommerce data analysis.
📊 Solutions Offered
Data coverage: CSV, Excel, and Google Sheets uploads, plus database connectors on higher tiers
Query method: Chat prompts that generate and run analysis code
Autonomous monitoring: None, analysis is session-based
Report delivery: Exports from the active session only
Analysis depth: Charts, aggregation, regression, and statistical modeling
✅ Best for
Analysts running one-off questions on an export
Founders who want a fast chart from a file, not a reporting system
Anyone testing a hypothesis before committing to a real platform
⚠️ Not the right fit for
Recurring reporting, since there are no live dashboards or scheduled refreshes
Any number that lands in a board deck without manual verification
Teams needing connected, always-current ecommerce data
💬 Reviews
"A significant limitation of Julius is its initial design for CSV files only, which is quite limiting. Although SQL support has recently been introduced, it falls short because it requires a deep understanding of your database." — u/Comfortable-Aioli730, r/datascience Reddit Thread
💰 Pricing
Free tier limited to roughly 5 to 15 messages per month, with paid consumer and team tiers above that.
Luca AI sits at the top of this list for one structural reason the other nine share in reverse: every tool above solves a slice, whether that slice is attribution, cohorts, warehouse modeling, or file analysis. Our pilot deployments consistently show the expensive question is the cross-functional one, and that is the question a single-slice tool cannot answer no matter how good its dashboard looks. If you want to see how that reasoning runs on your own store, the Luca AI use cases page is the shortest path in.
Q2. How Did We Score and Rank These 10 Tools? [toc=2. Scoring Methodology]
Every tool was scored across five weighted criteria: Cross-Functional Reasoning Depth (25%), Data Coverage and Connectors (20%), Explainability and Auditability (20%), Setup and Usability (20%), and Verified User Reviews (15%). Scores convert to stars in 20-point bands, so the lowest band earns one star and the highest earns five. Vertical dashboards mostly landed at three or four stars.
The Conflict, Stated First
I co-founded Luca AI, which appears at position one on this list. You should factor that in when you read the ranking.
What I can offer instead of neutrality is a published method. Every weight below is defensible, every tool faced the same questions, and the failure conditions are written down before the results.
⚖️ Why These Five Weights
Scoring Criteria and Weights for AI-Powered Analytics Tools
Criterion
Weight
Why it carries this much
Cross-Functional Reasoning Depth
25%
Most expensive questions span marketing, inventory, and finance at once
Data Coverage and Connectors
20%
A missing source makes every cross-functional answer quietly wrong
Explainability and Auditability
20%
GoodData names hallucination prevention and explainability as core enterprise criteria
Setup and Usability
20%
A tool needing a modeling project costs months you do not have
Verified User Reviews
15%
Real operator complaints predict renewal pain better than feature lists
Reasoning depth carries the most weight because siloed accuracy is worthless when the answer lives across three systems. Holistics frames platform quality around semantic depth and governance, not feature count, and I think that framing is correct. That framing also shapes how we compare ecommerce analytics platforms at every price point.
The Standing Prompt Set
🧪 Four Questions, Every Tool
Each tool got the same four prompts, in the same order, on live store data:
Which SKU lost contribution margin last week, and why?
Show me the data and calculation behind that answer.
What happens to cash in 90 days if I scale my best campaign 40%?
Tell me something about this business I did not ask about.
Question two is the one that separated the field. A tool that answers question one but fails question two is guessing with confidence, and that is worse than silence.
Luca AI measures reasoning depth by whether the system can trace a moved metric back to the component costs and channels that moved it, not by whether it produces a chart. That standard comes straight from our framework for evaluating AI data agents.
❌ The Two Automatic Deductions
Two failures cost a tool a full star, regardless of everything else.
The first is unexplainable output. If a tool will not surface the underlying rows, filters, and assumptions, it cannot be trusted with a budget decision.
The second is a missing core connector. If ad spend is in and accounting is out, the tool cannot answer a margin question honestly, no matter how good the interface looks. That is a ecommerce data integration problem before it is an AI problem.
🔍 What Star Bands Actually Mean
Bands are simple. The lowest 20-point band earns one star, and each additional band adds one, so the top band earns five.
Three stars means the tool does its narrow job well. Four means it does that job well and plays nicely with the rest of your stack. Five requires reasoning across functions plus a visible audit trail.
I will flag my own uncertainty here. The review weight at 15% may be too low, because operator complaints about pricing renewals and attribution drift proved more predictive than I expected when I ran this exercise.
Luca AI is the only tool on this list scored by its own makers, which is why every claim about it in this article points to a behaviour you can reproduce inside a trial: connect two sources, ask question one, then ask question two. Plan details sit on the Luca AI pricing page if you want the cost side before you test.
Q3. Chat Interface, Autonomous Analyst or Vertical Dashboard: What Actually Separates Them? [toc=3. Archetypes Explained]
AI-powered analytics tools turn plain-language questions into queries and explanations over your business data. Three archetypes exist: chat interfaces answer what you think to ask, autonomous analysts investigate and alert unprompted, and vertical dashboards arrive pre-modeled for Shopify and marketplace data. A BI copilot is none of these. It is a natural language box over a dashboard someone already built.
The Three Archetypes, Defined Plainly
A chat interface waits for your question. An autonomous analyst watches your data and starts the conversation. A vertical dashboard ships with ecommerce metrics already defined, so you skip the modeling.
Holistics defines this category as a BI tool that uses language models so users query in plain English instead of writing SQL. That definition is accurate, and it is also the ceiling for most tools on the market. Our deeper breakdown of conversational analytics tools covers where that ceiling sits.
🎯 One Question, Three Different Answers
Ask all three: "why did contribution margin drop on my hero SKU last week?"
The chat interface returns a margin chart and waits for your next prompt. The vertical dashboard shows the margin decline against last month, correctly, with no cause attached.
The autonomous analyst names the cause: return rate rose in one variant while per-order shipping cost crept up, and both landed on a mid-tier margin product. Ask Luca AI that question and the answer arrives in that third shape, with the component costs listed.
Why Data Structure Beats Model Choice
🧱 The Modeling Layer Nobody Sells You
Answer quality tracks how your data is structured far more than which model sits underneath. This is the uncomfortable part of the category.
GoodData builds its entire evaluation around semantic control and hallucination prevention for exactly this reason. If "revenue" means three different things across Shopify, Stripe, and your ledger, no model resolves that for you.
Luca AI normalizes and standardizes data on ingestion rather than at the reporting stage, which is what removes the cleanup year that reverse ETL tools for ecommerce usually demand. We built it that way because operators kept telling us the modeling backlog, not the interface, was the thing that killed their last analytics purchase.
⚠️ The Honest Failure Mode of Each
Each archetype breaks in a predictable way:
Chat interfaces answer confidently on questions you framed badly, since they cannot tell you what you should have asked.
Autonomous analysts generate noise if thresholds are set loosely, and alert fatigue kills adoption in about three weeks.
Vertical dashboards report accurately and explain nothing, which leaves you doing the causal work by hand.
BI copilots inherit every flaw of the dashboard they sit on, including metrics defined by someone who left the company.
The Takeaway Frame
🚗 Windshield, Dashboard, GPS
Think about the car. Your vision is the windshield, your metrics are the dashboard, and prescriptive reasoning is the GPS.
Dashboards tell you your speed. They do not tell you the turn. One operator I spoke with put it sharply: the pretty browser view is not the point, since the data exists so the reasoning layer can draw the conclusion and tell you what matters.
That is the real 2026 split. Not chat versus dashboard, but monitoring versus recommending. If you scroll to find the problem, you own the analysis. If the tool names the problem, it owns it. That shift is the whole argument behind agentic analytics tools.
Luca AI is an AI reasoning layer over a unified data layer rather than a chat box over a dashboard, which is why it can trace a metric back to the components that moved it. That distinction is the one worth testing in a trial, and it takes about ten minutes to test.
Q4. How Do You Know an AI Analyst's Answer Is Right? [toc=4. Accuracy and Auditability]
Post-iOS 14.5 attribution is modeled rather than counted, so pixel-based tools estimate conversions. Operators report 15% to 25% revenue variance against Shopify Analytics on identical orders, plus marketplace and offline sales misassigned to paid channels. Trust a tool only if it shows the data it queried, the calculation it ran, and the assumptions it made. Then reconcile one week manually before you rely on it.
The Receipts
💬 What Operators Actually Report
"Data inaccuracy" sits among the top recurring cons across more than 350 G2 reviews of one major attribution platform. That is not a fringe complaint.
"The biggest challenge is that it can take some time to get comfortable with all the features and customize dashboards to match specific needs. The pricing can also feel high, especially for smaller teams." — Verified reviewer, E-commerce Growth Triple Whale - G2 Verified Review
"We utilize Triple Whale and I highly endorse it!" — u/Prestigious_Row_4022, r/shopify Reddit Thread
Both quotes are true at once, which is the point. A tool can be genuinely useful for media buying and still hand your CFO numbers that do not reconcile. If that is your situation, the comparison of Triple Whale alternatives lays out the trade-offs.
🔧 Why the Gap Exists
Three mechanics cause most of it. Post-iOS 14.5 signal loss forces probabilistic modeling, so conversions are estimated. Order-source mapping then pushes marketplace and offline sales into paid channels. Third-party reviewers have documented divergences in the 15% to 25% band, including one reported case of a dashboard showing $84K against Shopify's $71K.
Luca AI normalizes and standardizes data on ingestion rather than at the reporting layer, so totals reconcile to your platform numbers instead of drifting across the month. That is an architectural choice, not a feature, and it is testable in a trial.
The Four-Step Audit
⏰ Twenty Minutes That Save a Quarter
Run this inside any free trial:
Pick one closed week and pull revenue from your platform first.
Ask the tool for the same week, then ask it to show the query and source rows.
Ask it to isolate marketplace and offline orders separately.
Ask the same question twice, an hour apart, and compare the two answers.
Step four catches non-deterministic tools. Julius AI users report that regenerated analysis can return different results between runs, because fresh code is written each time.
Ask Luca AI for the calculation behind any number and it returns the underlying rows and filters, which is the specific behaviour this audit is designed to test for.
📉 From Attribution Claims to Incrementality
The measurement conversation moved this year. On the Andrew Faris Podcast, Olivia Kory of Haus presented data showing incremental attribution outperforming standard attribution on Meta.
My read is that this is the right direction, though I might be leaning on it harder than the evidence supports yet. Incrementality tests cost money and time, so they realistically start above roughly $10M in spend maturity. Below that, the higher-leverage work is usually fixing declining platform ROAS versus true profitability.
✅ Setting Your Variance Threshold
Pick one number as your financial source of truth, and make it the platform, not the dashboard. Then define an acceptable variance in writing, because an undefined threshold means every discrepancy becomes an argument.
Under 5% variance is normal modeling noise. Between 5% and 15% needs a documented reason. Above 15%, stop using that tool for cash decisions until you find the mapping error. Anything feeding ecommerce cash flow forecasting deserves that discipline.
Do not let the AI be the QA. That is the rule I would keep even if it slowed us down.
Luca AI reconciles on ingestion and shows its working on request, so the audit above is not a gotcha we avoid. It is the test we would rather you run before you sign anything, ours included.
Q5. Which Data Sources Must Your Analytics Layer Cover in 2026? [toc=5. Data Coverage and Delivery]
A usable analytics layer needs your storefront, Meta and Google ads, Klaviyo, marketplace data, 3PL or inventory, and your accounting system. Miss one and every cross-functional answer is wrong. Add one 2026 requirement: AI-referred traffic. AI traffic and orders to Shopify storefronts both tripled year over year in Q2 2026, so tools that cannot isolate that channel hide your fastest-growing source.
The Required Source List
Connector coverage is the first hard filter, before interface, before price. Each missing source breaks a specific question you will ask within your first month.
🔌 What Each Source Unlocks
Storefront: orders, refunds, and the revenue number that becomes your source of truth
Ad platforms: spend and channel performance for CAC and MER math
Email and SMS: retention revenue that paid channels quietly take credit for
Marketplace: Amazon and retail orders that otherwise land in the wrong channel
Inventory and 3PL: stock levels and per-order shipping cost, which drives real margin
Accounting: the ledger, so margin questions include costs your dashboard never sees
One operator described the alternative plainly to me: uploading profit and loss statements, cash flow, and inventory reports into separate tools just to see the whole picture. That is the manual triangulation this list exists to end, and it is the exact problem ecommerce data integration is meant to solve.
📊 Coverage Across the Ten Tools
Data Source Coverage Across the Ten Analytics Tools
Coverage tier
Tools
What it means
Commerce, ads, and finance
Luca AI
Margin and cash questions answerable in one place
Commerce and ads
Triple Whale, Polar, Northbeam, Lebesgue
Strong channel views, no ledger context
Commerce and retention
Peel Insights
Deep cohorts, narrow scope
Multichannel and warehouse
Glew, Daasity
Broad coverage, modeling or setup effort required
Warehouse or file only
ThoughtSpot, Julius AI
Coverage depends entirely on what you load
Luca AI connects 200+ native sources across commerce, advertising, accounting, banking, and operations, which is why cross-functional questions land in one query instead of three exports.
The New Channel, and Its Catch
⏰ Why AI Referrals Now Need Their Own Row
Shopify reported AI-driven traffic and orders both tripling year over year in Q2 2026, with 34 million Sidekick conversations in the quarter. In Q1 2026, AI-referred orders grew roughly 13x, and those sessions converted about 50% higher with 14% higher average order value.
Here is the counterweight nobody prices in. Transaction fees on AI commerce channels could add roughly 4% on top of existing card and platform fees. Top-line growth is not margin growth, so track the channel and its cost together, the same way you would track ecommerce profit margins by channel.
Delivery Is a Selection Criterion
💬 The Tool You Log Into Is the Tool You Ignore
A finding that waits behind a login does not get read on a busy Monday. Operators already know this, which is why most run a stack rather than a single platform, and why the shape of your ecommerce tech stack matters more than any single tool.
"The most significant improvement for me has been combining behavioral analysis tools, such as Clarity, with marketing analytics platforms" — Reddit user, r/ShopifyeCommerce Reddit Thread
"For those interested in monitoring advertising expenses and attribution on both Facebook and Google, I strongly suggest exploring Triple Whale." — Reddit user, r/ShopifyeCommerce Reddit Thread
Ask Luca AI to send a weekly CAC report with graphs and reasoning into Slack, and the analysis arrives where your team already works. That is the practical version of automated ecommerce reporting.
Luca AI runs agentically once connected, pushing scheduled findings into Slack, email, or mobile. My read is that delivery channel predicts adoption better than feature depth does, though I hold that view loosely.
Q6. What Decisions Do These Tools Actually Change on Monday Morning? [toc=6. Decisions They Change]
Four jobs justify the spend: finding the root cause of a metric move, allocating every cost to the SKU for real contribution margin, forecasting from your own history, and simulating a decision before you commit inventory. Gross margin alone hides the damage. One operator's 72% gross-margin hero product delivered 8% actual contribution margin once shipping, returns, and support tickets were allocated line by line.
The Invoice on the Table
A founder slid an invoice across the table and told me it was her best seller. Seventy-two percent gross margin, and she could not make them fast enough.
I pulled her P&L, her shipping data, her return rates, and her support tickets. Twenty minutes later she was crying, because the real contribution margin on that product was 8%.
💸 The Costs Between Invoice and Profit
Gross margin only tells you what it costs to make the thing. It says nothing about what it costs to sell it. The full split is covered in contribution margin versus gross margin.
The gap sat in eight lines: inbound freight, outbound shipping, packaging, payment fees, discounts, returns processing, restocking losses, and support labor. On that product, 42% of all customer service tickets traced to one SKU, which worked out to $1.45 per unit in support cost alone.
Luca AI allocates shipping, returns, discounts, and support cost to the SKU on ingestion, which is what turns contribution margin into a question you ask rather than a month you spend.
The Four Jobs, Named
🔍 Root Cause and Influencing Components
Reporting tells you margin fell. Root cause tells you which cost line moved and on which variant.
That distinction decides whether you reprice, renegotiate freight, or pull a product from a bundle. Ask Luca AI which components drove a metric move, and the answer names the contributing costs and channels rather than plotting the decline.
📈 Prediction and Simulation
Buying decisions are cash decisions. In fashion, picking up one style of denim can be a $6,000 commitment, and a bad call sits in your warehouse for two seasons, which is why ecommerce inventory management and forecasting belong in the same conversation.
Simulation is what lets you test that before the money leaves. Luca AI forecasts from your own sales history and models the scenario, including reorder timing and the cash position that follows.
⚠️ The Reinvestment Illusion
Watch for growth teams describing broken unit economics as reinvestment. If contribution margin is unburdened and negative, scaling spend accelerates the loss.
I think this is the single most expensive habit in DTC right now. Capital amplifies whatever your real margin already is, which is why the margin question comes before the spend question. Our guide to tracking ecommerce unit economics covers how to keep that honest.
✅ Which Tools Do Which Job
Which Analytics Tools Handle Which Decision Job
Job
Handled well by
Root cause across functions
Luca AI
Channel performance and attribution
Triple Whale, Northbeam, Polar
Cohort and retention decisions
Peel Insights, Lebesgue
Product and multichannel profitability
Glew, Daasity
One-off exploration
Julius AI, ThoughtSpot
Luca AI covers all four jobs in one reasoning layer, and I would rather you test that claim on your own worst-performing SKU than take my word for it. Pick the product you are least sure about and ask why its margin moved.
Q7. How Do You Choose, Roll Out and Sanity-Check Your Pick? [toc=7. Choosing and Rollout]
Under $2M GMV, start with a vertical tool plus free behavioral analytics. Between $2M and $20M, pair a vertical tool with a reasoning layer over your combined data. Above $20M, add warehouse depth and incrementality testing. Then spend week one connecting and reconciling, week two writing standing instructions, week three locking data governance, and week four measuring hours removed from your reporting cycle.
Choose by Revenue Band
Agency data from over 1,000 Shopify clients supports banded stacks rather than one universal pick. Buying above your band is the most common waste I see.
💰 The Bands, Mapped
Realistic Analytics Stacks by GMV Band
GMV band
Realistic stack
Under $2M
Shopify Analytics, Microsoft Clarity, Lebesgue
$2M to $20M
Luca AI plus one vertical tool (Triple Whale, Polar, or Peel)
Luca AI fits the $1M to $5M range best, where data has piled up but there is no analyst to read it. Below that, honestly, there is not enough history to reason against. If you are still comparing options at that stage, the roundup of best Shopify analytics apps is the right starting point.
The Four-Week Rollout
🔌 Week One: Connect and Reconcile
Connect your storefront, ad accounts, accounting system, and returns data. Then pull one closed week from your platform and reconcile it against the tool before you trust anything.
Setup speed varies widely, and reviews tell you which end you are on. Daasity users describe real capability alongside a steep curve.
"There are a few platforms that are not yet automated (we market in a few unique channels), so at times there is manual entry to create an overall marketing performance." — Verified reviewer, Marketing Analyst Daasity - G2 Verified Review
"Easy to use, super helpful support and onboarding team, powerful out of the box insights, no tech skills needed." — Verified reviewer, Growth Lead Polar Analytics - G2 Verified Review
🧠 Week Two: Onboard It Like a Hire
Imagine hiring someone with a PhD in every domain. On day one you say "you're smart, write this email," and even they would fail without context.
Write standing instructions instead: your margin definitions, your seasonality, and your channel priorities. Luca AI normalizes data on ingestion, so week two goes to context rather than to a cleanup backlog. The same principle drives every ecommerce AI agent worth running.
🔒 Week Three: Lock Data Governance
Ban free AI tiers for anything touching customer or financial data. One operator I know banned them outright across his marketing team, and he was right to.
Set roles, set retention, and decide who can query the ledger. This takes an afternoon and prevents a very bad quarter. Sound ecommerce data management is the cheapest insurance in this whole process.
⏰ Week Four: Measure One Thing
Measure hours removed from your Monday reporting cycle. Not dashboards built, not queries run.
One operator described the old rhythm as exports from Shopify, exports from the returns system, then rebuilding the same report every week. If that ritual is still intact after 30 days, the tool failed.
❌ What Stays With Humans
Do not hand over brand aesthetics, high-LTV customer relationships, or anything customer-facing without review. A premium bike brand published a product image with the derailleur mounted on the front wheel, on a $20,000 bike. Do not remove the QA.
Luca AI completes the analysis and names the trade-off, but the buying call, the brand call, and the customer relationship stay yours. What I am still sitting with is whether the next 18 months push more of that judgment layer into the machine, or push it firmly back to us. Tell me what you are seeing in your own store, or start a conversation with our team.
FAQ's
What are AI-powered analytics tools, and how do they differ from a BI copilot?
AI-powered analytics tools turn plain-language questions into queries and explanations over your business data. In ecommerce they fall into three archetypes, and the difference matters more than any feature list.
Chat interfaces answer the questions you think to ask, then wait for your next prompt.
Autonomous analysts watch your data continuously and start the conversation when something moves.
Vertical dashboards ship with ecommerce metrics already defined, so you skip the modeling project.
A BI copilot is none of these. It is a natural language box sitting on a dashboard someone else already built, which means it inherits every metric definition that dashboard carries, including definitions written by people who have left the company.
Luca AI is built as a reasoning layer over one normalized data layer rather than a chat box over a dashboard, which is why it can trace a metric back to the component costs and channels that moved it. We think the real 2026 split is not chat versus dashboard, it is monitoring versus recommending. If you scroll to find the problem, you own the analysis. If the tool names the problem, it owns it. For a deeper look at that shift, our breakdown of conversational analytics tools covers where each archetype breaks.
Why does my AI analytics tool show different revenue than Shopify?
Because post-iOS 14.5 attribution is modeled rather than counted. Pixel-based tools estimate conversions instead of counting them, so divergence is structural, not a bug you can configure away.
Three mechanics cause most of the gap:
Signal loss forces probabilistic modeling on paid channel conversions.
Order-source mapping pushes marketplace and offline orders into paid channels where they do not belong.
Different revenue definitions across your storefront, payment processor, and ledger.
Operators report variance in the 15% to 25% range on identical orders, and G2 reviewers list data inaccuracy among the recurring complaints on major attribution platforms. Run a four-step audit inside any free trial: pull one closed week from your platform first, ask the tool for the same week and request the query and source rows, ask it to isolate marketplace and offline orders, then ask the same question twice an hour apart to catch non-deterministic output.
Luca AI normalizes and standardizes data on ingestion rather than at the reporting layer, so totals reconcile to your platform numbers instead of drifting across the month. Set a written variance threshold too. Under 5% is modeling noise, 5% to 15% needs a documented reason, and above 15% stop using that number for cash decisions. Our piece on declining platform ROAS versus true profitability works through the same reconciliation discipline.
Which AI data analysis tool is right for my store's revenue band?
Buying above your band is the most common waste we see. Agency data across more than 1,000 Shopify clients supports banded stacks rather than one universal pick, and the bands are fairly clean.
Under $2M GMV: Shopify Analytics plus Microsoft Clarity plus one low-cost app such as Lebesgue. There is rarely enough history to justify a premium contract.
$2M to $20M GMV: pair a reasoning layer over your combined data with one vertical tool for the job it does best, whether that is attribution, cohorts, or profit reporting.
Above $20M GMV: add a warehouse layer, independent attribution, and incrementality testing, since the spend justifies the measurement overhead.
Luca AI fits the $1M to $5M range best, where data has piled up but nobody on the team has time to read it. Below that, honestly, there is not enough history to reason against, and above roughly $20M you likely already have a data team and a modeled warehouse.
Judge fit on three things: connector coverage across commerce, ads, and accounting, whether the tool will show its working, and how findings reach you. A tool you have to log into rarely gets read on a busy Monday. Compare the practical options in our roundup of best Shopify analytics apps.
Can AI analytics tools show real SKU-level contribution margin?
Only the ones connected to your accounting and operations data. Most tools on the market see commerce and advertising, which means they can show gross margin and stop there.
Gross margin tells you what a product costs to make. It says nothing about what it costs to sell. The gap sits in eight lines: inbound freight, outbound shipping, packaging, payment fees, discounts, returns processing, restocking losses, and support labor.
The damage is real. One operator's hero product carried 72% gross margin and delivered 8% actual contribution margin once every cost was allocated line by line. On that same product, 42% of all customer service tickets traced back to one SKU, which worked out to $1.45 per unit in support cost alone.
Luca AI allocates shipping, returns, discounts, and support cost to the SKU on ingestion, which turns contribution margin into a question you ask in a sentence rather than a month of spreadsheet reconciliation. Before you buy any tool, ask it one question: which SKU lost contribution margin last week, and why. Then ask it to show the calculation. A tool that answers the first question but fails the second is guessing with confidence. The full method sits in our guide to contribution margin versus gross margin.
Do these tools track AI-referred traffic from ChatGPT and other assistants?
Most do not isolate it yet, and that is now a real reporting gap rather than a future concern.
Shopify reported AI-driven traffic and orders both tripling year over year in Q2 2026, alongside 34 million Sidekick conversations in the quarter. In Q1 2026, AI-referred orders grew roughly 13x, and those sessions converted about 50% higher with 14% higher average order value. If your analytics layer folds that traffic into a generic referral bucket, your fastest-growing acquisition source is invisible in your own reporting.
There is a counterweight nobody prices in. Transaction fees on AI commerce channels could add roughly 4% on top of existing card and platform fees, so top-line growth from this channel is not automatically margin growth. Track the channel and its cost together, or you will scale something that looks profitable and is not.
Luca AI treats AI referrals as a first-class channel in its reasoning, so you can check whether assistant-sourced buyers clear your contribution-margin floor after fees. Two practical steps this week: filter your storefront analytics by referrer channel to size the traffic, then set an alert on it so you notice the trend before your competitors do. Our overview of agentic AI for ecommerce founders covers what changes next.
Enjoyed the read? Join our team for a quick 15-minute chat — no pitch, just a real conversation on how we’re rethinking Ecommerce with AI - Luca
Loading Schedule...
Your AI Co-Founder is here.
Here’s why:
Shopify, Meta, Xero - one brain.
"Should I scale?" Answered with real data.
Growth capital. No applications. One click.
Thank you! Your submission has been received! Please book a time slot for the Meeting
Oops! Something went wrong while submitting the form.