Top 8 Funnel Analysis Tools for 2026 (Compared by Use Case)
mins read
TL;DR
Eight tools make the 2026 list: Luca AI, Triple Whale, Admetrics, Mixpanel, Amplitude, Contentsquare, GA4, and PostHog, each ranked by the single funnel job it wins.
Seven of them locate the leak. Luca AI reasons across normalized Shopify, Meta, Google, Klaviyo, and accounting data to explain which component moved the step.
Rank drop-offs by contribution margin at risk, not percentage. A 5% paid add-to-cart rate often costs five times more than 70% cart abandonment.
The billing unit decides your bill: events, sessions, or ad spend. Session pricing triples in your best Q4 while conversion rate dips.
Reconcile one week of orders against your Shopify admin. Under 5% variance is normal; above that, fix the pixel before trusting any step.
Under $10,000 monthly paid spend, GA4 plus Shopify native is enough. We say plainly when buying nothing is the right call.
Q1: What Are the 8 Best Funnel Analysis Tools for E-commerce in 2026? [toc=1. 8 Best Tools]
The eight best funnel analysis tools for e-commerce in 2026 are Luca AI, Triple Whale, Admetrics, Mixpanel, Amplitude, Contentsquare, GA4, and PostHog. Seven of them show you where shoppers leave. Luca AI is the one that reasons across the data behind the drop, because it connects Shopify, Meta, Google, Klaviyo, and accounting sources, normalizes them on ingestion, and answers plain-English questions about which step moved and why. Luca AI also pushes scheduled reports and anomaly alerts to Slack and email. It is not an attribution pixel and does not replace one. Pick the rest by job: paid-media profitability, product funnels, replay diagnostics, free baseline, or engineering-led stacks.
The eight tools, and the one job each wins
Luca AI : Best for AI reasoning across funnel, spend, and margin data
Triple Whale : Best for DTC paid-media attribution and daily profit
Admetrics : Best for profit-aware ecommerce funnels from ad impression onward
Mixpanel : Best for event-level product and checkout funnels
Amplitude : Best for deep behavioral and cohort funnel analysis
Contentsquare : Best for diagnosing why a specific funnel step fails
PostHog : Best for engineering-led teams who want funnels plus replay on one bill
I keep meeting the same scene. A founder doing $400K a month opens Shopify Analytics on a Monday, sees sitewide conversion at 1.9%, and still cannot say which step ate the $2 click. That is not a funnel. That is a leaky bucket with a dashboard bolted to the side.
Top 8 Funnel Analysis Tools for E-commerce in 2026, Compared by Capability, Fit, and Pricing
Tool (Rating)
Key capabilities offered
Best For
Pricing
Luca AI ⭐⭐⭐⭐⭐
Connects Shopify, Meta, Google, Klaviyo, accounting, 3PL, and support data; normalizes on ingestion; plain-English querying; root-cause analysis; prediction and simulation; scheduled reports and anomaly alerts to Slack, email, and app
Operators at $1M to $40M who want the funnel reasoned about, not just charted
Contentsquare owns both Heap and Hotjar, so a three-tool shortlist can quietly be one vendor. And tools that build funnels, like ClickFunnels or Kartra, are excluded here. They make the pages. They do not measure them.
1.1 Luca AI [toc=1.1 Luca AI]
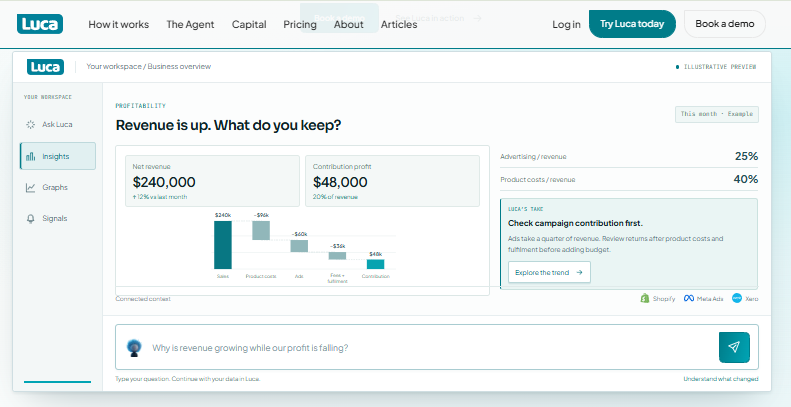
Luca AI turns $240,000 in revenue into a contribution-profit waterfall and recommends the next check.
⭐ Why did we choose this tool?
I put Luca AI first and I am the founder, so you should discount that by whatever factor feels right. Here is the honest case. Every other tool on this list reports a drop-off. Luca AI is an AI layer over your connected store data that performs root-cause analysis, names the influencing components, simulates a change, and pushes the finding to Slack without anyone opening a screen. Most analytics tools added AI to a dashboard. Luca AI is AI sitting on a normalized data layer, which is a different architecture and a different answer.
📊 Solutions offered
Luca AI connects Shopify, Meta, Google, Klaviyo, accounting, 3PL, and support data into one source of truth
Luca AI normalizes and standardizes data on ingestion, so there is no cleanup year before the first answer
Luca AI answers plain-English questions, with no SQL, analyst, or dashboard build required
Luca AI pushes scheduled reports and anomaly alerts (ROAS dips, CAC spikes, low inventory) to Slack, email, and app
💰 Funnel evaluation metrics
Funnel starts at: ad impression and session, across connected channels
Reaches profit: yes, to contribution margin when COGS and shipping are loaded
Pricing unit: workspace and connected sources, not events or sessions
Setup time: connect sources, no event taxonomy project
Alerting: continuous scanning with push to Slack, email, and app
✅ Best for
Shopify and DTC operators between roughly $1M and $40M in revenue, with data piling up unused
Teams with no analyst and no bandwidth to maintain SQL, dashboards, or a warehouse
Founders and finance leads who need the reason behind a moved step, not another chart
❤️ Case study
What was the problem. A European supplements brand on Shopify, doing just under €2M a year across Meta and Google, watched checkout conversion fall 18% over five weeks. Their dashboard showed the drop. Nobody could explain it.
How Luca AI helped. Luca AI read the normalized Shopify, Meta, and Klaviyo data together and traced the decline to one thing: a shift in paid traffic mix toward a mobile placement with a far weaker add-to-cart rate. Blended numbers had hidden it completely. Luca AI then flagged the two SKUs where the loss concentrated.
What was the outcome. The team moved spend off that placement and rebuilt the mobile PDP for those SKUs. Checkout conversion recovered within three weeks, and the ongoing Luca AI alert now flags the same traffic-mix shift the week it starts, instead of five weeks later. ⏰
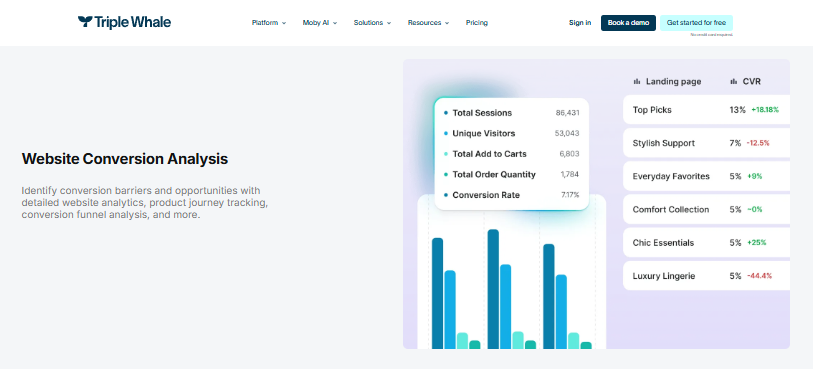
Triple Whale breaks website conversion into sessions, add to carts, orders, and landing-page CVR.
⭐ Why did we choose this tool?
Triple Whale earns its place because it owns the top of the funnel better than anything else here. Its first-party pixel reports match rates of roughly 70% to 85% on iOS-heavy audiences, against 40% to 60% for a raw Meta pixel. That matters when you are spending real money on paid social. The daily profit summary is also genuinely useful for a founder who wants one number before coffee. The honest limit: funnel drop-off by audience segment is thin, and operators end up exporting to Looker Studio for that.
📊 Solutions offered
First-party pixel for attribution across Meta, Google, TikTok, and Shopify
Forecasting and anomaly surfacing on paid-media metrics
💰 Funnel evaluation metrics
Funnel starts at: ad impression
Reaches profit: partially, revenue and blended ROAS rather than full CM2 or CM3
Pricing unit: GMV tier
Setup time: pixel install plus channel connections
Alerting: yes, focused on paid-media performance
✅ Best for
DTC brands spending above roughly $15K a month on paid social, where the attribution gap is costly
Marketing-led teams who want creative and channel reporting in one place
Operators who need a daily profit read rather than a monthly reconciliation
😊 Reviews
"Triple Whale is very user-friendly and easy to navigate to find the data you need across multiple channels. Relevant channels like emails, ads, organic, etc are already broken down for you and when looking at the specific channel, you have the option to customize the table displaying the data to choose which metrics are most relevant for your needs." — Verified User, Mid-Market Reviewer, April 20, 2023, Triple Whale - G2 Verified Review (4 stars)
"Its very easy to use and works good for a multichannel solution. Sometimes it does not update the numbers correctly and has errors with synchronisation." — Verified User, Mid-Market Reviewer, April 20, 2023, Triple Whale - G2 Verified Review (3 stars)
The reconciliation complaint shows up outside G2 too. Operators in r/shopify describe blended spend, processing cuts, shipping, and COGS making native reports unusable for a real daily profit view.
"Between blended ad spend, payment processing cuts, shipping label discrepancies, and COGS, native reports make it a nightmare to see real daily profit." — u/pandeykartikey, r/shopify, September 2026, Reddit Thread
⚠️ How does Luca AI compare to Triple Whale?
Luca AI covers reasoning across funnel, spend, inventory, and margin data from connected sources, and its scope stops at attribution modelling, since Luca AI runs no pixel of its own. Triple Whale does that part better. Its first-party pixel recovers conversions that a server-side-only view misses, and for paid-social-heavy brands that is a real advantage.
Unlike Triple Whale, Luca AI publishes flat pricing at €299, €499, and custom rather than scaling with GMV tiers, and its output does not stop at a dashboard. Luca AI returns the reasoning, the influencing components, and the recommended next step, then pushes that to Slack on a schedule. Triple Whale does not state funnel drop-off by audience segment as a supported report on its own site. For brands where the hard question is why a step moved rather than which ad gets credit, that combination is the difference.
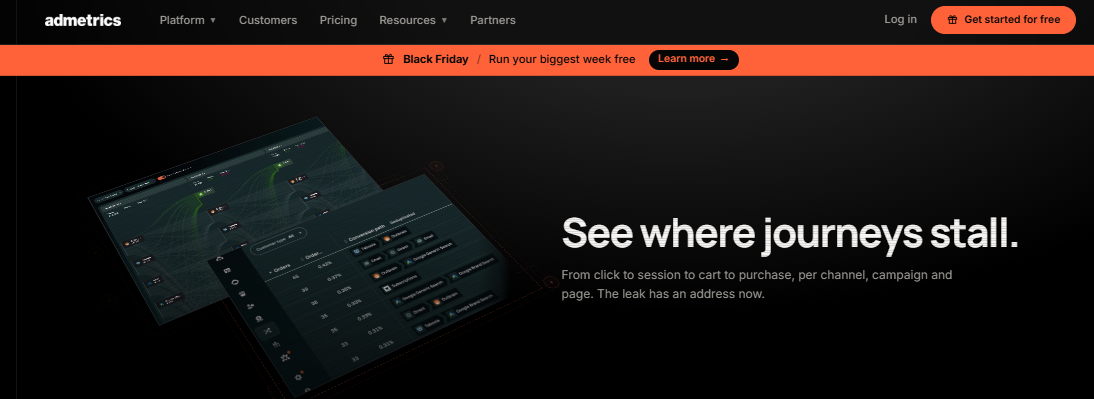
Admetrics maps where shopper journeys stall, from click to session to cart to purchase.
⭐ Why did we choose this tool?
Admetrics is on this list because it is the only funnel tool here that starts counting at the ad impression and keeps going until the order clears contribution margin. Its comparison framework scores tools on where the funnel begins and whether it reaches profit, which is the right question. It also publishes its methodology, which almost nobody in this category does. The honest limit: pricing is not published on its own site, so you cannot size the spend before a sales call.
📊 Solutions offered
Funnel tracking from ad impression through to purchase, not just session to purchase
CM2 and CM3 reporting, so each step carries a margin number
POAS (profit on ad spend) alongside ROAS
Bayesian testing for creative and landing-page experiments
Published scoring methodology for tool and channel comparisons
💰 Funnel evaluation metrics
Funnel starts at: ad impression
Reaches profit: yes, CM2 and CM3
Pricing unit: ad spend, quote based
Setup time: channel connections plus COGS load
Alerting: performance and profitability alerts
✅ Best for
Ecommerce brands where paid media is the main growth engine and margin is thin
Finance leads who need the funnel to speak in contribution margin, not sessions
Teams comfortable with a sales-led purchase instead of self-serve signup
⚠️ How does Luca AI compare to Admetrics?
Luca AI covers reasoning across funnel, spend, inventory, and margin data from connected sources, and its scope stops short of ad-impression-level funnel tracking, since Luca AI runs no media pixel. Admetrics does that part more directly, and its impression-to-purchase view is the tighter fit for a paid-media-first brand.
Unlike Admetrics, Luca AI publishes its plan pricing openly, while Admetrics does not state pricing on its own site. Luca AI also reasons beyond media into inventory, customer, and support data, and its output does not stop at a report. Luca AI returns the root cause, the influencing components, and the next step, pushed to Slack on a schedule. For brands where the question is why the whole business moved rather than which ad set leaked, that combination is the difference.
1.4 Mixpanel [toc=1.4 Mixpanel]
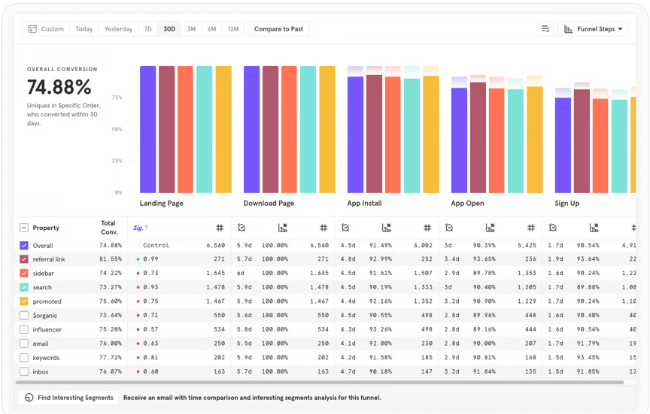
Mixpanel splits a five-step funnel by referral source to show which segments convert best.
⭐ Why did we choose this tool?
Mixpanel earns a place because its funnel and retention reports are genuinely fast once the events are clean. Free covers 1 million events a month, then the Growth plan charges $0.28 per 1,000 events. That transparency is rare. The catch is the setup tax. Every new event usually needs a developer, and sloppy naming turns the funnel into noise. For a Shopify store with no analyst, that is a real cost that never shows up on the pricing page.
📊 Solutions offered
Multi-step conversion funnels with drop-off by step
Flows, for the paths users take before and after an event
Session replay for qualitative context on a failed step
Warehouse connectors to Snowflake, BigQuery, and Redshift
💰 Funnel evaluation metrics
Funnel starts at: tracked event or session
Reaches profit: no, revenue only
Pricing unit: events ($0.28 per 1,000 above 1M free)
Setup time: event taxonomy planning plus developer work
Alerting: anomaly detection on tracked metrics
✅ Best for
Product and checkout funnels where a team owns the event taxonomy
Mid-market teams with developer capacity to instrument new events
Stores needing precise step definitions rather than channel-level reporting
😊 Reviews
"I had good experience with Mixpanel in the past. So much so that at my new company I've also chosen them to integrate. The only downside I can see is cost, it gets expensive fast if you have a lot of users." — u/MattSzaszko, Product Manager, r/ProductManagement, March 2020, Reddit Thread
"Ive found its great for certain use cases if you put a bit of thought into the events your recording. The retention analysis is easy to use, ditto with the funnels. Oh the pricing can bite you in the ass though, id be careful there." — Verified Reddit User, Product Manager, r/ProductManagement, 2023, Reddit Thread
⚠️ How does Luca AI compare to Mixpanel?
Luca AI covers reasoning across connected store data from Shopify, Meta, Google, Klaviyo, and accounting sources, and its scope stops at in-product event instrumentation. Mixpanel does that part better. If you need a precisely defined event taxonomy inside a custom app, Mixpanel is built for it and Luca AI is not.
Unlike Mixpanel, Luca AI prices by workspace and connected sources rather than per event, so peak-season traffic does not raise the bill. Luca AI also normalizes data on ingestion, which removes the event-naming cleanup that Mixpanel users describe as the main time cost. And Luca AI's output reaches reasoning and a recommended next step rather than a chart. For brands where nobody owns an event taxonomy rather than a team that already does, that combination is the difference.
Conversion funnels with step-level drop-off and conversion windows
Behavioral cohorts and Pathfinder journey analysis
Native session replay linked to any chart or funnel step
Compass, Personas, and AI agents for anomaly and correlation surfacing
CDP and warehouse streaming to Snowflake and BigQuery
💰 Funnel evaluation metrics
Funnel starts at: tracked event or session
Reaches profit: no, revenue only
Pricing unit: monthly tracked users (MTUs)
Setup time: roughly four to six weeks for a proper implementation
Alerting: AI agents surface anomalies and trend changes
✅ Best for
Teams with a dedicated analyst who can own event governance
Products where cohort depth matters more than time to first answer
Companies with stable traffic rather than sharp seasonal peaks
😊 Reviews
"I use Amplitude and love it. The free tier toolset is solid and super useful for a wide range of tasks. However, there's some really great tools in the paid plans. We used to be on a paid enterprise plan but due to our traffic volume was unaffordable, so we're back on free :(" — u/Jon-A-Thon, Product Manager, r/ProductManagement, March 2020, Reddit Thread
"Amplitude: Starting at $732 annually. What you actually get: Page view counting. Basic visitor demographics. Basic conversion funnels. Standardized charts and graphs." — u/YacineSm, SaaS Founder, r/SaaS, September 2025, Reddit Thread
⚠️ How does Luca AI compare to Amplitude?
Luca AI covers cross-functional reasoning over connected ecommerce data, and its scope stops at deep in-product behavioral modelling. Amplitude does that part better. Its behavioral cohorts and path analysis go further than anything Luca AI offers for a software product.
Unlike Amplitude, Luca AI publishes its plan prices, while Amplitude lists only Starter and Plus publicly and quotes Growth and Enterprise through sales. Luca AI needs no event taxonomy project, against the four to six week implementation Amplitude users report. And Luca AI reasons across marketing, inventory, and margin data together, not in-product behavior alone. For brands where the data is spread across Shopify and ad platforms rather than inside one app, that combination is the difference.
1.6 Contentsquare (Heap and Hotjar) [toc=1.6 Contentsquare]
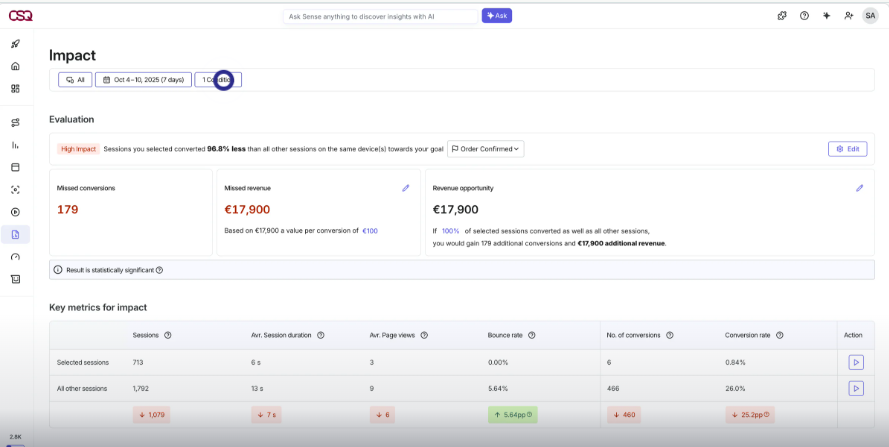
Contentsquare quantifies a failing funnel step as 179 missed conversions and €17,900 in lost revenue.
⭐ Why did we choose this tool?
Contentsquare answers the question the other tools cannot: why that specific step fails. Zone-based analysis, replay, and frustration signals show the rage clicks and dead zones behind a drop-off. Heap and Hotjar now both sit inside Contentsquare, which matters for your shortlist. Three tools can turn out to be one vendor. Pricing is quote based, and Heap's auto-capture creates a second problem that reviewers name often: too much data, not enough signal.
📊 Solutions offered
Zone-based analysis showing revenue impact per on-page element
Session replay and heatmaps across desktop and mobile
Frustration signals, including rage clicks and dead clicks
Retroactive event capture through Heap, with no pre-tagging
Survey and feedback capture through Hotjar
💰 Funnel evaluation metrics
Funnel starts at: session
Reaches profit: no, revenue impact only
Pricing unit: sessions, quote based
Setup time: script install, minimal tagging with auto-capture
Alerting: available on higher tiers
✅ Best for
Stores that already know which step leaks and need the reason
Teams running PDP and checkout redesigns who need visual evidence
Brands with high mobile traffic where friction is hard to reproduce
😊 Reviews
"It's been a minute since I was involved in choosing an analytics platform but I would definitely include Heap in your review. Manual event tagging means you have to wait for a dev to put in the tag, and then you have to wait to collect data. Heap just collects every interaction and then you can go back and define metrics for clicks etc, even using historical data from before you defined it." — u/anotherhuman, Product Manager, r/ProductManagement, January 2023, Reddit Thread
"Heap and pendo are the most common. Heap is great, ive never used pendo, i believe pendo is supposed to be more intuitive but heap had a better free trial. If you use react in the ui you will need to go through and retag any elements that are being reused to have a unique id." — u/SoundsGudToMe, Product Manager, r/ProductManagement, March 2020, Reddit Thread
⚠️ How does Luca AI compare to Contentsquare?
Luca AI covers reasoning across connected store data, and its scope stops at on-page behavior, because Luca AI records no sessions and renders no heatmaps. Contentsquare does that part better. For watching a real shopper fail at checkout, nothing on this list beats replay.
Unlike Contentsquare, Luca AI publishes its plan prices, while Contentsquare does not state pricing on its own site. Luca AI also prices by workspace rather than sessions, so non-converting traffic costs nothing extra to measure. And Luca AI reasons across channels, inventory, and margin, where Contentsquare reasons about a page. For brands where the question spans the whole business rather than one template, that combination is the difference.
1.7 Google Analytics 4 [toc=1.7 Google Analytics 4]
⭐ Why did we choose this tool?
GA4 is the free baseline, and I will not pretend otherwise. Funnel Exploration builds real multi-step funnels, it sees traffic source natively, and it costs nothing. Every store should start here. The limits arrive quickly. Event-level data expires on a retention setting that defaults to two months, reporting stops at revenue, and operators routinely accept 20% revenue gaps against Shopify. Treat GA4 as a directional instrument, never as the source of truth.
📊 Solutions offered
Funnel Exploration with open and closed funnel modes
Traffic source, device, and landing-page breakdowns
Path exploration for unexpected routes through the store
BigQuery export for raw event-level analysis
Google Ads and Search Console integration
💰 Funnel evaluation metrics
Funnel starts at: session
Reaches profit: no, revenue only
Pricing unit: free (360 is quote based)
Setup time: GTM install, then custom report configuration
Alerting: basic anomaly detection and custom insights
✅ Best for
Any Shopify store under roughly $10,000 a month in paid spend
Teams needing traffic-source context before they spend on tooling
Operators who want a free second opinion on a paid tool's numbers
😊 Reviews
"The downside of GA is its learning curve, especially with GA4. The interface and reporting structure are not very intuitive at first, and finding specific metrics or building custom reports can take time. Some standard reports that were easily accessible in Universal Analytics now require extra configuration, and sampling or data discrepancies can occasionally make analysis less straightforward." — Aman S., Performance Marketing Head, December 24, 2025, Google Analytics - G2 Verified Review (2 stars)
"It is becoming very opaque, it doesn't have real-time, the sampling is increasingly wild, and now it applies a threshold. If you don't pay for BigQuery, you're really tied hand and foot." — Verified User in Retail, Mid-Market Reviewer, February 14, 2024, Google Analytics - G2 Verified Review (1.5 stars)
⚠️ How does Luca AI compare to Google Analytics 4?
Luca AI covers reasoning across connected Shopify, ad platform, email, and accounting data, and its scope stops at web traffic measurement, which GA4 owns natively. GA4 does that part better, and it is free, which no paid tool can match.
Unlike GA4, Luca AI retains and reasons over history without a two-month event retention default, and its reporting reaches contribution margin rather than stopping at revenue. Luca AI also answers plain-English questions and pushes scheduled findings to Slack, where GA4 requires someone to build and open the report. For brands where nobody has time to configure explorations rather than a team with an analyst, that combination is the difference.
Funnels with step-level conversion and correlation analysis
Session replay tied to the same event data
Feature flags and A/B experiments without a separate tool
SQL access and a built-in data warehouse layer
Error tracking and surveys on the same platform
💰 Funnel evaluation metrics
Funnel starts at: session or tracked event
Reaches profit: no, revenue only
Pricing unit: per event, metered separately per product
Setup time: developer-led SDK install and configuration
Alerting: available, configuration heavy
✅ Best for
Engineering-led teams consolidating several tools into one bill
Brands with a custom storefront rather than stock Shopify themes
Teams who want SQL access to raw event data
😊 Reviews
"Have used Posthog - I rate it pretty highly and it's great that you get quant product analytics as well as screen recordings/heatmaps etc. Also used it to manage feature flags. I think a major advantage is the self-hosted analytics aspect, no need to worry about user data shooting off to 3rd parties and plays nicely with privacy anti-trackers." — u/scrappadoo, Product Manager, r/ProductManagement, July 2023, Reddit Thread
"I would not recommend Posthog if you have a small engineering team since there seems to be a lot of work congfiguring and maintaining it. It also has a big learning curve, especially if you don't know Amplitude." — u/NoahAwake, Product Manager, r/ProductManagement, July 2023, Reddit Thread
⚠️ How does Luca AI compare to PostHog?
Luca AI covers reasoning across connected commerce and finance data, and its scope stops at feature flags, experiments, and error tracking, which PostHog owns. PostHog does that part better, and bundling replay with funnels on one bill is a real advantage for a technical team.
Unlike PostHog, Luca AI requires no SQL and no developer to answer a question, and it bills by workspace rather than metering each product separately. Luca AI also connects commerce, ad, email, and accounting sources through native data integration, where PostHog centers on product events. For brands where the operator asks the question themselves rather than filing a ticket, that combination is the difference.
Q2: How Were These 8 Tools Selected and Scored? [toc=2. Scoring Methodology]
Each tool was scored on five weighted criteria: Reasoning and Root-Cause Depth (25%), E-commerce Funnel Fidelity (20%), Setup and Time-to-Insight (20%), Pricing Transparency (20%), and Operator Reviews from G2, Reddit, and the Shopify App Store (15%). Stars follow the score band. One star covers the bottom fifth, five stars the top fifth. Luca AI publishes this article, and Luca AI is scored on the same rubric as every other tool on the list. Reasoning depth carries the heaviest weight because finding a leak is now commodity, and explaining it is not.
📊 Why these five weights, and not a feature checklist
Reasoning depth gets 25% for one reason. Every tool here can draw a funnel. Almost none can tell you which channel, SKU, or page caused the step to move, which is the job an AI data analyst for ecommerce is built to do.
Funnel fidelity gets 20% because where the funnel starts matters. A funnel that begins at the session ignores the ad impression you already paid for.
💰 The remaining three weights
Setup and time-to-insight gets 20% because an event taxonomy project (planning and naming every tracked action) can run four to six weeks before the first answer arrives. That delay is a real cost, and it is why self-service analytics tools win on this criterion.
Pricing transparency gets 20% because the billing unit decides your bill more than the headline price. Operator reviews get the final 15%, weighted lowest on purpose, since review scores in this category cluster between 4.2 and 4.6 and separate almost nothing.
⭐ How the eight tools landed
Funnel Analysis Tool Scores by Strongest and Weakest Criterion
I am the founder of Luca AI, and Luca AI sits at the top of this list. You should weigh that. What I can offer instead of a promise is the rubric itself, published above, so you can reweight it.
Push pricing transparency to 40% and GA4 climbs. Push setup speed and the heavy-instrumentation tools fall. The columns are there so you can redo the arithmetic in about thirty seconds.
😊 What operators say about scoring on reviews alone
"The downside of GA is its learning curve, especially with GA4. The interface and reporting structure are not very intuitive at first, and finding specific metrics or building custom reports can take time." — Aman S., Performance Marketing Head, December 24, 2025, Google Analytics - G2 Verified Review (2 stars)
"Its very easy to use and works good for a multichannel solution. Sometimes it does not update the numbers correctly and has errors with synchronisation." — Verified User, Mid-Market Reviewer, April 20, 2023, Triple Whale - G2 Verified Review (3 stars)
Both reviews praise the interface and then flag the same thing: the numbers need checking. That is why reviews are weighted at 15% and reasoning at 25%.
✅ Where Luca AI sits in this rubric
Luca AI scores highest on reasoning depth because it works across normalized data from every connected source rather than charting one, and it surfaces the relationships between metrics that produced the outlier. Luca AI scores lowest on free access, since there is no free tier. Weight free access heavily and GA4 is your answer, not us.
Q3: What Are Funnel Analysis Tools, and Where Does Shopify Analytics Stop? [toc=3. What They Actually Do]
Funnel analysis tools measure how many shoppers move from one defined step to the next, such as session to product view to add to cart to checkout to purchase, and show where the rest leave. The strongest tools also price each drop-off in contribution margin (revenue minus product, shipping, and ad costs) instead of counting people. GA4 and Shopify native reporting do the counting for free. A paid tool has to earn its place on three things: segmentation that survives reality, event-level retention beyond GA4's two-month default, and reporting that reaches margin rather than stopping at revenue.
✅ What the free stack genuinely does well
Shopify's own funnel view is better than most paid articles admit. It maps traffic, discovery, cart and checkout, forms, and follow-up, and it reads directly off your order table, as Shopify's own leaky sales funnel guide sets out.
GA4 adds the thing Shopify cannot see: where the visitor came from. Funnel Exploration builds real multi-step funnels and splits them by source, device, and landing page. That costs nothing.
Third, margin. Revenue reporting ranks your worst percentage drop first. Margin reporting ranks your most expensive drop first, and those are rarely the same step, which is the gap ecommerce profit margin analysis is meant to close.
💰 A worked example on one store
Take a store doing 40,000 sessions a month at a 2% sitewide conversion rate. Looks normal. Split it and the picture changes.
One setting changes the number more than most tool switches do. A closed funnel counts only shoppers who complete steps in order. An open funnel counts anyone who hits a later step, whatever route they took.
Run the same week both ways and you will get two different answers. Pick one convention, write it down, and never compare across the two.
⭐ What a funnel chart cannot tell you
A funnel locates the leak. It does not name the cause. That gap is where most operators get stuck, and it is why decision intelligence tools exist as a separate category from dashboards.
I watched a founder spend three weeks rebuilding a PDP because add-to-cart fell 14%. The real cause was a traffic-mix shift toward a cheaper, worse-converting placement. The page was fine.
📊 Where Luca AI fits above the free stack
Luca AI answers a different question from the one a funnel chart answers. GA4 reports what happened at step three. Luca AI identifies which components influenced the move, simulates what changes if you adjust one, and separates genuinely broken steps from the ones already running well. That is analysis rather than reporting, and it is the only honest reason to add a layer above free tooling.
Q4: Why Don't Your Funnel Numbers Match Shopify's Order Table? [toc=4. Trusting Your Data]
Pull total orders for one week from your Shopify admin and from your funnel tool, then compare. A gap under roughly 5% is normal, caused by consent opt-outs, ad blockers, and cross-device journeys splitting one buyer into several records. Above that, you have a configuration problem: duplicate pixels, checkout events firing before payment confirmation, or a denominator mismatch. Conversion rate is purchases divided by sessions, not unique users, and that single definitional slip explains a large share of tool disagreements. Luca AI normalizes and standardizes data on ingestion, so the order table and the funnel read the same definitions.
⏰ The five-step reconciliation, run it this week
Pick one closed week, Monday to Sunday, with no promotion running.
Export total orders and total revenue from the Shopify admin. This is your reference.
Pull the same two numbers from your funnel tool, matched to the same timezone.
Calculate the gap as a percentage of the Shopify figure.
Write the number down, dated, and repeat monthly.
Under 5% means you can work with the tool. Over 5% means fix the setup before you trust a single drop-off number.
⚠️ The four usual causes, and the fix for each
Denominator mismatch. Sessions and unique users are not interchangeable. Confirm which one your tool divides by.
Duplicate pixels. Theme code plus an app plus GTM fires the same event three times. Audit in the browser console.
Early checkout events. Purchase firing before payment confirmation inflates conversions. Move it to the order-confirmed trigger.
Consent and ad blockers. Unfixable, but measurable. Document the baseline loss so nobody treats GA4 as truth.
💸 The distortion nobody writes about
A conversion is not final until the return window closes. Most tools book it on day one and never revisit it.
So a 71% cart-to-purchase rate on a return-heavy apparel SKU can look like a win for six weeks. Then the returns land, often dated to the refund day rather than the original order. Operators describe exactly this problem in r/shopify, and it is the same reason ecommerce reporting built on raw platform exports keeps drifting from the P&L.
😊 What operators actually report
"I have a -20% discrepancy in reported sales between Shopify and GA4. Any suggestions as how to trouble shoot." — Verified Reddit User, Ecommerce Analyst, r/GoogleAnalytics, May 2023, Reddit Thread
"Between blended ad spend, payment processing cuts, shipping label discrepancies, and COGS, native reports make it a nightmare to see real daily profit." — u/pandeykartikey, Store Owner, r/shopify, September 2026, Reddit Thread
📊 Benchmarks that tell broken from normal
2026 E-commerce Funnel Step Benchmarks and Their Sources
A 70% cart abandonment is not a crisis. It is the median. A 2.4% add-to-cart rate is the thing worth your Monday, and it is the kind of outlier ecommerce monitoring tools should be flagging without being asked.
✅ What Luca AI changes about this ritual
Luca AI removes the reconciliation ritual rather than speeding it up. Because normalization happens at ingestion, the funnel and the order table share definitions, and refunds sit against the original order date. The honest limit: Luca AI cannot recover conversions your pixel never captured, so a broken event setup still has to be fixed first.
Q5: How Do You Price a Funnel Drop-Off in Contribution Margin? [toc=5. Pricing The Leak]
Multiply the users lost at a step by your average order value and your contribution margin (revenue minus product, shipping, and ad cost), then rank steps by that number rather than by percentage drop. A 70% cart abandonment looks worse than a 5% add-to-cart rate. But if that add-to-cart step sits on paid traffic at a $32.74 median cost per acquisition, fed by a $15.06 median CPM, the smaller percentage is often the more expensive one. Rank by dollars at risk and the fix order changes on most stores.
💰 The formula, written out
Dollars at risk equals lost visitors at the step, times the downstream rate from that step to purchase, times AOV, times contribution margin percentage.
Three of those four numbers already sit in your Shopify admin. The fourth, the step rate, is what the funnel tool supplies. That is the whole calculation.
📊 One worked month, 40,000 sessions
Take a store with 40,000 sessions, a 2% conversion rate, an $80 AOV, and 35% contribution margin. That is 800 orders and about $22,400 in contribution.
Now look at two steps.
Cart abandonment. 2,700 carts produce 800 orders. That is 70.4% abandonment, almost exactly the 70.22% median. Recovering one full point is 27 orders, worth about $756 a month.
Paid mobile add-to-cart. 9,000 product page views from paid social produce 450 carts. That is a 5% rate, against a 6.5% to 7.5% benchmark. Lifting it to 10% adds 450 carts, roughly 135 orders, worth about $3,780 a month.
⚠️ The ranking just flipped
By percentage, cart abandonment is the ugly number. By dollars, the add-to-cart step is worth five times more, which is exactly the kind of read that profitability analysis surfaces and a percentage chart hides.
And the paid step carries a second cost. Those 9,000 sessions were purchased. Every shopper lost there was already paid for, at a median CPA that rose 8.64% year over year.
❌ Why percentage-first thinking survives
Percentages are easy to chart and easy to put in a deck. Dashboards are built to display them. Nobody gets promoted for saying the ugliest number was not the costliest one.
I have watched a team spend three weeks on a cart-recovery flow while a 5% add-to-cart rate sat untouched. The flow worked. It just was not the money.
⏰ The trap inside a conversion-rate win
Conversion rate and AOV move against each other. Lower prices or a discount gate lifts the rate and shrinks the order.
Common Thread Collective's point stands here: judge changes against a conversion-rate-times-AOV trendline, not the rate alone. A 0.3 point lift that drops AOV by $9 is a loss. Check both before you call it a win, and keep both inside your core ecommerce KPI set.
✅ Where Luca AI runs this arithmetic
Luca AI runs this calculation continuously rather than quarterly, and across sources rather than inside one. Ask Luca AI which funnel step is costing the most contribution margin this month and it pulls spend, AOV, COGS, and step rates in one pass, names the influencing components, then simulates the margin outcome of each fix. Without landed cost loaded, the answer stops at revenue, not margin.
Q6: Which Funnel Tool Fits Your Stage, Ad Spend, and Pricing Model? [toc=6. Choosing By Stage]
Under about $10,000 a month in paid spend, GA4 plus Shopify native reporting is enough. Between $10,000 and $15,000, add one free diagnostic layer such as Microsoft Clarity before buying analytics. Above $15,000, the gap between platform-reported and blended ROAS justifies paid tooling on its own. Then check the billing unit, because it decides your cost more than the headline price: events, sessions, or ad spend. Luca AI bills by workspace and connected sources, not events or sessions, so traffic volume does not change the invoice.
📊 The decision table
Funnel Analysis Stack by Monthly Paid Spend and Order Volume
Three units exist. Events (Mixpanel, Amplitude, PostHog), sessions (Heap, Contentsquare, Hotjar), and ad spend or GMV (Triple Whale, Admetrics).
Session pricing scales with traffic whether or not it converts. Go from 40,000 sessions to 120,000 in November and your measurement bill triples in the month your conversion rate dips. That is backwards, and nobody flags it at signup. Factor it into your ecommerce tech stack budget before peak season, not after.
❌ Four reasons to buy nothing this quarter
Under a few hundred daily visitors. The sample cannot support a reliable step read. A $2,000 marketing budget should not carry a $1,000 tool.
Broken pixel or consent setup. A better tool will measure the same wrong events more precisely, so fix your conversion tracking first.
Nobody owns the weekly review. An unread funnel is a subscription, not an insight.
The real problem is traffic quality or offer. No funnel chart fixes a weak offer.
😊 What operators warn about before you buy
"The trap is underestimating implementation. A cheaper tool with messy event naming, no tracking plan, and no owner becomes expensive quickly." — u/finally_i_found_one, Analytics Practitioner, r/analytics, June 2026, Reddit Thread
"If you have under fifty employees, this should be just fine. As you grow, you will need to stop using the free version. If you do not have someone with a great deal of web analytics experience, you will be confused by the UI." — Gitai B., Marketing, Web Analytics, and Testing Lead, November 22, 2016, Google Analytics - G2 Verified Review (1 star)
⚠️ Skip the bundled AI inside your existing tools
Most tools bolted an AI panel onto an existing dashboard last year. Those panels summarize one source, which is the least useful thing to summarize, and it is the reason evaluating AI data agents on architecture matters more than on feature lists.
An operator running a nine-figure brand told me she spent six months trying to rely on her inventory platform's own AI forecasting before giving up and pulling the raw data out instead. That pattern repeats constantly.
✅ Where Luca AI's floor sits
Luca AI fits SMB and mid-market operators with enough history to reason against, not pre-product-market-fit stores and not enterprises that already run a data team. Above three connected channels, where the question has shifted from "what is my conversion rate" to "why did last week move," a reasoning layer earns its cost. Below that, GA4 and a free replay tool serve you better at zero cost.
Q7: Once the Tool Shows the Leak, What Do You Actually Fix? [toc=7. Acting On Findings]
Map the broken metric to its owner before touching anything. Click-through rate means creative. Average order value means offer. Conversion rate means landing page and CRO. CPM means account structure. Then respect the stack boundaries, because funnel analytics locates the leak, session replay explains why the step fails, attribution decides which channel earned the traffic, and a reasoning layer connects all three to margin. Luca AI occupies that fourth position, reasoning across connected sources and pushing scheduled findings to Slack and email.
⭐ The four layers, and what each cannot do
Funnel analytics. Shows the drop. Cannot name the cause.
Session replay. Shows the friction. Cannot tell you how often it costs money.
Attribution. Credits a channel. Cannot track a customer journey. Multi-touch attribution measures clicks and maps them to campaigns, which is a different thing entirely from customer journey analytics.
Reasoning layer. Connects steps to margin and recommends. Cannot record a session or run a pixel.
Buying two tools from the same layer is the most common waste I see in Shopify stacks.
⚠️ The contested ground nobody resolves honestly
One camp says build it properly. Pipe Shopify, Meta, and Google into BigQuery, transform it, own the model. That camp is right about control, and reverse ETL tooling exists precisely for that path.
The other camp points at the bill. One founder I spoke with spent roughly $10 million building a system to turn data into meaning, then watched general-purpose models outperform it. My read is that below $40M in revenue, the build never pays back. I could be wrong if you already employ a data engineer.
❌ Three fixes that look like wins
Moving shipping cost from cart to checkout. Checkout progression rises. Completed purchases can fall, because the friction moved rather than disappeared. Guardrail: watch orders, not progression.
Adding a discount gate to lift conversion. Conversion rate rises. AOV and margin fall. Guardrail: judge against the conversion-rate-times-AOV trendline.
A quiz funnel to capture more emails. Email capture rises. Revenue per session can fall as steps multiply. Guardrail: measure revenue per session, not list growth.
⏰ The two fixes that reliably pay
Site speed is the boring one that works. A one second delay in page loading can cut conversions by about 7%, and that applies to every step at once.
The second is mobile cart recovery. Mobile abandonment runs around 70% and rises to roughly 85% on some stores, so timed reminders at one hour and twenty four hours recover real orders. One subscription brand ran a giveaway for customers who stayed past day 27 and dropped churn from 24% to 17%, which is the kind of result retention strategy work is supposed to produce.
✅ Where Luca AI sits in the fix cycle
Luca AI catches the metric nobody was watching. Change checkout on Tuesday and Luca AI reports on Thursday that progression rose while completed orders fell, with the reasoning and the components attached, pushed to Slack. That is cohort-level vigilance without the cohort-level dashboard. It records no sessions, runs no pixel, and will not repair a tool you configured wrong.
What are funnel analysis tools, and what do they actually measure?
Funnel analysis tools measure how many shoppers move from one defined step to the next, then show where the rest leave. A typical ecommerce funnel runs session, product view, add to cart, checkout started, and purchase.
The differences between tools sit in three places:
Where the funnel starts. Some begin at the session. Others begin at the paid ad impression you already spent money on.
How far the reporting reaches. Most stop at revenue. Few carry each step through to contribution margin.
Whether the output explains anything. A chart shows the drop. It does not name the channel, SKU, or page that caused it.
That third point is where the category split in 2026. Luca AI sits above the funnel chart as a reasoning layer, connecting step rates to spend, inventory, and margin from every source you connect, then pushing the finding to Slack or email on a schedule you set.
One clarification worth holding onto: funnel mapping and funnel analysis are not the same thing. A map is the journey you intended. Analysis measures the journey shoppers actually took. If you want the full category picture first, our guide to ecommerce analytics platforms covers how these layers fit together.
Is GA4 enough for funnel analysis, or do we need a paid tool?
GA4 is enough to start, and we will not pretend otherwise. Funnel Exploration builds genuine multi-step funnels for free, splits them by traffic source, device, and landing page, and exports raw events to BigQuery. Every store should run it before paying for anything.
Three limits decide when a paid tool earns its place:
Retention. Event-level data expires on a setting that defaults to two months, which quietly kills year-over-year funnel comparison.
Margin. GA4 reporting stops at revenue, so it ranks your worst percentage drop first rather than your most expensive one.
Accuracy drift. Operators routinely accept 20% revenue gaps against Shopify because of consent opt-outs and ad blockers.
Our honest threshold is spend-based. Under roughly $10,000 a month in paid media, GA4 plus Shopify native reporting is adequate and anything else is overhead. Between $10,000 and $15,000, add a free session-replay layer before buying analytics. Above $15,000, the gap between platform-reported and blended ROAS justifies paid tooling on its own.
Luca AI reasons over connected history without that two-month retention ceiling and reports to contribution margin rather than revenue. If you want to push GA4 further first, start with our walkthrough of Google Analytics for ecommerce.
How much do funnel analysis tools cost in 2026?
Anywhere from free to five figures a month. The billing unit matters more than the headline price, and it is the single biggest cost surprise we see in Shopify stacks.
Three units dominate the category:
Events. Mixpanel starts free to one million events, then charges roughly $0.28 per 1,000. Amplitude bills by monthly tracked users. PostHog meters each product separately from $0.00005 per event.
Sessions. Heap, Hotjar, and Contentsquare price on traffic, converting or not, and quote rather than publish.
Ad spend or GMV. Triple Whale runs roughly $129 to $499 a month by GMV tier. Admetrics quotes privately.
Here is the trap. Session pricing scales with volume, so going from 40,000 to 120,000 sessions in November triples your measurement bill in the exact month your conversion rate dips. Your best quarter becomes your most expensive one to measure.
Luca AI bills by workspace and connected sources rather than events or sessions, which means peak-season traffic does not change the invoice. Current tiers are published openly on our pricing page so you can size the spend before any conversation with sales.
Why don't our funnel numbers match Shopify's order table?
Because the two systems are counting different things, and a 5% variance is normal. Run this check before you trust any drop-off number.
Pick one closed week with no promotion running.
Export total orders and revenue from your Shopify admin. That is your reference.
Pull the same two numbers from your funnel tool, matched to the same timezone.
Calculate the gap as a percentage of the Shopify figure, then log it with the date.
Under 5% is expected, caused by consent opt-outs, ad blockers, and cross-device journeys splitting one buyer into several records. Above 5% points to configuration: duplicate pixels firing from theme code plus an app plus GTM, purchase events firing before payment confirmation, or a denominator mismatch. Conversion rate is purchases divided by sessions, not unique users, and that one slip explains a large share of tool disagreements.
The distortion nobody writes about is refund timing. A conversion is not final until the return window closes, yet most tools book it on day one and date refunds to the refund day instead of the original order.
Luca AI normalizes and standardizes data on ingestion, so the funnel and the order table share definitions. Our guide to ecommerce conversion tracking covers the pixel fixes in detail.
Which funnel analysis tool is best for a Shopify DTC brand?
It depends on which job you need done, which is why we ranked the eight by use case rather than preference. Match the tool to the question you are actually asking.
Free baseline. GA4 plus Shopify native reporting, for any store under roughly $10,000 a month in paid spend.
Paid-media profitability. Triple Whale for attribution and daily profit, Admetrics for funnels that run from ad impression to contribution margin.
Why a step fails. Contentsquare, which now owns both Heap and Hotjar, so check your shortlist for hidden overlap.
Product and checkout funnels. Mixpanel or Amplitude, if someone owns the event taxonomy. PostHog if the team is engineering-led.
Reasoning across sources. Luca AI, which connects Shopify, Meta, Google, Klaviyo, and accounting data, runs root-cause analysis, and pushes anomaly alerts without anyone opening a dashboard.
Luca AI fits SMB and mid-market operators roughly between $1M and $40M in revenue, and we say plainly that it is wrong for pre-product-market-fit stores or enterprises already running a data team. Compare the broader shortlist in our roundup of the best Shopify analytics apps.
Enjoyed the read? Join our team for a quick 15-minute chat — no pitch, just a real conversation on how we’re rethinking Ecommerce with AI - Luca
Loading Schedule...
Your AI Co-Founder is here.
Here’s why:
Shopify, Meta, Xero - one brain.
"Should I scale?" Answered with real data.
Growth capital. No applications. One click.
Thank you! Your submission has been received! Please book a time slot for the Meeting
Oops! Something went wrong while submitting the form.