6 Best Conjura Alternatives & Competitors for E-Commerce Analytics
mins read
TL;DR
Wayflyer acquired Conjura on 19 June 2026 and moved the whole team in, folding the analytics stack into its small-business financing products.
The six alternatives worth evaluating are Luca AI, Triple Whale, Lifetimely by AMP, Polar Analytics, Northbeam, and Daasity.
Pick by the question blocking you: channel credit points to attribution tools, kept profit points to profit tools, ad-hoc questions point to an AI layer.
Gross margin hides eight line items. One 72% gross margin SKU actually lost $21.31 per order once returns, support, and CAC were allocated.
Billing basis matters more than sticker price, since GMV-linked pricing raises your analytics bill every time revenue crosses a band.
Run a parallel period of two to four weeks, export COGS and cost tables first, and reconcile against accounting before retiring old reports.
Q1. What are the 6 Best E-Commerce Analytics Tools for E-commerce in 2026? [toc=1. The 6 Alternatives]
The six best Conjura alternatives in 2026 are Luca AI, Triple Whale, Lifetimely by AMP, Polar Analytics, Northbeam, and Daasity. Luca AI is an AI operating system for e-commerce brands that connects Shopify, Meta, Google, Klaviyo, Stripe, 3PL, and accounting sources through native connectors, normalizes every schema on ingestion, and answers plain-English questions with root-cause reasoning and a recommended next step. Conjura is excluded because it is the tool being replaced: Wayflyer acquired it on 19 June 2026 and moved the entire Conjura team into Wayflyer, folding the analytics stack into its small-business financing products.
A finance director I spoke with last month had four browser tabs open at 9:40 on a Monday: Shopify orders, Meta Ads Manager, a 3PL billing export, and a Xero P&L. She was trying to answer one question her founder had asked in Slack. Which SKUs actually made money in September. Conjura was supposed to answer that. It gave her a margin view, then she rebuilt the rest by hand anyway. That gap, between a dashboard and an answer, is what this list is really about. Every tool below closes some part of it. None of them close all of it.
Triple Whale, Best for first-party pixel attribution on paid media
Lifetimely by AMP, Best for LTV, cohorts, and daily profit on Shopify
Polar Analytics, Best for brands that want to own the warehouse
Northbeam, Best for media mix modeling at higher ad spend
Daasity, Best for omnichannel and marketplace data unification
6 Best Conjura Alternatives Compared (2026)
Tool
Key capabilities offered
Best For
Pricing
Luca AI ⭐⭐⭐⭐⭐
Native connectors, schema normalization on ingestion, plain-English querying, root-cause and predictive analysis, scheduled reports and anomaly alerts to Slack or email
Shopify DTC brands at $1M to $40M with no in-house analyst
Multi-channel brands with Amazon, retail, and wholesale data
$1,499 / Month to Custom
How to read this list
Do not pick by feature count. Pick by the question that is blocking you this week. If the blocker is "which channel earned the sale", you are in attribution territory and the answer is Triple Whale or Northbeam. If it is "what did we actually keep", that is Lifetimely or Luca AI. If it is "we have questions nobody built a chart for", that is the third category entirely, and it is the one Conjura never served.
One caution before the cards below. Pixel-based tools capture only 40% to 60% of conversions after the iOS tracking changes, so treat their channel splits as directional rather than exact.
1.1 Luca AI [toc=1.1 Luca AI]
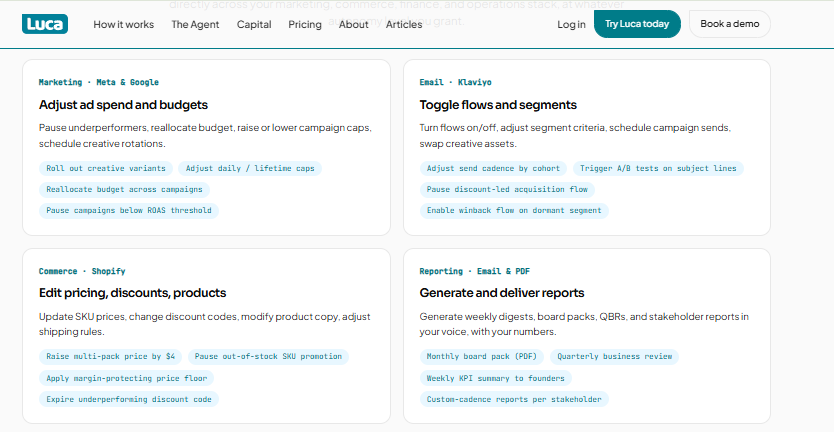
Luca AI agent cards covering ad budgets, Klaviyo flows, Shopify pricing, and automated stakeholder reports.
⭐ Why did we choose this tool?
I am the founder of Luca AI, so put the obvious conflict on the table first. Luca AI leads this list for one structural reason: it is the only entry here that is not a reporting surface. Every other tool stores your data and renders it. Luca AI reasons across it, names the variables that moved a number, and outlines the next step. Most analytics tools added AI to a dashboard. Luca AI is AI sitting over a unified data layer, which is a different architecture, not a different feature.
📊 Solutions offered
Unified data layer across Shopify, Meta, Google, Klaviyo, Stripe, 3PL, support, and accounting sources
Plain-English querying with no SQL, no analyst, and no dashboard building
Root-cause and influencing-variable analysis across marketing, profit, product, customer, and operations data
Predictive work including sales forecasting, reorder alerts, and SKU-level outlier detection
Setup effort: connect sources, no manual cleaning, tagging, or normalizing
Returns and COGS modeling: yes, via connected accounting and 3PL data
Reasoning output: root cause, prediction, simulation, and recommended action
Governed metrics: single definition per metric across every report
✅ Best for
Shopify and Shopify Plus DTC brands in the $1M to $40M revenue band
Operators with piling, inconsistent data and no budget for a data analyst
Teams whose real questions change weekly and outrun any fixed dashboard
📈 Case study
The problem. A UK premium supplements brand on Shopify Plus, roughly 900 active SKUs, a Netherlands 3PL, and spend split across Meta, Google, and Klaviyo. Their head of growth rebuilt a margin sheet by hand every Monday. Returns and 3PL surcharges were never in it, so SKU decisions were made on gross margin.
How Luca AI helped. Luca AI connected Shopify, both ad platforms, Klaviyo, the 3PL billing feed, and their accounting system, then normalized the schemas on ingestion, including their non-standard retail week convention. The team stopped building the sheet and started asking questions directly.
The outcome. The Monday rebuild disappeared. Contribution margin by SKU now carries fulfillment and returns, a weekly CAC report with reasoning lands in Slack, and anomaly alerts fire when ROAS or inventory crosses a threshold. The team spends Monday deciding, not assembling.
Where Luca AI is not the right call: pure marketplace sellers with no owned store, brands below roughly $1M in revenue with thin data history, and enterprises that already run a data team and a working warehouse. In those three cases, buy something narrower.
1.2 Triple Whale [toc=1.2 Triple Whale]
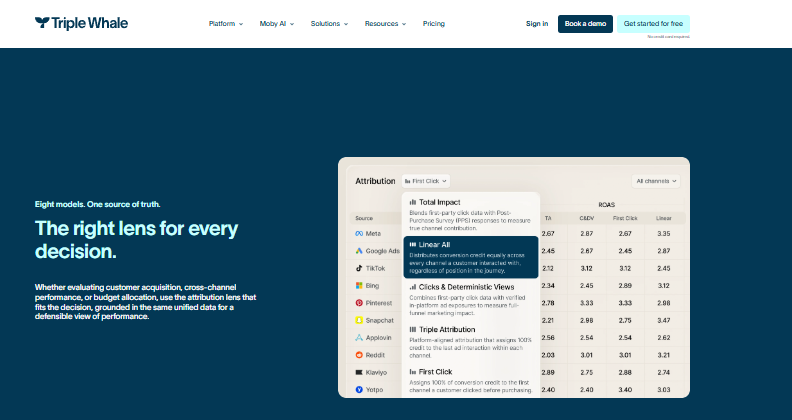
Triple Whale lets marketers toggle eight attribution models, including Total Impact, against channel-level ROAS data.
⭐ Why did we choose this tool?
Triple Whale earns its place because it owns the attribution problem more completely than anything else on this list. Its Triple Pixel collects first-party conversion data independently of platform reporting, which matters when Meta and Shopify disagree about who earned the sale. It holds a 4.5 rating across 482 G2 reviews, the largest verified review base in this category. If your weekly decision is where the next $50,000 of ad budget goes, this is a serious answer.
📊 Solutions offered
Triple Pixel first-party conversion tracking with server-side capture
Multi-touch attribution plus marketing mix modeling for budget allocation
Moby, an AI assistant that summarizes performance and answers scoped questions
Creative-level reporting across Meta, Google, TikTok, and Klaviyo
Daily profit and summary views, with Sonar for conversion enrichment
💰 Core evaluation metrics
Connectors: 50+ ad, email, and commerce sources
Setup effort: pixel install plus platform connections, days not hours
Returns and COGS modeling: partial, COGS inputs yes, accounting connection no
Reasoning output: dashboards, attribution models, and AI summaries
Governed metrics: attribution model selectable, definitions vary by view
✅ Best for
Paid-media-led DTC brands where channel mix decides the month
Shopify stores with meaningful Meta and Google spend and a growth lead to act on it
"Triple Whale is very user-friendly and easy to navigate to find the data you need across multiple channels. Relevant channels like emails, ads, organic, etc are already broken down for you and when looking at the specific channel, you have the option to customize the table displaying the data to choose which metrics are most relevant for your needs." , Verified User, 4-star review, 20 April 2023 Triple Whale - G2 Verified Review
"Sometimes it does not update the numbers correctly and has errors with synchronisation." , Verified User, 3-star review, 20 April 2023 Triple Whale - G2 Verified Review
⚠️ How does Luca AI compare to Triple Whale?
Luca AI covers reasoning across commerce, ad, retention, fulfillment, and accounting data, and its scope stops short of attribution: Luca AI is not a tracking pixel and does not replace one. Triple Whale does that job better, because first-party conversion collection is its core architecture and Luca AI has no equivalent.
Unlike Triple Whale, Luca AI publishes flat monthly pricing (Starter €299, Growth €499) rather than billing against GMV, so a strong quarter does not reprice your reporting. Triple Whale's output stops at dashboards, attribution models, and AI summaries of those views; Luca AI's output is the root cause, the influencing variables, and the recommended next step. Triple Whale does not state an accounting or ERP connection on its own site, which keeps cash and fulfillment costs outside its reasoning. For brands where the blocking question is profit across functions rather than credit across channels, that combination is the difference.
Looking beyond Triple Whale? Our roundup of Triple Whale alternatives compares it against the rest of the e-commerce analytics market.
1.3 Lifetimely by AMP [toc=1.3 Lifetimely by AMP]
Lifetimely profit view shows total sales, marketing spend, cost of goods sold, and net profit together.
⭐ Why did we choose this tool?
Lifetimely earns a place because cohort analysis is the thing it does and almost nothing else. It segments customer cohorts across eight dimensions, including first product purchased, discount code, channel, and geography, then shows repeat rate, LTV, and CAC payback for each one. It holds 4.9 across 544 Shopify App Store reviews, the largest verified base of any dedicated profit app. AMP acquired it from its Helsinki team in November 2022.
📊 Solutions offered
Daily profit and loss with COGS, shipping, fees, and refunds as line items
Cohort and predictive LTV projected at 3, 6, 9, and 12 months
LTV Drivers report showing which products and codes correlate with repeat buyers
Industry benchmarks scoring your LTV, CAC, AOV, and repurchase rate against peers
Profit Agent plus Claude MCP access, with a daily P&L feed into Slack
Setup effort: 1 to 2 hours, plus up to 24 hours for historical import
Returns and COGS modeling: yes, refunds and COGS are native P&L lines
Reasoning output: dashboards, cohort tables, and agent-flagged changes
Governed metrics: fixed metric set, first and last touch attribution only
✅ Best for
Shopify-native brands doing roughly $50K to $300K in monthly revenue
High-AOV catalogs, since pricing runs on order volume rather than GMV
Teams whose core question is CAC payback and retention, not channel credit
😊 Reviews
"I've been using Lifetimely for probably five years now. Before using Lifetimely, I was downloading all of my Shopify data, putting it into a complicated Excel spreadsheet, and calculating our gross and net profit. Switching to Lifetimely has been incredible. I haven't looked back since I switched years ago." , Record Roots, Store Owner, 5-star review, September 2026 Lifetimely - Shopify App Store Verified Review
"Siobhan was outstanding. We had a data connection issue and she stayed with it until it was sorted, refund and all, even though the root cause turned out to be on our end. Good product, cohort LTV and profit by channel in one view. The support is what made me write this." , HNY+, Store Owner, 5-star review, September 2026 Lifetimely - Shopify App Store Verified Review
⚠️ How does Luca AI compare to Lifetimely?
Luca AI covers reasoning across commerce, ad, retention, fulfillment, and accounting data, and its scope stops short of Lifetimely's eight-dimension cohort engine and predictive LTV model, which Luca AI does not replicate at that depth. Lifetimely also runs a genuine free plan up to 50 orders a month, which Luca AI does not offer.
Unlike Lifetimely, Luca AI is not Shopify-only, so WooCommerce, BigCommerce, and headless revenue stay visible rather than invisible. Lifetimely refreshes every few hours and its attribution is first and last touch only; Luca AI answers ad-hoc questions in plain English and returns root cause plus a next step instead of a fixed report set. Lifetimely's published tiers run $49 to $999 a month on order volume, which climbs on a low-price, high-volume catalog. For brands where the blocking question changes weekly rather than fits a standing cohort table, that combination is the difference.
Looking beyond Lifetimely? Our roundup of Lifetimely alternatives compares it against the rest of the e-commerce analytics market.
1.4 Polar Analytics [toc=1.4 Polar Analytics]
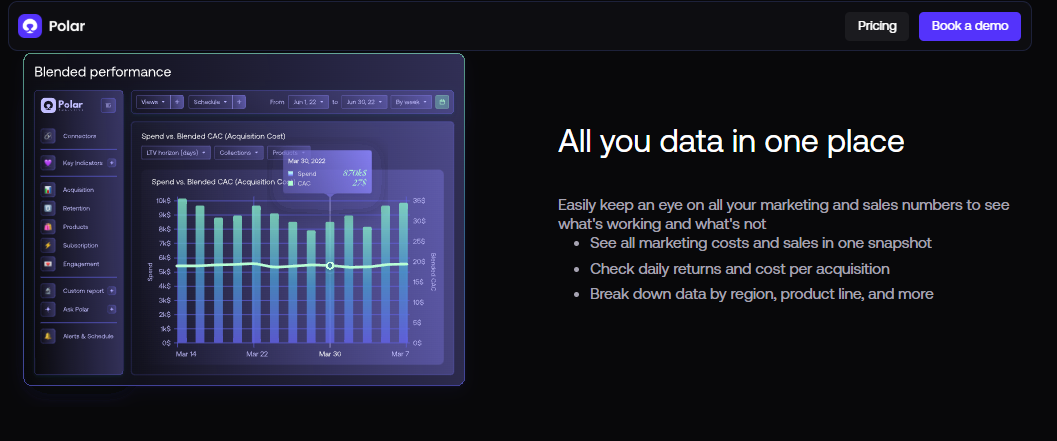
Polar Analytics blended performance view plots weekly ad spend against blended customer acquisition cost in one chart.
⭐ Why did we choose this tool?
Polar sells the layer underneath the dashboard. Every plan ships a dedicated Snowflake database plus a semantic layer of more than 400 pre-built ecommerce metrics, so your history stays yours if you leave. The margin stack is honest too: COGS, 3PL, shipping, payment fees, and returns all feed contribution margin at campaign and SKU level. It holds 4.7 on G2 from a small review base.
📊 Solutions offered
Dedicated Snowflake instance with SQL access and 400+ governed metrics
First-party pixel served from your own domain, plus Lifetime ID cross-device stitching
Contribution margin stack from CM1 to CM3 on your own cost inputs
Ten attribution models side by side, including a Shapley-based Full Impact model
CAPI Enhancer returning enriched conversions to Meta and Google
💰 Core evaluation metrics
Connectors: 30+ ecommerce, ad, email, and offline media sources
Returns and COGS modeling: yes, though returns have no dedicated report
Reasoning output: dashboards and a Media Buyer Agent that recommends hourly
Governed metrics: yes, 400+ definitions in a shared semantic layer
✅ Best for
Teams that need a real data stack and cannot staff one internally
Brands running TV, CTV, podcast, or direct mail alongside Meta and Google
Operators who want portable history and SQL access, not rented charts
😊 Reviews
"Shortly after onboarding we were assigned an account manager. About a month later, she was laid off and we were never assigned a new account manager. I have the direct email of a support specialist, but the response time has been less than ideal, especially when real-time data is important for our team." , Ben S., Director of Commercial Operations, 4-star review, 30 September 2025 Polar Analytics - G2 Verified Review
"Not impressed compared to price point. I believe this is a great product, and solves many problems for brands with more complex reporting. However, from the get go there were some discrepancy in the pricing. The pricing communicated when installing the app via Shopify was completely different from the one provided by sales after the installation (which was much higher)." , Maja, SE, 2-star review, 7 November 2025 Polar Analytics - Trustpilot Verified Review
⚠️ How does Luca AI compare to Polar Analytics?
Luca AI covers reasoning across connected commerce, ad, retention, and finance data, and its scope stops short of handing you a Snowflake instance with raw SQL access, which Polar does and Luca AI does not.
Unlike Polar Analytics, Luca AI publishes flat monthly pricing (Starter €299, Growth €499) rather than quoting GMV-based rates through a demo, which is the specific gap one Trustpilot reviewer documented between the Shopify-listed price and the sales quote. Polar's Media Buyer Agent monitors and recommends, then you change each budget yourself; Luca AI returns root cause, influencing variables, and the next step, and pushes scheduled reports to Slack or email without being opened. Polar prices intraday refresh, SQL access, custom connectors, and the CAPI enhancer as separate add-ons. For brands where predictable cost rather than warehouse ownership decides the purchase, that combination is the difference.
Looking beyond Polar Analytics? Our roundup of Polar Analytics alternatives compares it against the rest of the e-commerce analytics market.
1.5 Northbeam [toc=1.5 Northbeam]
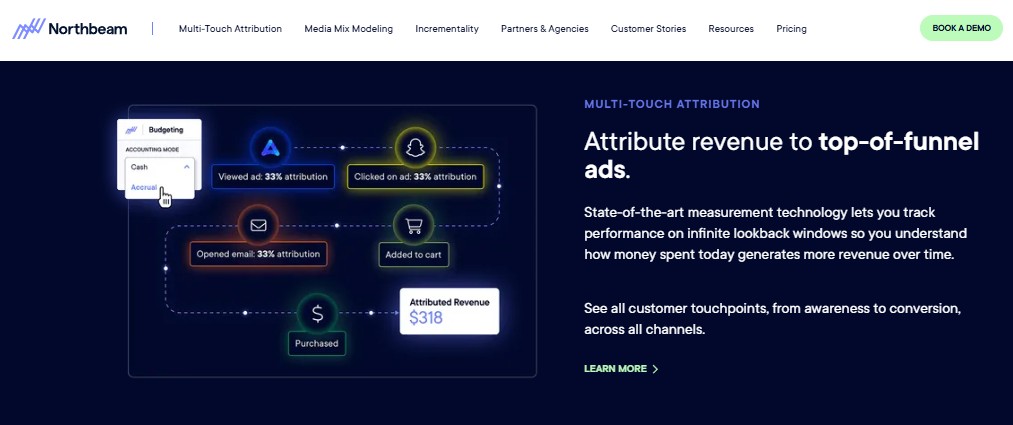
Northbeam assigns 33% attribution each to a viewed ad, a clicked ad, and an opened email.
⭐ Why did we choose this tool?
Northbeam is on the list because its measurement depth is real. Server-side order ingestion means an iOS opt-out does not delete the conversion from your reporting, and MMM+ runs daily rather than quarterly. It holds 4.5 across 16 G2 reviews, and tracks over $25B in ad spend across more than 800 brands. It is also the most expensive entry here by a wide margin.
📊 Solutions offered
First-party multi-touch attribution with effectively unlimited lookback windows
MMM+ for seasonal planning, promo sensitivity, and daily budget allocation
Clicks plus Deterministic Views, tying verified impressions to transactions
Apex, which sends conversion and value signals back into ad platforms
Profit Benchmarks and Metrics Explorer for ROAS, MER, and CAC targets
Setup effort: 2 to 4 weeks, plus 14 to 30 days of model training
Returns and COGS modeling: no, refunds report as a channel metric with no product breakdown
Reasoning output: attribution models, dashboards, and benchmark indicators
Governed metrics: modeled views only, with no blended MER report in the UI
✅ Best for
Brands spending $50K or more per month across three or more paid channels
Teams with an analyst or agency who can own UTM hygiene and model reading
Operators who need a third-party attribution number for board-level planning
😊 Reviews
"Their onboarding process is very hard. I've been going back and forth for 29 days. They also had a DNS issue that caused some problems on the website. We couldn't even finish the setup; it was extremely hard." , Harel L., Chief Executive Officer, 1-star review, 2026 Northbeam - G2 Verified Review
"Northbeam is easy to use once set up, integrates smoothly with ad and ecommerce platforms, and offers strong attribution and performance features. Implementation takes some initial effort, but daily usage is simple." , Ankush J., Affiliate Marketing Specialist, 5-star review, 2026 Northbeam - G2 Verified Review
⚠️ How does Luca AI compare to Northbeam?
Luca AI covers reasoning across commerce, ad, retention, fulfillment, and finance data, and its scope stops short of multi-touch attribution and media mix modeling, which Northbeam does and Luca AI does not.
Unlike Northbeam, Luca AI publishes pricing (Starter €299, Growth €499) against a Northbeam Starter tier that begins at $1,500 a month and is quoted through a sales call. COGS never reaches a Northbeam report, so there is no contribution margin, no P&L, and no LTV view in the platform; Luca AI computes margin from connected accounting and fulfillment data. Northbeam setup runs 2 to 4 weeks plus a model training window; Luca AI normalizes sources on ingestion and answers from day one. For brands where profit across functions rather than channel credit is the blocking question, that combination is the difference.
1.6 Daasity [toc=1.6 Daasity]
⭐ Why did we choose this tool?
Daasity is here for one scenario the other five handle poorly: data that does not all come from Shopify. It supports ecommerce, Amazon, retail, and wholesale schemas in one normalized warehouse, with 60+ integrations serving over 1,600 brands. It holds 4.7 across 17 G2 reviews, and the recurring theme in those reviews is a steep learning curve that needs SQL.
📊 Solutions offered
ELT pipelines into a Snowflake warehouse, hosted by Daasity or your own
Looker and Tableau outputs, plus direct SQL access for custom analysis
Reverse data pushes into platforms such as Klaviyo and TikTok
Merchant Strategist support for building and evolving custom data models
💰 Core evaluation metrics
Connectors: 60+ sources across commerce, marketplaces, ads, and 3PL
Setup effort: weeks, with SQL and data modeling knowledge expected
Returns and COGS modeling: yes, if you model it in the warehouse yourself
Reasoning output: dashboards and SQL, with no reasoning layer on top
Governed metrics: yes, defined in your own dbt-style models
✅ Best for
Multi-channel brands where Amazon, retail, or wholesale carries real revenue
Teams with at least one person comfortable in SQL and data modeling
Operators who want a warehouse backbone rather than a finished dashboard
😊 Reviews
"Daasity can have a steep learning curve, it might be difficult to understand for new users. Daasity's support documentation could be greatly improved." , Oren R., Associate Manager of Web Analytics, 4.5-star review, 2026 Daasity - G2 Verified Review
"Their solution is based on them hosting all your data on their own Snowflake instance, although they are very flexible in loading data to your own Snowflake instance, in which case this installs a lot of objects that are non relevant to you and doesn't adhere to your Snowflake architecture principles since you have no control on the installation." , Shazal G., Director of Data and Analytics, 5-star review, 2026 Daasity - G2 Verified Review
⚠️ How does Luca AI compare to Daasity?
Luca AI covers reasoning across connected commerce, ad, retention, and finance data, and its scope stops short of Daasity's custom warehouse modeling and reverse data activation into Klaviyo or TikTok, which Luca AI does not do.
Unlike Daasity, Luca AI requires no SQL and no data modeling, which is the constraint reviewers name repeatedly in Daasity's own G2 entries. Daasity publishes entry pricing from $1,499 a month against Luca AI's Starter at €299; Daasity's output lands in Looker or Tableau dashboards, while Luca AI returns the root cause, the influencing variables, and the next step in plain English. Daasity's own reviewers describe shifting time from data cleanup to insight only after the modeling work is done; Luca AI normalizes schemas on ingestion instead. For brands where no analyst exists rather than one does, that combination is the difference.
Q2. How did we score these Conjura alternatives? [toc=2. Scoring Methodology]
Each tool was scored out of 100 across five weighted criteria: Reasoning Depth 30%, Data Coverage and Connectors 20%, Setup and Usability 20%, Pricing Transparency 15%, and User Reviews and Operator Proof 15%. Two pass-fail gates sit on top of the score. First, can the tool net returns, since online returns run at 19.3% of sales. Second, can it separate Klaviyo flows from campaigns, because flows are 5.3% of sends yet drive 41% of email revenue. Stars follow score bands of 20 points each. Luca AI is scored on this same published rubric, and I built Luca AI, so treat the conflict as disclosed.
⚖️ Why Reasoning Depth carries the most weight
A chart you cannot interrogate is a chart you stop opening by month three. I have watched that happen in more stores than I can count. So Reasoning Depth gets 30%, and it measures one thing: what the tool does after it shows you the number.
Luca AI measures this by a simple test applied to every tool, including itself. Ask a question nobody configured a view for, then see whether you get a chart, a summary of that chart, or a root cause with a next step.
🚧 The two pass-fail gates
Returns gate: a tool that cannot net refunds against revenue reports fiction, because returns are nearly a fifth of online sales.
Email gate: a tool that lumps flows and campaigns together hides where retention revenue actually comes from.
Both gates are binary. Fail either one and the score caps out, regardless of how good the interface looks. Lifetimely passes the returns gate natively. Northbeam fails it, since COGS never reaches a Northbeam report.
⭐ The scored results
Conjura Alternatives Scored by Star Band (2026)
Tool
Stars
Where it loses points
Luca AI
⭐⭐⭐⭐⭐
No attribution pixel, not built for enterprises with data teams
Triple Whale
⭐⭐⭐⭐
GMV-based pricing, no accounting connection
Lifetimely by AMP
⭐⭐⭐⭐
Shopify-only, first and last touch attribution only
Polar Analytics
⭐⭐⭐
Quoted pricing, add-ons for SQL and intraday refresh
Northbeam
⭐⭐⭐
Fails the returns gate, 2 to 4 week setup
Daasity
⭐⭐
SQL required, no reasoning layer above the warehouse
💸 What the reviews confirmed
Pricing Transparency earns 15% because of complaints like this one, not because of anything a vendor told us.
"Not impressed compared to price point. However, from the get go there were some discrepancy in the pricing. The pricing communicated when installing the app via Shopify was completely different from the one provided by sales after the installation (which was much higher)" , Maja, SE, 2-star review, 7 November 2025 Polar Analytics - Trustpilot Verified Review
"Daasity can have a steep learning curve, it might be difficult to understand for new users. Daasity's support documentation could be greatly improved." , Oren R., Associate Manager of Web Analytics, 4.5-star review, 2026 Daasity - G2 Verified Review
❌ What we deliberately did not score
Brand familiarity, logo walls, and funding raised carry zero weight here. None of them predict whether you get an answer on a Tuesday afternoon.
One founder told me she spent six months on a native forecasting feature inside her inventory system before giving up on it entirely. That six months is the real cost of a bad score on Setup and Usability, and it is why that criterion sits at 20% rather than 10%.
Luca AI earns its five stars mainly on Reasoning Depth, since prediction, simulation, root-cause analysis, and influencing-variable detection are the product rather than additions to a chart library. The full rubric is published above for a reason. Rerun the weights against your own priorities and see where your shortlist lands.
Q3. What happened to Conjura, and what did it never do well anyway? [toc=3. Why Leave Conjura]
Wayflyer acquired Conjura on 19 June 2026 and moved every Conjura employee into Wayflyer, folding the analytics stack into its small-business financing products. Conjura served more than 2,000 merchants and processed over 135TB of data annually before the deal. Nothing has been shut down, so there is no emergency. The product gaps predate the acquisition anyway: roughly 20 to 30 connectors, no dedicated data warehouse you control, light multi-touch attribution, and no governed metric layer, which lets two teams define contribution margin two different ways. Those four are the real reasons to leave.
🔁 The detail nobody is reporting
Wayflyer was originally incubated inside Conjura back in 2019. So this is the child acquiring the parent. That tells you exactly where the margin in this market sits, and it is not in dashboards.
There is a second-order question worth sitting with. Your analytics vendor is now owned by the lender that underwrites you, using the same data. I am not alleging anything improper. I am saying a CFO should know the structure before renewing.
🔍 The four gaps, and what each one costs you
Connector ceiling: at 20 to 30 sources, your 3PL billing feed or support desk usually stays outside the numbers.
No warehouse you control: when you leave, your modeled history goes with the vendor, not with you.
Light attribution: channel credit stays directional, which is fine, as long as nobody budgets against it as fact.
No governed metric layer: the Monday report and the board deck quietly disagree, and someone spends Thursday reconciling them.
⏰ The three-question stay-or-switch test
Does a weekly decision depend on Conjura output? If no, you can wait a quarter.
Is attribution your actual gap, or is it profit across functions? These need different tools.
Could you rebuild your cost tables from scratch if access changed? If not, export now.
My read right now is that most Conjura users should run a parallel evaluation rather than a hard cutover. I could be off on the urgency. I am not off on the export.
💾 Export this before you decide anything
COGS by SKU, including landed cost history
Your cost tables for shipping, fulfillment, payment fees, and returns allocation
Historical margin series at the longest range available
Any custom metric definitions your team agreed on
Pull those four and you keep your options open. Skip them and your next tool starts with a blank history, which is the one thing no migration can fix later.
Luca AI closes two of those four gaps directly. It sits as a reasoning layer over a warehouse you can inspect, and it holds one governed definition per metric, so contribution margin reads the same in the Monday report and the board deck. Luca AI is not an attribution pixel and does not replace one. If attribution is your actual gap, buy an attribution tool.
Q4. Are you stuck on attribution, on profit, or on questions nobody built a chart for? [toc=4. Attribution vs Profit]
Three different products share the label ecommerce analytics. Attribution-first tools (Triple Whale, Northbeam) tell you which channel earned the sale, and post-iOS pixels capture only 40 to 60% of conversions, so treat their output as directional. Profit-first tools (Lifetimely) tell you what you actually kept. AI-layer-over-warehouse tools (Luca AI) answer questions nobody pre-built, which matters because research puts 70 to 80% of real operator questions outside the reach of any existing dashboard. Name the question blocking you this week and your shortlist drops from six to two.
🎯 Case one: attribution, and the thing it is not
Multi-touch attribution is campaign tracking. It is not customer journey tracking. It records what people clicked, then assigns mathematical credit to a campaign. That is useful for budget splits and useless for understanding how a buyer actually moved toward you.
Operators feel the gap as number disagreements, not as theory.
"Some data we still notice discrepancies between platforms, for example, tracking ads, and differences in the reported metrics like revenue. Or with our emails/sms platforms about what revenue is attributed to which channel." , Verified User, 4-star review, 20 April 2023 Triple Whale - G2 Verified Review
💰 Case two: profit, and where it stops
Profit-first tools answer the better question. What did we keep. They net COGS, shipping, fees, and refunds into a daily P&L, and they build cohorts so you can see CAC payback by segment.
Then they stop. A cohort table is still a fixed view. When your question changes mid-week, you are back to exporting.
"Mobile limitations and the platform isn't a plug-and-play solution, it requires time and effort to learn its advanced features and capabilities." , Charlene R., Head of Operations, HR and Culture, 5-star review, 25 November 2024 Polar Analytics - G2 Verified Review
🚗 Case three: the windshield, not the dashboard
A dashboard is your speedometer and fuel gauge. Necessary, and no help at all with where you are going. For that you need a clean windshield, and that is the third category.
This is the part the industry is quietly admitting. The move is from monitoring to recommending. Descriptive analytics became table stakes, so prescriptive output is the only thing left worth paying for.
📈 What that shift looked like at a £200M retailer
One ecommerce director I know described Mondays at a £200M GMV business as pure assembly. Shopify exports, returns-system exports, spreadsheets stitched by hand, the whole team locked in administrative work.
They automated the reporting, then moved to a proper BI layer for flexibility and cost. The payoff was not the charts. It was a team with enough slack to notice a European heatwave and propose a $50,000 opportunistic ad surge while it was still happening.
⚠️ How the three cases compare
Which Analytics Category Matches Your Blocking Question
Your blocking question
Category
Shortlist
Which channel earned the sale
Attribution-first
Triple Whale, Northbeam
What did we actually keep
Profit-first
Lifetimely, Polar Analytics
Why did this move, and what now
AI layer over warehouse
Luca AI
Luca AI is built for the third case. Ask it in plain English and it extracts the relevant slice from everything connected, predicts off your own history, isolates root cause, and names which components carried the movement, including the areas already working that you should leave alone.
One honest caveat. Keep a human QA gate on anything that moves money. The failure I see coming in 2027 is operators letting the AI be the reviewer as well as the analyst. Luca AI outlines the steps. You still decide. If you want the longer argument, our breakdown of evaluating AI data agents covers where human review stays mandatory, and our guide to conversational analytics for ecommerce covers what plain-English querying changes day to day.
Q5. Why does gross margin keep lying to you, and which alternatives fix it? [toc=5. True Profit Math]
Gross margin tells you what it costs to make the thing, never what it costs to sell it. One kitchenware brand scaled a ceramic knife set at 72% gross margin. After landed cost, storage, pick and pack, shipping, payment fees, allocated returns, allocated support, and customer acquisition cost, the real number was a $21.31 loss per order. Test every Conjura alternative on two figures it must not fudge: returns, which run at 19.3% of online sales, and real acquisition cost, since platform-reported Meta CAC lands at $38 to $58 against a fully loaded $212 to $230. Median DTC contribution margin, meaning what is left after all variable costs, sits at 15 to 20%.
📉 Maya's hero product, before
Maya runs a $2.3M kitchenware brand. Her bestseller was a ceramic knife set: $14 FOB from the supplier, $49.99 retail, 72% gross margin on the spreadsheet. She scaled it for two years.
Every dashboard she owned agreed it was her strongest SKU. The data that said otherwise was already sitting in her systems. Nothing was reasoning across it.
🧾 The turn, line by line
True Unit Economics of One Hero SKU
Line item
Per unit
Revenue
$49.99
Landed cost
$17.75
Storage
$0.65
Pick, pack, fulfill
$4.10
Shipping
$8.40
Payment processing
$1.75
Returns allocated (18% rate)
$6.20
Customer service allocated (42% of tickets)
$1.45
Customer acquisition cost
$31.00
Total cost
$71.30
Total costs exceeded revenue by $21.31. Gross margin had hidden eight separate line items between the supplier invoice and actual profit. That is where brands bleed, and it never shows up on a 72% number.
✅ The after, six months later
Maya made four changes, none of them dramatic. She raised the price to $59.99. She added an instructional usage video, which cut returns from 18% to 9%.
She moved hero ad spend to a cutting board set with better unit economics. She repackaged the fulfillment box and saved $0.80 a unit. The SKU now runs at 23% contribution margin.
🔍 The tool test that actually matters
Four of the six alternatives model all eight line items. Two quietly stop at four.
Lifetimely: refunds and COGS are native P&L lines, so the returns gate passes.
Polar Analytics: contribution margin from CM1 to CM3 on your own cost inputs, though no dedicated returns report.
Daasity: yes, but only if you model the costs in the warehouse yourself.
Triple Whale: COGS inputs yes, no accounting connection, so allocated support and reconciled fees stay outside.
Allocated customer service cost. Every tool here that claims it is estimating from a ticket count, not reading a payroll line. I use it directionally and nothing more.
Fully loaded CAC is the other one. Matt Putra's channel analysis puts CM3 anywhere from negative 22% on Meta cold traffic to positive 77% on email and SMS. If your tool reports one blended CAC, it is averaging those two realities into a number that describes neither.
Luca AI computes this from reconciled sources rather than from a COGS column someone typed in last quarter, because accounting, 3PL, and support data connect alongside commerce and ads. Ask Luca AI which SKUs lose money once returns and support are allocated. It answers, then names the SKU trending the same way before you commit the next reorder. Our walkthrough of customer profitability analysis shows the same method applied at segment level.
Q6. What do these tools really cost once your GMV grows? [toc=6. Real Cost of Ownership]
Conjura never published pricing, since access ran through a demo only. The alternatives are transparent, and the billing basis matters more than the sticker price: Lifetimely from $49 per month on order volume, Triple Whale from about $219 on GMV, Daasity from $1,499, and Northbeam from about $1,500. GMV-based pricing means a good quarter raises your analytics bill without adding a single feature. Building your own stack instead is only rational if you already employ data engineers.
💰 The billing basis, side by side
Billing Basis and Repricing Triggers by Tool
Tool
Billing basis
What triggers a repricing
Luca AI
Flat tier (Starter €299, Growth €499)
Adding connected sources, not revenue
Triple Whale
GMV
Every revenue band you cross
Lifetimely
Order volume
Order count, not order value
Polar Analytics
Quoted, GMV-linked
Revenue growth, plus add-ons
Northbeam
Flat, quoted from $1,500
Spend tier and seat count
Daasity
Flat, from $1,499
Connector count and modeling scope
High-AOV catalogs do better on order-volume pricing. Low-price, high-volume catalogs do better on flat tiers. Run your own numbers before you sign anything annual.
📊 A twelve-month projection
Take a brand at $400K monthly GMV growing 60% over a year. On GMV-based pricing, the analytics line typically climbs through two or three bands as revenue crosses thresholds.
The feature set does not change. You pay more for the same reports because you sold more. That is the quiet tax nobody models during the trial.
🏗️ Build versus buy, with a real receipt
Building is correct under one condition: you already have data engineers on payroll and a transformation layer they maintain. Otherwise the math gets ugly fast.
Ari Tulla spent roughly $10 million and ten developers building a custom data platform at ELO Health. General purpose language models then outperformed it, so he rebuilt around them and cut engineering from ten people to two. If that is the outcome at $10 million, a $200K internal project is not the shortcut it looks like. Our comparison of reverse ETL tools for ecommerce covers what that build actually involves.
💸 The hidden line items
Implementation and onboarding time, which is payroll, not software
Connector add-ons, intraday refresh, and SQL access billed separately
Warehouse compute and storage, if you host your own
Account management gaps, which cost you weeks rather than dollars
"Shortly after onboarding we were assigned an account manager. About a month later, she was laid off and we were never assigned a new account manager. We've been attempting to get a handful of other data sources connected and the process has been long and drawn about because it can take up to a week to hear back from the Polar team." , Ben S., Director of Commercial Operations, 4-star review, 30 September 2025 Polar Analytics - G2 Verified Review
"Their onboarding process is very hard. I've been going back and forth for 29 days. They also had a DNS issue that caused some problems on the website." , Harel L., Chief Executive Officer, 1-star review, 2026 Northbeam - G2 Verified Review
⚠️ Verify the vendor's numbers against your own
Do not accept a cost figure from any platform until it reconciles to your bank and card statements. Most inventory and ops systems are open systems that never tie back to finance.
I apply the same rule to pricing quotes. One Trustpilot reviewer documented a Shopify-listed price that differed sharply from the sales quote after installation. Get the number in writing, with the repricing trigger named.
Luca AI prices on what you connect and ask, not on how much you sell, so a strong quarter does not reprice your reporting. Luca AI also removes the line item that sinks most build projects, because schemas are normalized on ingestion and there is no cleanup year. If you already run a data team and a working warehouse, buy something narrower than this whole category. The Luca AI pricing page lists every tier in full.
Q7. How do you switch without losing your history, and what should you measure first? [toc=7. Switching and First 30 Days]
Run a parallel period, never a hard cutover. Export your cost tables, COGS by SKU, and historical margin series first, because that is the hardest data to rebuild. Polar Analytics claims a 48 to 72 hour migration off Conjura, but budget two to four weeks of overlap so you can reconcile against accounting before trusting anything. In week one, instrument contribution margin by SKU, marketing efficiency ratio, CAC payback, and cohort repeat rate. Benchmark honestly: median CPA is $32.74, median AOV is $74.12, and top performers hold AOV to CPA at 2.7 or better.
📦 Step one: export before you negotiate
COGS by SKU, including landed cost history
Cost tables for shipping, fulfillment, payment fees, and returns allocation
Historical margin series at the longest range available
Every custom metric definition your team agreed on
Do this while your access is uncontested. I have watched brands start a migration with a blank history, and no new tool fixes that later.
🗓️ Step two: the schema trap nobody warns you about
Retail calendars are not standard. One brand reports on 5-5-4 weeks, another on 3-3-2, and some report invoice sales while others report demand sales. These definitions break silently during a migration.
Decide your conventions once, in writing, before the first connector goes live. Then make the new tool match them rather than the reverse. Our guide to ecommerce data management covers how to document those conventions.
✅ Step three: the reconciliation gate
Do not retire the old reports until two full cycles match your financial statements. Keep a human reviewing the reconciled figures, not the AI that produced them.
One more governance rule I would not skip. Ban free AI tiers for anything touching customer or sales data, because that data leaves your control the moment it is pasted in.
"I've been using Lifetimely for probably five years now. Before using Lifetimely, I was downloading all of my Shopify data, putting it into a complicated Excel spreadsheet, and calculating our gross and net profit. Switching to Lifetimely has been incredible." , Record Roots, Store Owner, 5-star review, September 2026 Lifetimely - Shopify App Store Verified Review
"Sometimes it does not update the numbers correctly and has errors with synchronisation." , Verified User, 3-star review, 20 April 2023 Triple Whale - G2 Verified Review
📈 Step four: four metrics, each with an alert threshold
Contribution margin by SKU, alert when any top-ten SKU drops below target
Marketing efficiency ratio, total revenue divided by total ad spend, alert on a weekly drop
CAC payback, alert when it extends past your cash conversion cycle
Cohort repeat rate, alert when a new cohort underperforms the last one
MER beats platform ROAS here because it survives long lead times, repeat purchases, and cookie loss. A metric nobody is paged about is a metric nobody acts on. If you are rebuilding your reporting set, our list of top ecommerce KPIs is the fuller version.
❌ What none of these six solve
Per-market and multi-currency profit. Operators in the r/agency and r/DigitalMarketing threads on this category describe hitting a Shopify-only ceiling, then falling back to accounting plus spreadsheets for market-level numbers. If you sell in four currencies, plan for that gap rather than assuming a demo will close it.
The other failure mode is volume without judgment. One founder generated twenty 25-page AI executive summaries of his own business, then sat there asking how he was supposed to actually use any of it. More output is not more clarity.
Luca AI maps retail-calendar and definition conflicts once at ingestion rather than leaving you to patch them in every downstream report. After go-live it runs as a standing instruction: send the CAC report every Monday with graphs and reasoning, alert Slack if MER drops below target or inventory crosses 500 units. Cohort-level vigilance, without the cohort-level dashboard. See automated data reporting in ecommerce for how those standing instructions are set up, and ecommerce monitoring tools for how the alerting side compares.
FAQ's
What are the best Conjura alternatives for e-commerce analytics in 2026?
The six alternatives worth a real evaluation in 2026 are Luca AI, Triple Whale, Lifetimely by AMP, Polar Analytics, Northbeam, and Daasity. Each one wins a different scenario, so feature count is the wrong way to choose.
Luca AI, for cross-functional reasoning across commerce, ad, retention, fulfillment, and accounting data with no SQL and no analyst.
Triple Whale, for first-party pixel attribution when paid media decides the month.
Lifetimely by AMP, for LTV, cohorts, and a daily profit and loss view on Shopify.
Polar Analytics, for brands that want a dedicated warehouse and SQL access.
Northbeam, for media mix modeling at higher ad spend.
Daasity, for omnichannel data where Amazon, retail, or wholesale carries real revenue.
Luca AI connects Shopify, Meta, Google, Klaviyo, Stripe, 3PL, and accounting sources, normalizes every schema on ingestion, then answers plain-English questions with root cause and a recommended next step. We put it first on our own list and disclosed the conflict in the scoring section.
Start by naming the one question you cannot answer today. Our roundup of e-commerce analytics platforms maps each category to the question it actually solves.
What happened to Conjura, and is it shutting down?
Conjura has not shut down. Wayflyer acquired it on 19 June 2026 and moved every Conjura employee into Wayflyer, folding the analytics stack into its small-business financing products. Conjura served more than 2,000 merchants and processed over 135TB of data annually before the deal closed.
There is no emergency, but there are two things a founder or CFO should weigh:
Roadmap risk. Analytics is now a feature inside a lending business rather than the product the company sells.
Structure. Your analytics vendor is now owned by the lender that underwrites you using the same data. Nothing improper is implied. You should simply know the structure before you renew.
The detail almost nobody reports is that Wayflyer was originally incubated inside Conjura back in 2019, so this is the child acquiring the parent.
Our read is that most Conjura users should run a parallel evaluation rather than a hard cutover, and should export COGS by SKU plus every cost table while access is uncontested. For the wider picture on how intelligence and funding are converging, see our breakdown of revenue-based financing.
How much do Conjura alternatives cost per month?
Conjura never published pricing, since access ran through a demo only. The alternatives are more transparent, and the billing basis matters far more than the sticker price.
Lifetimely by AMP, from about $49 per month, billed on order volume.
Triple Whale, from about $219 per month, billed against GMV.
Polar Analytics, quoted and GMV-linked, with add-ons for SQL access and intraday refresh.
Daasity, from about $1,499 per month.
Northbeam, from about $1,500 per month, quoted through a sales call.
Luca AI, flat tiers at Starter and Growth, with a custom Scale tier.
GMV-linked pricing is the trap. A good quarter pushes you through two or three revenue bands and raises the bill without adding a single feature. High-AOV catalogs usually do better on order-volume pricing. Low-price, high-volume catalogs usually do better on flat tiers.
Luca AI prices on what you connect and ask rather than on how much you sell, so a strong quarter does not reprice your reporting. Before signing anything annual, model twelve months of growth against each billing basis, then get the repricing trigger named in writing. Current tiers are listed on our pricing page.
Which Conjura alternative gives true SKU-level contribution margin?
Four of the six model the full cost stack, and two quietly stop short. Gross margin only tells you what it costs to make the thing, never what it costs to sell it.
Lifetimely, yes. Refunds and COGS are native profit and loss lines.
Polar Analytics, yes, from CM1 to CM3 on your own cost inputs, though there is no dedicated returns report.
Daasity, yes, but only if you model the costs in the warehouse yourself.
Triple Whale, partly. COGS inputs exist, but there is no accounting connection, so allocated support and reconciled fees stay outside.
Northbeam, no. COGS never reaches a report, so there is no contribution margin view at all.
Two numbers decide this test. Returns run at 19.3% of online sales, and platform-reported Meta CAC lands at $38 to $58 against a fully loaded $212 to $230. A tool that cannot net returns or load acquisition cost honestly reports fiction.
Luca AI computes margin from reconciled sources rather than a COGS column someone typed in last quarter, because accounting, 3PL, and support data connect alongside commerce and ads. Our guide to contribution margin versus gross margin walks through all eight line items.
How long does it take to migrate off Conjura without losing history?
Polar Analytics claims a 48 to 72 hour migration off Conjura. Plan for two to four weeks of overlap anyway, because the limiting factor is reconciliation, not connector setup.
Run a parallel period rather than a hard cutover, in this order:
Export first. COGS by SKU with landed cost history, cost tables for shipping, fulfillment, payment fees, and returns allocation, your longest available margin series, and every custom metric definition.
Fix conventions before connecting. Retail calendars are not standard. Decide 5-5-4 versus 3-3-2, and invoice sales versus demand sales, in writing.
Hold a reconciliation gate. Do not retire old reports until two full cycles match your financial statements, with a human reviewing the figures rather than the AI that produced them.
Skip the export step and your next tool starts with a blank history, which no migration fixes later.
Luca AI maps retail-calendar and definition conflicts once at ingestion instead of leaving you to patch them in every downstream report, which is the difference between a two-week migration and a two-quarter one. For the documentation side of this, see our guide to e-commerce data management.
Enjoyed the read? Join our team for a quick 15-minute chat — no pitch, just a real conversation on how we’re rethinking Ecommerce with AI - Luca
Loading Schedule...
Your AI Co-Founder is here.
Here’s why:
Shopify, Meta, Xero - one brain.
"Should I scale?" Answered with real data.
Growth capital. No applications. One click.
Thank you! Your submission has been received! Please book a time slot for the Meeting
Oops! Something went wrong while submitting the form.