Beyond Text2SQL: Evaluating Data Agents on Your Own E-Commerce Data
12
mins read
TL;DR
Adoption of AI in DTC has outrun verification, so the real risk is a plausible wrong number driving a five-figure allocation decision.
Text2SQL execution accuracy collapses from roughly 91 percent on academic schemas to about 21 percent on enterprise warehouses and near zero on BEAVER.
Score eight metrics, and treat repeatability, latency, and cost per answer as the three that decide production readiness.
Most wrong numbers are definitional, caused by excluded zero-value orders, order edits dated to the original order, and blended cost averages.
Run hybrid evaluation: deterministic fact checks first, then a weighted reasoning score across intent, depth, actionability, and clarity.
Ship in three stages, read-only first, and re-run your ten-question set after every model update, schema change, or new connector.
Q1. Why do most stores trust an agent they have never tested? [toc=1. The Trust Gap]
Because adoption ran ahead of verification. Roughly 93.5% of surveyed DTC brands already use AI, only about 60% have anyone who owns it, and trust is the barrier operators name most often. Evaluating AI data agents closes that gap: instead of judging how confident an answer sounds, you test it against a number you already know is true.
💰 The $50K question nobody stress-tests
A Head of Growth I worked with last quarter had one Slack thread open and $50,000 of Q4 budget sitting in it. She asked her agent which collection was driving the best return on ad spend, meaning revenue divided by ad spend. It answered in four seconds, with a chart.
Nobody in that thread asked how the agent defined revenue. That is the part that costs money, and it is the same gap that shows up across most ecommerce analytics platforms.
⚠️ Adoption is solved, verification is not
The DTC Newsletter and Triple Whale survey of 875-plus brands found 93.5% already using AI, with only about 60% assigning anyone to own it. Trust was the blocker operators named most. Those two facts sit badly together.
I have seen the same pattern inside our own stack. An inventory system shipped its own AI forecasting module, and it started inventing numbers. We shut it down, because it was hallucinating and telling fibs about stock we could physically count.
❌ The failure mode is plausibility, not error messages
A broken agent is easy. It throws an error, and you move on. A dangerous agent returns a clean number that is wrong by 11%, and you allocate against it.
The dangerous failure is not an error message. It is a clean number nobody traced before the money moved.
Merchants have documented exactly this. One Shopify seller wrote up days lost to confidently wrong AI answers, and another migrated platforms after months of hallucinated technical data.
"Data is inaccurate when it comes to Daily Total Sales and Returning Orders figures. Tickets have been opened since the start of January 2021 with barely any response whatsoever." - Verified User, startup Supermetrics - G2 Verified Review, 2.5/5
"Some data we still notice discrepancies between platforms, for example, tracking ads, and differences in the reported metrics like revenue." - Verified User Triple Whale - G2 Verified Review, 4/5
Read that second one carefully. It is a four-star review. The tool is genuinely good, and the numbers still drift, which is why operators keep searching for Triple Whale alternatives.
✅ What testing an agent actually means
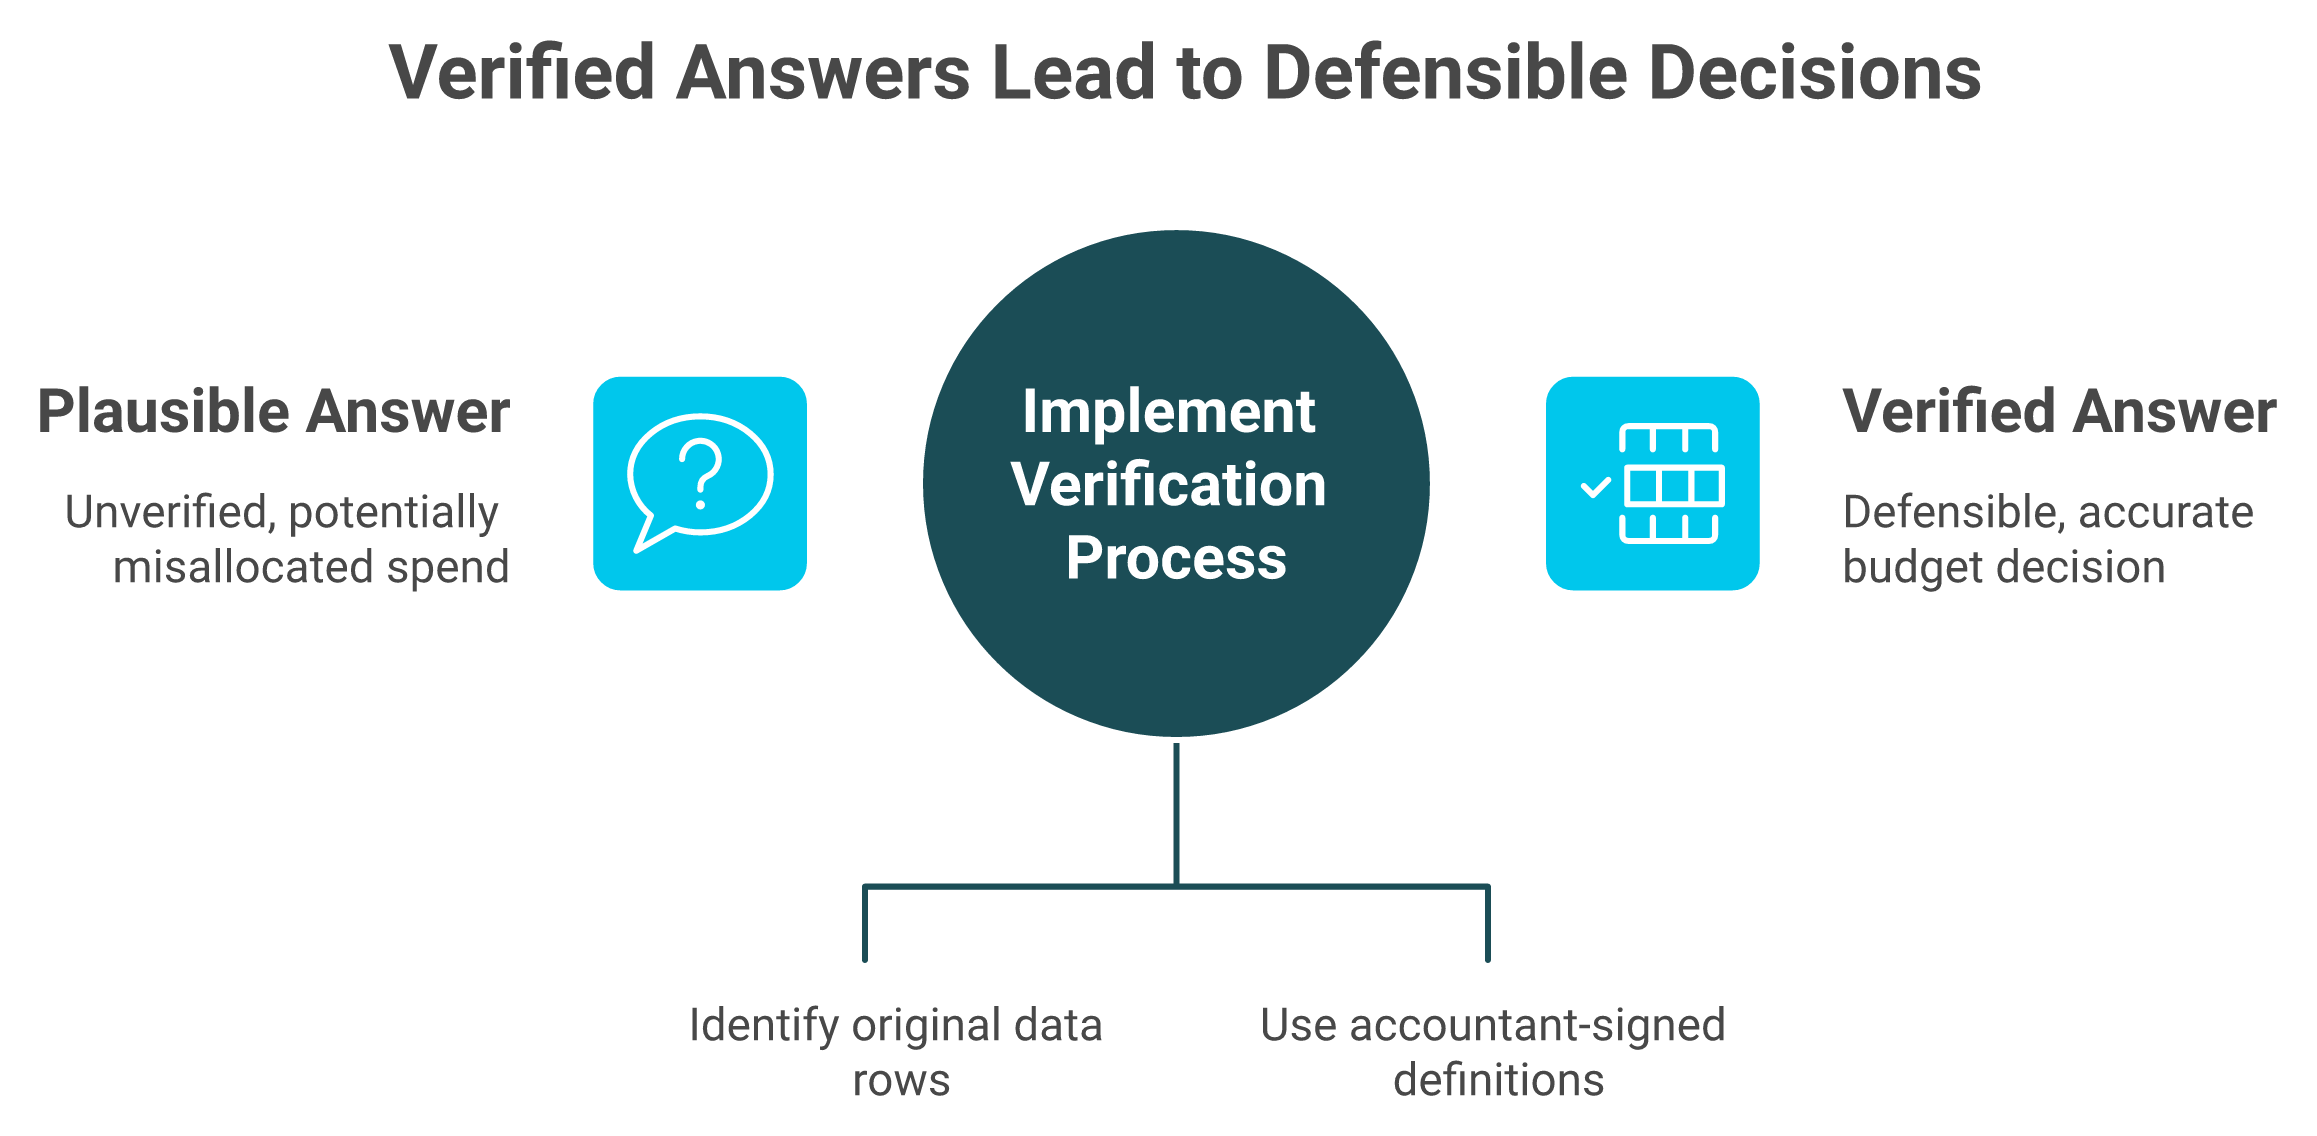
Testing does not mean reading the answer and nodding. It means holding the agent against a number your accountant already signed off on.
Luca AI treats every answer as auditable output, exposing the sources and definitions behind the number rather than the chart alone. That design choice matters more than model quality, because a number you cannot trace is a number you cannot defend in a budget meeting.
Three things carry the rest of this article. A published accuracy cliff that explains why demo performance never survives your schema. A two-layer test you can run this week on a closed week of books. A pass gate, so you stop debating and start scoring.
⏰ Where this leaves your Monday
Pick one number your business runs on. Write down, in one sentence, how it is calculated. Then ask your agent for it, and compare.
Luca AI normalizes and standardizes data on ingestion, which is why definitions stay fixed between questions, and my read is that this is the boring half of accuracy nobody demos.
Q2. What does Text2SQL measure, and where does it collapse? [toc=2. Benchmark Accuracy Cliff]
Text2SQL benchmarks measure execution accuracy: does the generated query return the same rows as a gold query. Best systems clear about 91% on Spider 1.0 and around 73% on BIRD, then fall to roughly 21% on Spider 2.0 and near zero end-to-end on MIT's BEAVER. Your multi-source commerce stack behaves like the harder case, not the textbook one.
📊 Execution accuracy, in plain English
Text2SQL means turning a plain-English question into a database query. Execution accuracy is the score: run the generated query, run the correct one, compare the rows.
It is a real test, and it is a narrow one. It says the query fetched the right rows. It says nothing about whether the rows meant what you assumed, which is the gap conversational analytics for ecommerce has to close.
⭐ The cliff, with sources attached
Here is the part that should change how you read a vendor deck. The same class of model swings by 70 points depending on whose database it touches.
Text2SQL Benchmark Results by Schema Type
Benchmark
Best published result
What it tests
Source
Spider 1.0
~91%
Clean academic schemas
Compiled benchmark roundup
BIRD
~73%
Dirtier, larger academic data
Compiled benchmark roundup
Spider 2.0
~21%
Real enterprise warehouses
Compiled benchmark roundup
BEAVER
near 0% end-to-end
Live enterprise warehouse, real queries
BEAVER, MIT (arXiv:2409.02038)
BEAVER is the one to sit with. Frontier models scored close to zero end-to-end on an actual company's warehouse.
⚠️ Why your store is the hard case, not the easy one
A typical $1M to $5M store carries 40-plus tables once Shopify, Meta, Google, Klaviyo, and an accounting tool are connected. Column names repeat with different meanings. Refunds land in two places.
That is structurally the Spider 2.0 and BEAVER situation, not the Spider 1.0 one. Your demo felt great because the demo dataset was clean, and real ecommerce data integration is never that tidy.
✅ The lesson: structure, not model
One operator I trust put the diagnosis better than I could. The modeling layer, he argued, has never really been there, which is why people ended up clueless with descriptive KPIs and dashboards and no answer to "so what."
Published vendor research points the same direction. Accuracy climbs from roughly 10-20% on raw schemas to 90-99% once definitions and business context are layered in. The model barely moves. The scaffolding does.
Luca AI measures this by resolving commerce metric relationships in a modeling layer beneath the chat surface, and we treat that layer, not the model choice, as the accuracy variable.
💸 What to do with this before your next demo
Ask any vendor for their execution accuracy on a schema like yours, not their benchmark number. If the answer is a Spider score, you have learned something.
Then hand them three questions that cross sources. Orders plus ad spend plus refunds is where the cliff shows up, every time.
Luca AI sits as an AI layer over your warehouse rather than a query generator bolted to an API, which is precisely the structure these benchmark results punish when it is missing.
Q3. Which metrics actually tell you an agent is production-ready? [toc=3. Metrics That Matter]
Score eight: execution accuracy, semantic accuracy against your own metric definitions, groundedness, hallucination rate, tool-call accuracy, trajectory quality, repeatability, and cost per answer. The last three decide production readiness. Luca AI answers against a fixed semantic model, so a repeated question returns a repeated number rather than a fresh interpretation each time.
📋 The eight metrics, and what failure looks like
Most evaluation guides list four of these. The three at the bottom are the ones that decide whether the agent survives contact with a Monday.
Eight Evaluation Metrics for AI Data Agents
Metric
What it means
Failing looks like
Execution accuracy
Query returns the right rows
Wrong rows, right-looking chart
Semantic accuracy
Matches your definition of the metric
Correct query, number Shopify disagrees with
Groundedness
Every claim traces to retrieved data
Confident sentence with no source row
Hallucination rate
Share of answers with invented facts
Cited a campaign that does not exist
Tool-call accuracy
Picks the right source and function
Pulled Meta spend when asked for Google
Trajectory quality
Sensible reasoning path
Six detours to a right answer
Repeatability
Same question, same number
Tuesday's figure differs from Monday's
Cost per answer
Dollars and seconds per question
Four minutes, two dollars, one question
Groundedness and trajectory scoring come straight from the agent evaluation literature. The commerce-specific part is applying them to a P&L line, the same discipline behind solid ecommerce KPIs.
🔁 The ask-it-three-times test
Ask the same question on three separate days. Nothing in your data changed, so nothing in the answer should.
If the number moves, the agent is not evaluable. You cannot score something that will not hold still, and you certainly cannot defend it to a CFO.
Twenty years of BI review history says this is not a hypothetical. One retail operator wrote that sampling made it hard to trust the numbers at all, which complicates decision-making.
"It is becoming very opaque... To make decisions based on grounded data, it is really difficult to trust it 100% and it complicates decision-making." - Verified User in Retail Google Analytics - G2 Verified Review, 1.5/5
Luca AI answers against one fixed semantic model, and our reason is narrow: repeat questions must return repeat numbers before anything else is worth measuring.
⏱️ Speed is a correctness feature
This is the part I will argue hardest. A correct answer nobody waits for gets replaced by a gut call.
One operator described tasks that would take two weeks landing in 90 seconds. Another calculated net profit for a single delivery region in five minutes, where previously it meant emailing an expert and waiting two days.
Set thresholds before you test. Under 60 seconds for a single-source question, under three minutes for a multi-source one, and a known cost per query.
✅ Your scoring sheet
Run all eight against ten questions, and record the number, the seconds, and the cost. Three columns, one sheet, and it belongs alongside your regular ecommerce reporting.
Luca AI pushes scheduled reports with reasoning and charts into Slack or email, which turns latency into something you measure once rather than absorb weekly.
Q4. Why don't the agent's numbers match your Shopify admin? [toc=4. Definition Drift]
Usually definitional, not technical. Tools exclude $0 first orders from cohorts, apply global filters, and book post-purchase order edits to the original order date, so a perfectly correct query still returns a different number than Shopify. Luca AI resolves these definitions once at ingestion, which turns a variance into a named rule instead of a standing argument.
🎯 The claim: your agent is not lying, it is using a different dictionary
The instinct is to blame the model. Nine times out of ten, the SQL was fine.
The definitions disagreed. Your admin counts one thing, the tool counts another, and both are internally consistent. That is the quiet failure mode inside most Shopify analytics dashboards.
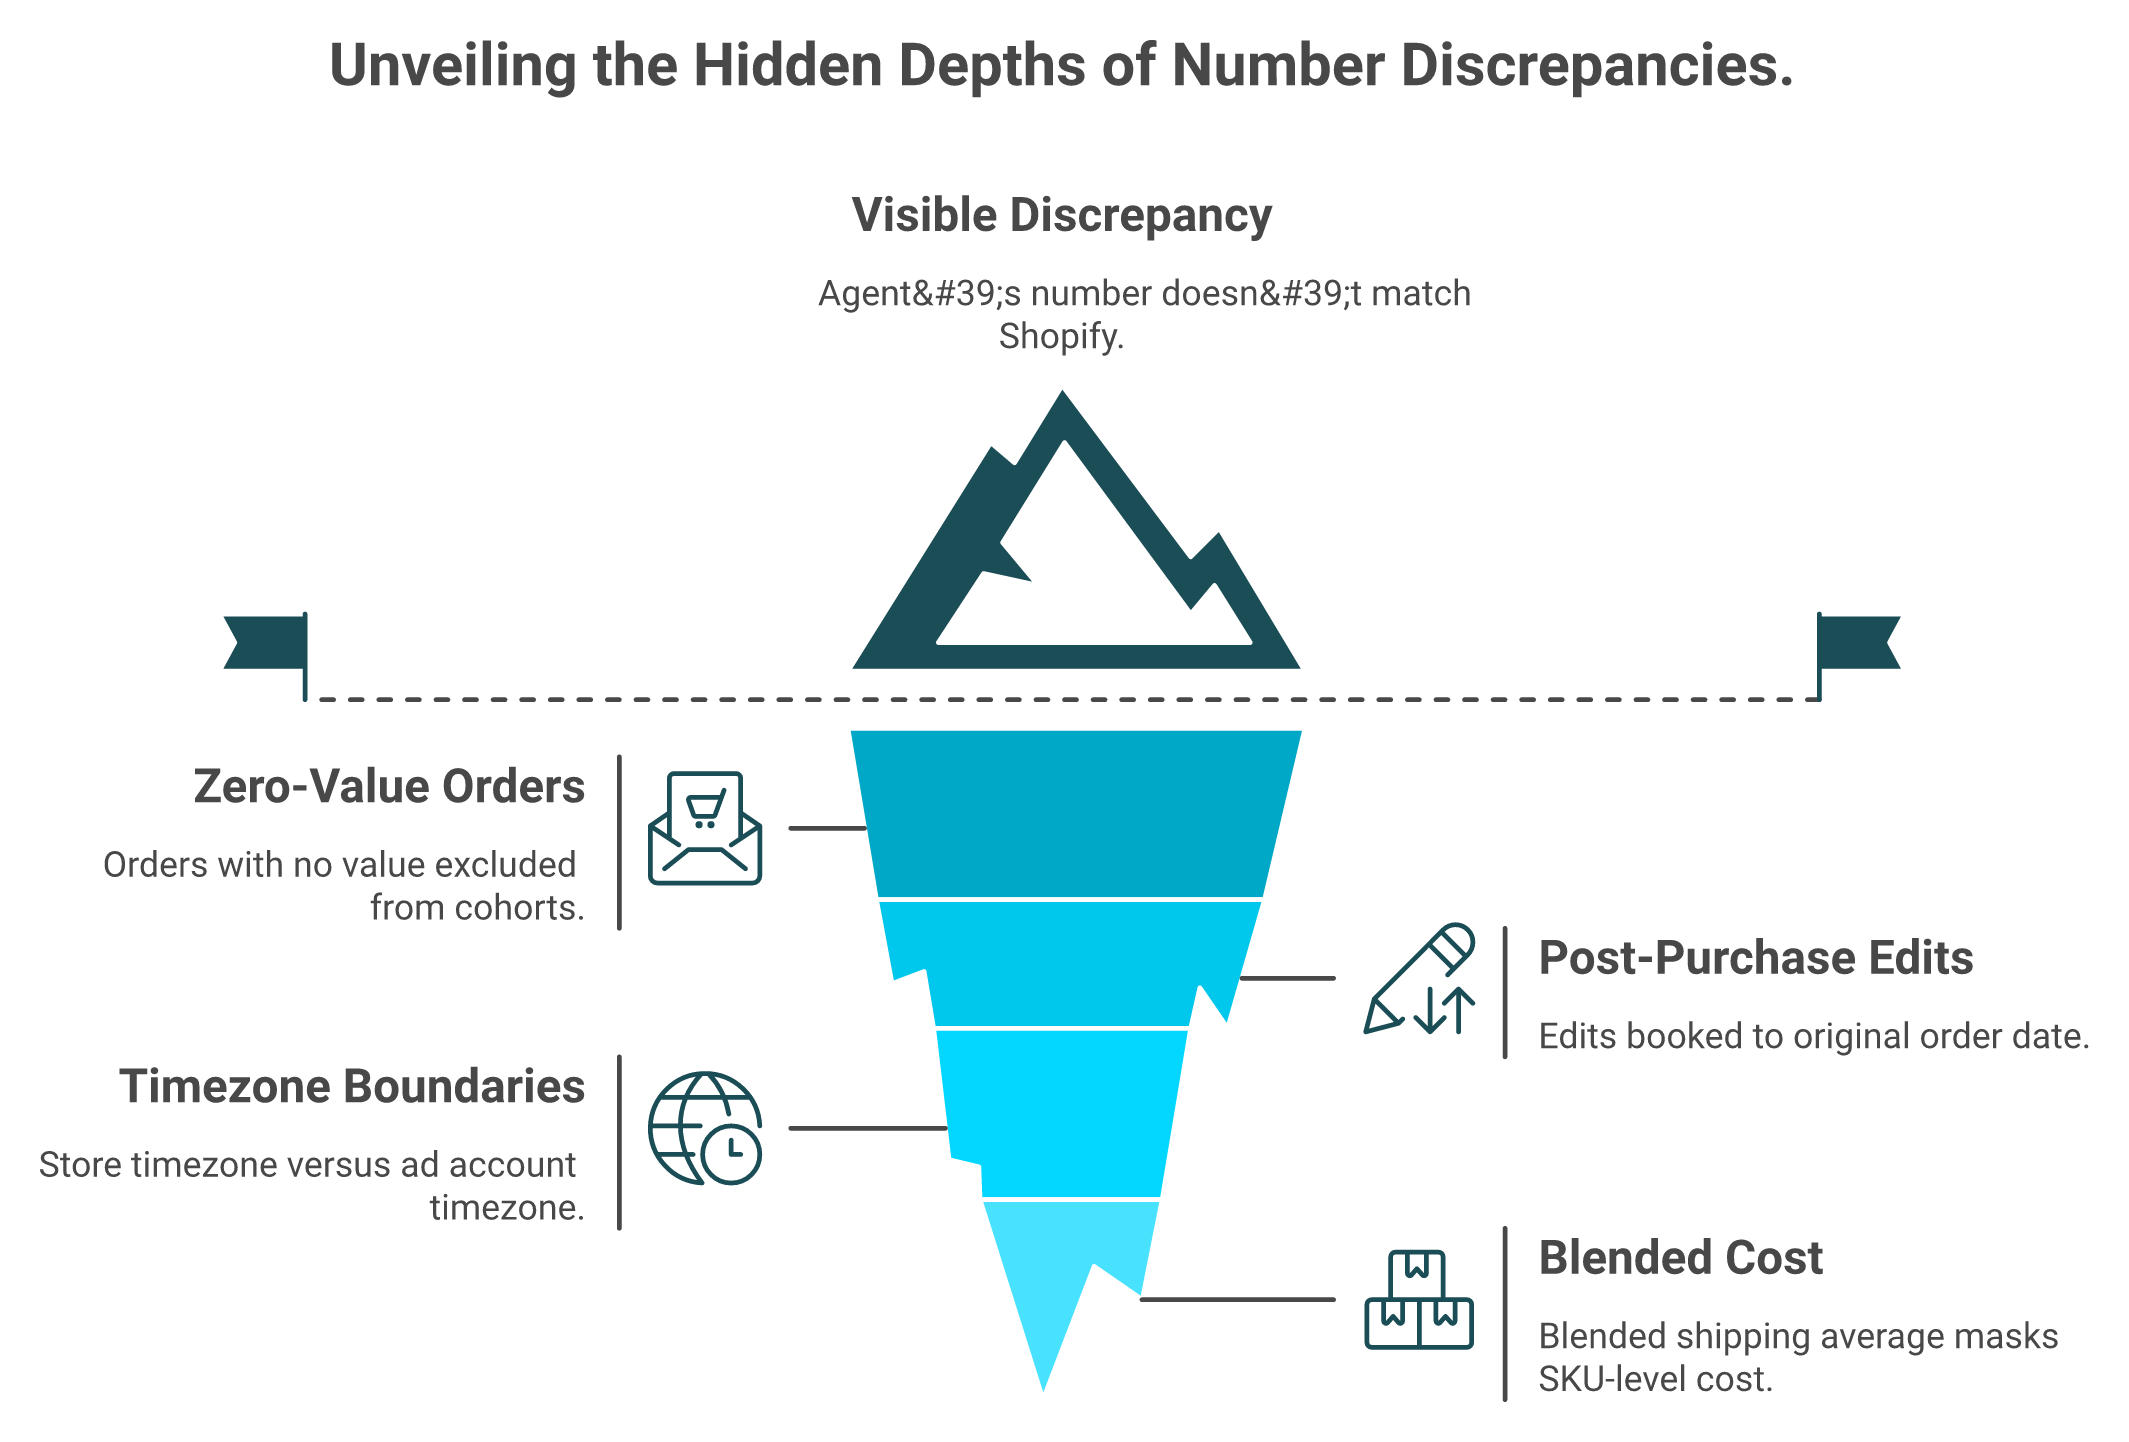
The mismatch you notice is the tip. The four rules underneath it are where the margin actually disappears.
⚠️ The four usual culprits
Vendor documentation is the best evidence here, because vendors publish these gaps themselves.
$0 and missing-ID orders. Cohort tools exclude first orders with no value or no customer ID, while Shopify counts them.
Post-purchase order edits. Edited orders get booked to the original order date, so a day's sales shift after the fact.
Timezone boundaries. Your admin closes the day in store time, the ad platform closes in account time.
Blended versus SKU-level cost. One shipping average across every product hides the product that is bleeding.
That last one is the expensive one. A founder I sat with was certain her best seller carried a 72% gross margin. Twenty minutes into a line-by-line contribution margin rebuild, using her real shipping, returns, and support costs, the number was 8%.
📈 Context beats model choice
Published research on enterprise text-to-SQL shows accuracy rising from roughly 10-20% on raw schemas to 90-99% once definitions, business rules, and tribal knowledge are supplied. Same models, different scaffolding.
Polar Analytics makes the operator version of this argument. When every tool computes return on ad spend and customer acquisition cost differently, agents make confident decisions on wrong numbers.
Reviewers describe the symptom without naming the cause.
"Triple Whale will attribute more revenue to the email that was sent out, but the platform will attribute more revenue to the SMS that was sent out." - Verified User Triple Whale - G2 Verified Review, 4/5
✅ Build the dictionary, then buy the agent
A semantic layer is just a written, shared definition of each metric that every tool reads from. Nothing more mystical than that, and it is the foundation of real ecommerce business intelligence.
Ask each team to write plain-English definitions of the ten metrics you run on. Then diff them. Marketing and finance will disagree on at least three, and that disagreement is your real accuracy problem.
Someone has to own the file. My read is that it belongs to whoever closes the books, not whoever buys the media, and clean ecommerce data management makes that ownership possible.
Luca AI normalizes and standardizes data on ingestion so one definition set spans every connected source, and we would rather argue about a rule once than about a number every week.
Q5. How does hybrid evaluation separate facts from reasoning? [toc=5. Hybrid Evaluation Method]
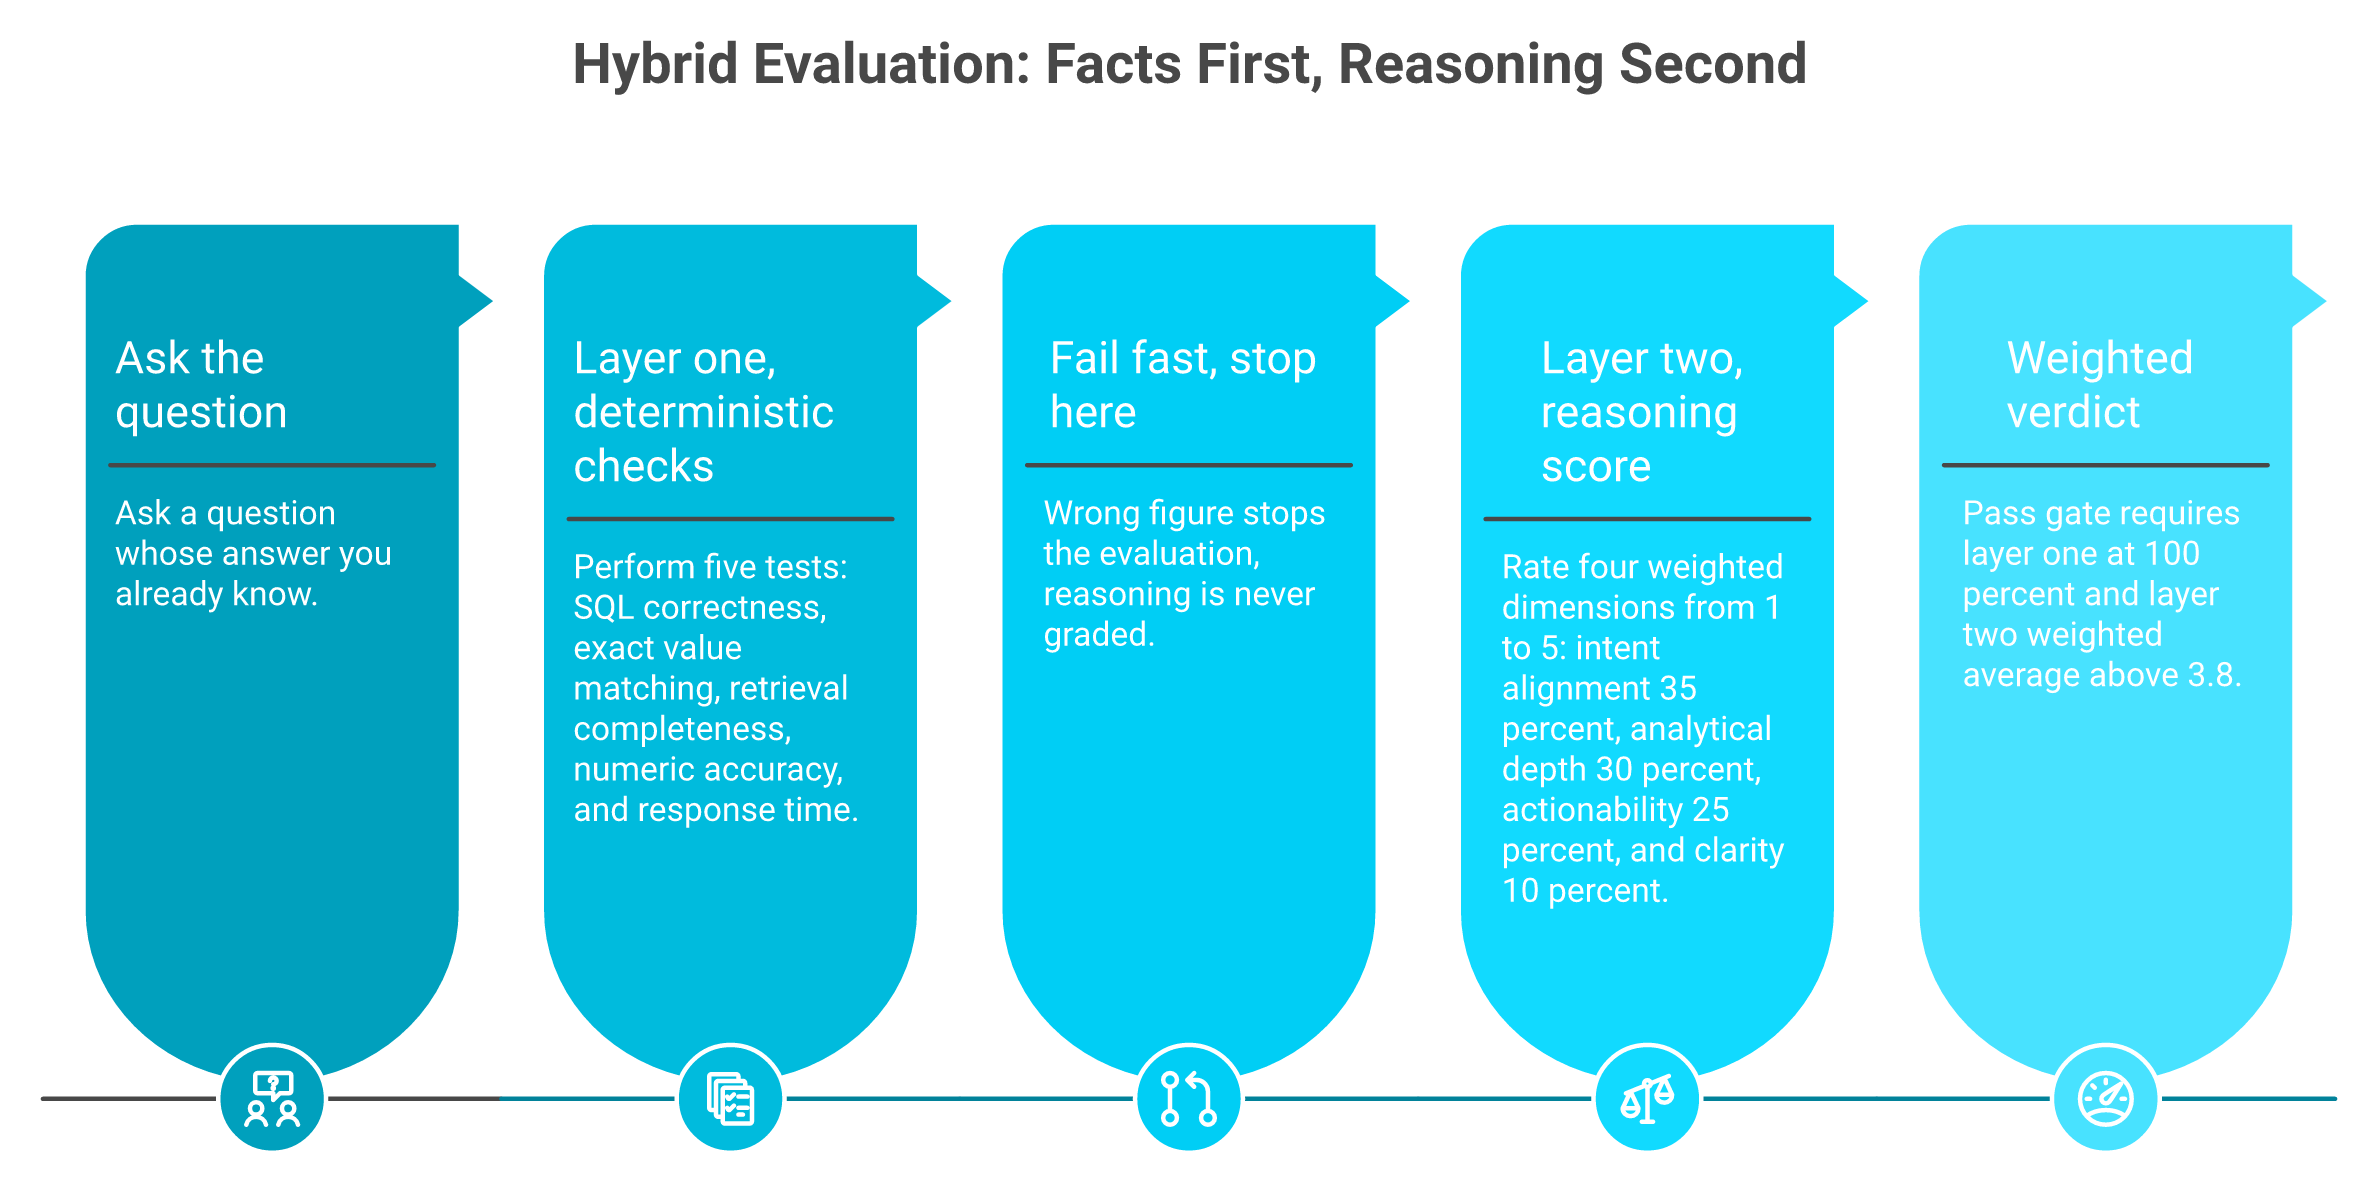
Run deterministic tests first, reasoning tests second. Layer one validates SQL correctness, exact value matching, retrieval completeness, and numeric accuracy on ROAS and cohorts. Layer two scores usefulness on intent alignment (35%), analytical depth (30%), actionability (25%), and clarity (10%), each rated 1-5. Unit tests alone miss bad reasoning. LLM judges alone miss factual errors.
❌ Three traps operators fall into
Most teams pick one testing method and stop. Each single method fails in a specific, predictable way.
Only unit tests. Checks the number, misses that the agent answered a different question.
Only an LLM judge. One model grading another. Reads well, and it cannot catch a wrong figure.
Only manual review. Accurate, and it dies the week you have 40 questions.
Hybrid evaluation means running the first two in order, with the cheap check first.
Cheap factual checks run first. Only answers that survive them earn a reasoning score.
✅ Layer one: fail fast on facts
Layer one is deterministic, meaning the test has one correct answer and no opinion. Five checks: SQL correctness, exact value matching, retrieval completeness, numeric accuracy on ROAS and cohorts, and response time.
If a number fails here, stop. Grading the reasoning behind a wrong figure wastes your afternoon, and it is the fastest way to lose faith in ecommerce data analytics altogether.
⭐ Layer two: score whether it was useful
Once the facts hold, judge the thinking. Four weighted dimensions, each scored 1 to 5.
Layer Two Reasoning Scorecard for Data Agents
Dimension
Weight
What you are checking
Intent alignment
35%
Did it answer the real question, not the literal one
Analytical depth
30%
Correct segmentation and sound statistical reasoning
Actionability
25%
Can you make a decision from this today
Clarity
10%
Can you follow how it got there
This weighting comes from published hybrid-testing work on data agents. Trajectory and groundedness scoring in the broader agent literature follow the same logic.
💰 The worked example that makes it click
Ask: which products should I increase ad spend on based on last month's performance?
Response A: increase budget on the Winter Coat Collection. It generated $45K revenue at 4.2 ROAS on Google versus 2.8 on Facebook. Google Shopping converts 2.3 times better. 340 units remain with a 45-day sell-through. Shift $8K per week toward Google Shopping, prioritizing the Puffer Jacket and Wool Overcoat at 5.1 ROAS.
Response B: the Winter Coat Collection performed well. Google ROAS 4.2, Facebook 2.8, revenue $45K.
Both pass layer one. Response A scores 4.7 out of 5 on the judge, and Response B scores 2.3.
⚠️ Correct is the floor, not the product
Response B is not wrong. It is useless, which costs you the same as wrong.
One founder ran deep cohort analyses through a terminal agent and got 20 executive summaries, each 25 pages. His reaction was the honest one: how do I actually use this?
Luca AI surfaces the influencing components and root cause behind a metric move, not the metric alone, and my read is that this second layer is where most agents for ecommerce quietly fail.
⏰ Running it without a data team
Ten questions, two layers, one spreadsheet. Columns for the number, pass or fail, and four judge scores.
Set your gate before you start. My rule is layer one at 100%, and a layer-two weighted average above 3.8.
Luca AI is graded on both layers internally, because a correct number with no recommendation is a report, and reports are what we were trying to escape.
Q6. Which ten questions belong in your own evaluation set? [toc=6. Your Ten Questions]
Ten questions you already know the answers to: three single-source lookups, four two-source joins, and three multi-source causal questions. Include contribution margin by SKU, new customer count for a closed week, blended versus channel CAC, day-90 cohort LTV, and refund-adjusted ROAS. Luca AI reasons across Shopify, Meta, Google, Klaviyo, accounting, and 3PL data in one thread, which is where the source count usually breaks agents.
📝 Build it from answers, not questions
Do not start with clever questions. Start with numbers your bookkeeper already confirmed.
An evaluation set is only useful when you know the right answer in advance. Published Shopify evaluation protocols say the same thing, and none of them publish the actual list.
✅ The ten, ordered by difficulty
Copy this into a sheet. Fill the known answer column before the agent sees anything.
Ten-Question Evaluation Set for Your Store
#
Question
Sources touched
Tolerance
1
Total sales for last closed week
Shopify
0%
2
Units sold of your top SKU last month
Shopify
0%
3
New customer count for last closed week
Shopify
0%
4
Meta ad spend versus Shopify revenue, last 14 days
Shopify, Meta
1%
5
Blended CAC versus channel CAC last month
Shopify, Meta, Google
2%
6
Email-attributed revenue last month
Shopify, Klaviyo
3%
7
Contribution margin by SKU, top 10 products
Shopify, accounting, 3PL
5%
8
Day-90 cohort LTV for the January cohort
Shopify
3%
9
Refund-adjusted ROAS by campaign last month
Shopify, Meta, Google
5%
10
Google CPA rose 30%. Decline or audience shift?
Shopify, Google, Klaviyo
Judged
⚠️ Watch the degradation happen
Questions 1 to 3 will pass. Almost every tool passes single-source lookups.
Watch questions 7, 9, and 10. Three sources, definitional traps, and real reasoning. That is where the accuracy cliff from published benchmarks shows up on your own data, and where Shopify LTV math usually starts drifting.
💸 Two questions worth stealing
Two archetypes separate a query tool from a reasoning tool.
"Which product bundles should we create based on shopping behavior and current inventory levels?" Needs basket analysis, stock constraints, and margin logic together.
"Our Google CPA increased 30%. Is this performance decline or audience shift?" Needs cohort work and LTV projection, not a single metric.
Ask Luca AI either one and the answer arrives with the contributing factors ranked, which is the part a chart cannot do.
⏰ The 8 out of 10 gate
Eight correct is a pass. Ten is suspicious, because it usually means your questions were too easy.
Below eight, do not negotiate. Run it again after the vendor fixes definitions, and keep the same ten questions forever.
Re-run the set after any model update, schema change, or new connector. Twenty minutes, quarterly.
Luca AI connects sources through 200-plus native connectors and normalizes them on ingestion, so questions 7 through 10 run against one definition set rather than three, which is the whole point of proper ecommerce platform integration.
Q7. How do you reconcile the agent against a closed week? [toc=7. Reconciliation Test]
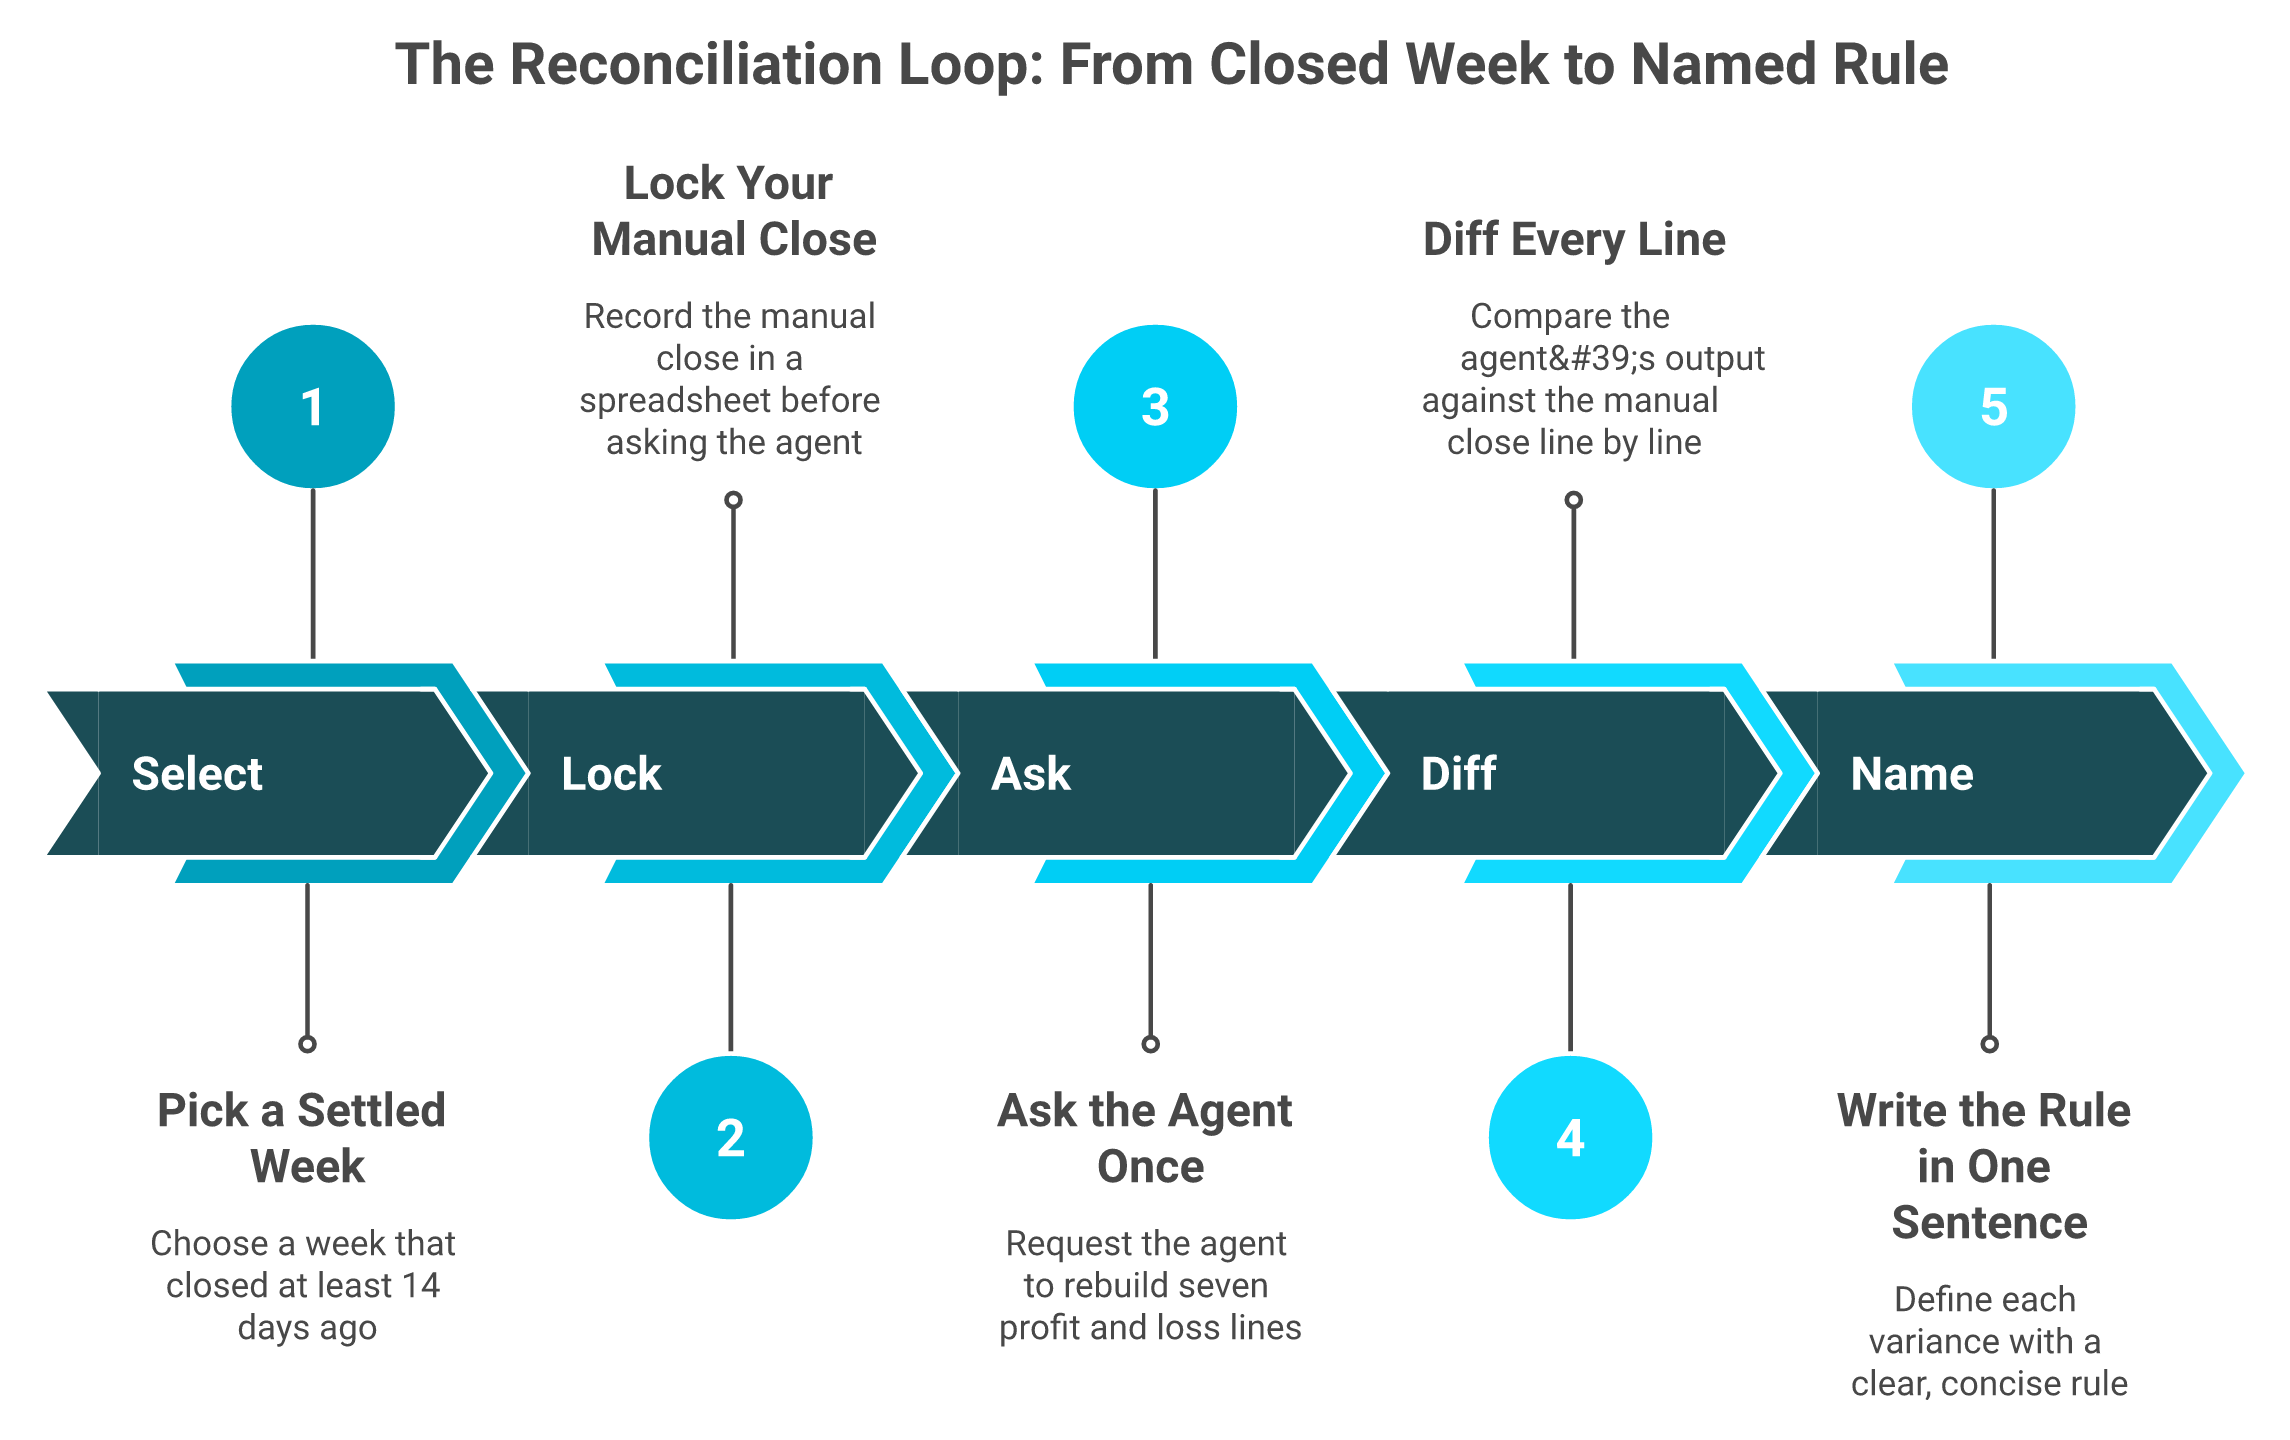
Take your last fully closed week. Have the agent rebuild revenue, discounts, refunds, shipping, COGS, ad spend, and contribution margin, then diff every line against your manual close. Revenue variance above 3% or margin variance above 8% is a fail. Luca AI exposes the query and source rows behind each line, so a variance resolves into a named rule.
📋 Setup: pick a week nobody will edit
Use a week that closed at least 14 days ago. Refunds and order edits need time to settle.
Lock your manual close in a sheet first. Then ask the agent, once, for the same seven lines.
Reconciliation is a repeatable loop. Every gap you find should end its life as a one-sentence rule.
⭐ The variance table
Run the diff line by line. Published Shopify evaluation guidance puts the acceptable band at 3% on revenue and 8% on margin.
P&L Reconciliation Tolerances and Common Causes
P&L line
Tolerance
Common cause of a diff
Gross revenue
3%
Timezone and order-edit dating
Discounts
2%
Automatic versus code discounts
Refunds
3%
Refund dated to original order
Shipping cost
5%
Blended average instead of actual
COGS
3%
Landed cost missing duty or freight
Ad spend
1%
Account timezone mismatch
Contribution margin
8%
All of the above, compounding
⚠️ Every diff is a rule, not a mystery
Take each variance and write the rule in one sentence. "Refunds are booked to the original order date" is a rule you can live with.
If you cannot name the rule, the agent is not showing its work. That is a failure of the tool, not your accounting.
Reviewers have documented this exact wall for years.
"It has pretty substantial limitations for ecommerce tracking and often isn't close to accurate for conversion rate, number of orders, or revenue." - Verified User in IT and Services Google Analytics - G2 Verified Review, 1.5/5
"Some data we still notice discrepancies between platforms, for example, tracking ads, and differences in the reported metrics like revenue." - Verified User Triple Whale - G2 Verified Review, 4/5
💸 What the reconciliation usually reveals
Contribution margin is where it hurts. A founder I sat with was certain her hero product ran a 72% gross margin.
We rebuilt it line by line using her real shipping, returns, and support costs. Twenty minutes later she was in tears, looking at 8%, a gap that only shows up in honest ecommerce profit margins work.
Nothing in her Shopify admin was wrong. She had never subtracted the parts that live in other systems.
✅ When the agent cannot show its work
Ask for the query and the source rows. A tool that answers with only a number has failed the test.
Luca AI acts as a single source of truth across connected sources, and we would rather hand you a traceable row than a confident total.
⏰ Your first hour on Monday
Pull last month's closed week. Build the seven-line sheet. Ask once, diff once, and name every rule you find.
Luca AI runs this reconciliation off normalized ingested data, which is why a second run the following week produces the same numbers rather than a new argument.
Q8. What separates a data agent from a dashboard with a chat box? [toc=8. Agent vs Dashboard]
Four tests. Does it reason across sources or query one at a time. Does it hold your metric definitions or recompute per tool. Does it surface anomalies unprompted or wait to be asked. Does it end at a chart or a recommendation with a root cause. Luca AI is an AI layer over your warehouse that traces root cause across sources, rather than a chat box added to a dashboard.
⚠️ The problem: everyone shipped a chat box
Every analytics tool added AI in the last two years. Almost none rebuilt what sits underneath.
That matters because a chat box over per-tool definitions produces confident answers on inconsistent numbers. Polar Analytics makes this argument directly, and they sell dashboards.
❌ Where the pain actually shows up
You ask the same question in two tools and get two answers. Then you triangulate manually, at 11pm, before a budget call, which is exactly the loop a proper e-commerce tech stack should remove.
Reviewers describe the loop clearly.
"Much of my time spent within Supermetrics is spent manually finding and fixing errors from expired auth tokens or date formats changing randomly." - Verified User Supermetrics - G2 Verified Review, 2.5/5
"It is becoming very opaque... To make decisions based on grounded data, it is really difficult to trust it 100%." - Verified User in Retail Google Analytics - G2 Verified Review, 1.5/5
✅ The four-test comparison
Run these four tests in any demo. Ten minutes, no technical skill needed.
Data Agent Versus Dashboard Versus General Assistant
One operator put it in a way I keep repeating. Predefined dashboards used to be our YouTube, and humans are bad at digesting raw metrics.
The data is for the model to digest. The human-readable visualization is a courtesy, not the substance, which is worth remembering before you build another ecommerce analytics dashboard.
Luca AI replaces the junior analyst layer by drawing relationships between metrics across sources, and I think that framing is more honest than calling it a dashboard upgrade.
❌ Who should not buy an agent yet
This is the part vendors skip. An agent is the wrong purchase if you are below roughly $1M in revenue.
You need enough history for pattern detection. Marketplace-only sellers and pure B2B stores also get less from it, because the data shape is different.
Luca AI fits stores in the $1M to $5M range that have piling data and no analyst, and below that I would honestly tell you to wait. If you are weighing options first, start with the best Shopify analytics apps and revisit an agent once the data volume justifies it.
Q9. What should you make a vendor prove in the demo? [toc=9. Vendor Demo Script]
Make them run your ten questions live, on your data, in the demo. Then ask: what is your execution accuracy on a schema like ours, where do metric definitions live and who edits them, how does the agent learn from a correction, what happens when we edit an order, can we see the query it ran, and what is the read-only rollout path. Luca AI resolves definitions in one normalized layer at ingestion, which makes that fourth question answerable rather than deflected.
📋 One rule before the call
Send your ten questions 48 hours ahead. Ask them to run those, not their demo dataset.
A vendor who declines has answered the question. That is not cynicism, it is time management, and it saves you a quarter of wasted ecommerce data analytics onboarding.
✅ The eight questions, and the bad answers
Score each one. A vague answer is a data point, not a delay.
Run our ten questions live now. Bad answer: "we'll follow up with a custom deck."
What is your execution accuracy on a schema like ours? Bad answer: a Spider benchmark score.
Where do metric definitions live, and who can edit them? Bad answer: "the AI figures it out."
What happens when we edit an order after purchase? Bad answer: silence, or "it syncs."
How does the agent learn when we correct it? Bad answer: "it learns automatically."
Can we see the query it ran? Bad answer: "that's under the hood."
Ask the same question twice. Do we get the same number? Bad answer: "why would it change?"
What is the read-only rollout path? Bad answer: "you can go live day one."
Published evaluation frameworks for ecommerce agents cover integration depth and resolution quality. Question 3 is the one that predicts your reconciliation results, and it is the same question that decides whether your ecommerce API integrations ever agree with each other.
⚠️ Why question 7 catches the most tools
Repeatability is the cheapest test in this list, and almost nobody runs it. One reviewer described the BI version of this problem two decades before agents existed.
"The sampling also means that you will not receive the same answer twice." - Gitai B., Marketing, Web Analytics, and Testing Lead Google Analytics - G2 Verified Review, 1/5
Ask Luca AI the same question on Monday and Thursday, and the number holds, because the semantic layer does not get re-interpreted per query.
💸 Ask about support before you ask about features
Accuracy problems become support tickets. Support quality decides whether they get fixed.
"Customer service takes several weeks to respond to simple requests and usually regurgitate information from their website." - Verified User Supermetrics - G2 Verified Review, 0/5
"Sometimes the database pulls incorrect data and I have to keep updating it so that it pulls correctly." - Verified User Supermetrics - G2 Verified Review, 2.5/5
Ask for the median first-response time in writing. Then ask what happens when a connector breaks in November, which is the season most teams start hunting Supermetrics alternatives.
⭐ The onboarding question nobody asks
One operator framed AI adoption well. You are hiring someone with a PhD in every domain, and even that person fails without an onboarding process and clear expectations.
So ask what onboarding the agent needs. If the answer is "none," they are either lying or the tool does not use your context.
Luca AI normalizes and standardizes data on ingestion, and we would rather tell you that upfront than pretend context appears by magic. You can see how that logic works in practice on the Luca AI use cases page.
⏰ Score the call, not the vibe
Eight questions, pass or fail, filled in during the call. Do not write it up afterward from memory.
Luca AI shows the query and source rows behind each answer, which is the difference between auditing a vendor and trusting one.
Q10. How do you ship it without betting the quarter? [toc=10. Staged Rollout]
Three stages. Weeks one to two: read-only, reconciliation only, no decisions. Weeks three to six: anomaly alerts you verify manually before acting. Week seven onward: decision support limited to question types that cleared your eval set. Luca AI starts read-only and pushes threshold alerts on ROAS, CAC, and inventory into Slack or email, which is the safest first stage of any rollout. Re-run all ten questions after every model update, schema change, or new source.
📅 The three stages, with gates
Do not skip a stage because the demo impressed you. Each gate exists because of a specific failure.
Staged Rollout Plan for an AI Data Agent
Stage
Timeline
What the agent does
Gate to advance
1. Read-only
Weeks 1-2
Reconciles closed weeks, answers nothing binding
Revenue variance under 3%, margin under 8%
2. Verified alerts
Weeks 3-6
Flags anomalies, you check each one manually
80% of alerts confirmed as real
3. Decision support
Week 7+
Answers cleared question types, feeds real decisions
8 of 10 eval questions passing
Staged capability evaluation is the standard recommendation for Shopify-native agents, precisely because level one usefulness gets sold as autonomy. The same caution applies to any agentic AI for ecommerce founders.
⚠️ Do not let the AI be the QA
Specialized published an AI-generated homepage image for a $20,000 road bike with the rear derailleur, the gear mechanism, placed on the front wheel. It shipped publicly.
The lesson transfers directly to data. The agent can produce the work, and a human still signs the number.
Merchants who skipped that step have written it up in detail.
"Beware of Shopify's AI Help Assistant. It wasted days of my time with wrong answers... always verify AI-generated answers against the actual documentation." - r/shopify Reddit Thread
🔁 What triggers a re-test
Evaluation is not a purchase decision, it is a maintenance habit. Drift happens quietly, and published guidance recommends tracking it against model updates, schema changes, and new features.
Re-run all ten questions when any of these happen:
The vendor ships a model or pipeline update.
You connect a new source, or change your 3PL.
You change how you calculate COGS or landed cost.
A new product line or region launches.
Any answer surprises you, in either direction.
Twenty minutes, four times a year. Cheaper than one bad allocation, and it keeps your ecommerce monitoring tools honest.
❌ The tension I have not resolved
Two credible operators disagree here, and I am genuinely unsure who is right.
One insists on human review of everything before anything ships. Another argues that tight guardrails prevent you from learning what these tools can actually do.
My read leans toward the first for anything touching money, and the second for exploration. Luca AI runs read-only from day one for exactly that reason, and we treat the alert layer as training wheels rather than a feature to rush past.
⏰ Your first two weeks, concretely
Week one: connect sources, reconcile one closed week, and name every variance rule you find. Week two: reconcile a second week and confirm the numbers repeat.
Luca AI monitors connected data continuously and pushes custom reports on a schedule you set, which turns stage two into something that runs without you remembering to check.
💰 What I think shifts by 2027
My hypothesis is that eval sets become as normal as a P&L template. Every serious store will keep ten questions and a variance sheet, the way they keep a chart of accounts.
If you run the reconciliation this month, I would genuinely like to know which line drifted worst on your data. That number is more interesting than any benchmark, so tell us what you are seeing.
FAQ's
What does evaluating AI data agents actually involve?
Evaluating AI data agents means testing answers against numbers you already know are correct, rather than judging how confident the output sounds. Two layers do the work.
Deterministic checks first. Validate SQL correctness, exact value matching, retrieval completeness, and numeric accuracy on ROAS, CAC, and cohort figures.
Reasoning checks second. Score intent alignment at 35 percent, analytical depth at 30 percent, actionability at 25 percent, and clarity at 10 percent, each rated 1 to 5.
The practical version takes two weeks. Reconcile one fully closed week of profit and loss against your manual close, then ask ten questions whose answers your bookkeeper already confirmed. Revenue variance above 3 percent or margin variance above 8 percent is a fail.
Luca AI exposes the query and source rows behind each answer, which is what turns a variance into a rule you can name rather than an argument you repeat every Monday. We treat traceability as the precondition for any accuracy claim.
Set the gate before you begin. Eight correct out of ten is a pass, and ten out of ten usually means your questions were too easy. If you want the broader context on how agents differ from reporting tools, our guide to agents for ecommerce covers the architecture underneath.
Why do benchmark accuracy scores fall apart on my own store data?
Because published benchmarks test clean schemas and your store is not clean. The gap is documented and large.
Spider 1.0: best systems clear roughly 91 percent execution accuracy on tidy academic databases.
BIRD: around 73 percent on dirtier, larger academic data.
Spider 2.0: roughly 21 percent once real enterprise warehouses are used.
BEAVER: close to zero end to end on a live company warehouse.
A store doing 1M to 5M carries 40 or more tables once Shopify, Meta, Google, Klaviyo, and an accounting tool are connected. Column names repeat with different meanings, and refunds land in two places. Structurally, that is the hard case.
The fix is scaffolding, not model choice. Published vendor research shows accuracy climbing from 10 to 20 percent on raw schemas to 90 to 99 percent once definitions and business rules are supplied.
Luca AI resolves commerce metric relationships in a modeling layer beneath the chat surface, and we treat that layer, not the underlying model, as the accuracy variable. Anyone comparing options should read how this plays out across ecommerce analytics platforms before trusting a demo score.
Why don't my AI analytics numbers match my Shopify admin?
Nine times out of ten the query was fine and the definitions disagreed. Vendors document these gaps themselves, and there are four usual culprits.
Zero-value and missing-ID orders. Cohort tools exclude first orders with no value or no customer ID, while Shopify counts them.
Post-purchase order edits. Edited orders get booked to the original order date, so a day's sales shift after the fact.
Timezone boundaries. Your admin closes the day in store time, and the ad platform closes in account time.
Blended versus SKU-level cost. One shipping average across every product hides the item that is bleeding margin.
That last one is expensive. A founder I sat with was certain her hero product carried a 72 percent gross margin. Rebuilt line by line with real shipping, returns, and support costs, the actual contribution margin was 8 percent.
Luca AI normalizes and standardizes data on ingestion so one definition set spans every connected source, and we would rather settle a rule once than re-litigate a number weekly. The distinction between the two margin figures is unpacked in our piece on contribution margin versus gross margin.
Which metrics prove an AI data agent is ready for production?
Score eight metrics, and weight the last three heavily, because they decide whether the agent survives a real Monday.
Execution accuracy: the query returns the right rows.
Semantic accuracy: the number matches your own metric definition.
Groundedness: every claim traces back to a retrieved row.
Hallucination rate: share of answers containing invented facts.
Tool-call accuracy: it picks the right source and function.
Trajectory quality: the reasoning path is sensible, not six detours.
Repeatability: the same question returns the same number on Thursday.
Cost per answer: dollars and seconds consumed per question.
Run the repeatability test on three separate days with unchanged data. If the figure moves, the agent is not evaluable, and you cannot defend it in a budget meeting.
Set latency thresholds too. Under 60 seconds for a single-source question and under three minutes for a multi-source one is reasonable, because a slow correct answer gets overruled by a gut call.
Luca AI answers against a fixed semantic model, so repeat questions return repeat numbers instead of fresh interpretations. Our overview of ecommerce KPIs covers which business metrics deserve a place in that test set.
How is an AI data agent different from a dashboard with a chat box?
Four tests separate them, and each takes minutes to run in a demo.
Cross-source reasoning. Does it join Shopify, ad platforms, email, and accounting in one answer, or query one source at a time?
Definition ownership. Does it hold your metric definitions centrally, or recompute them per tool?
Proactivity. Does it surface anomalies unprompted, or wait until you ask?
Output shape. Does it end at a chart, or at a recommendation with a ranked root cause?
Most analytics tools added AI to an existing dashboard in the last two years without rebuilding what sits underneath. A chat box over inconsistent per-tool definitions produces confident answers on wrong numbers, which is worse than no answer.
Luca AI is an AI layer over your warehouse that predicts, simulates, and traces root cause across sources, rather than a chat interface bolted to a reporting view. We would also say plainly who this is not for: below roughly 1M in revenue, marketplace-only sellers, and pure B2B stores get less from it, because there is not enough history for pattern detection.