10 Supermetrics Alternatives for Ecommerce in 2026
12
mins read
TL;DR
The 10 best Supermetrics alternatives for ecommerce in 2026 are Luca AI, Triple Whale, Funnel.io, Improvado, Windsor.ai, Porter Metrics, Dataslayer, Coupler.io, Whatagraph, and Fivetran.
Teams leave Supermetrics for three reasons: pricing that stacks past $300 a month, connectors that break on large catalogs, and an EL model that moves data but never decides.
Before switching, check three things: SKU-level operational depth, auditable versus black-box attribution, and true cost after every add-on and seat.
Match the tool to the job: a connector moves data, a reporting layer presents it, and a decision layer recommends the next move.
Migrate one high-value report first, standardize your lookups on ingestion, and your existing Looker Studio and Sheets dashboards survive the move.
The frontier is shifting from monitoring to recommending, pairing cross-functional intelligence with embedded, dynamically priced capital.
Q1: What Are the 10 Best Supermetrics Alternatives for Ecommerce in 2026? [toc=1. Best Alternatives]
The best Supermetrics alternatives for ecommerce in 2026 are Luca AI, Triple Whale, Funnel.io, Improvado, Windsor.ai, Porter Metrics, Dataslayer, Coupler.io, Whatagraph, and Fivetran. They win on stronger Shopify and Amazon coverage, simpler pricing, or the measurement and operational depth Supermetrics lacks. The cheapest are Porter (from ~$15/mo) and Windsor.ai (from ~$19/mo). Free tiers exist on Porter, Dataslayer, Windsor.ai, Coupler.io, and Whatagraph. Supermetrics itself is excluded, since this is a list of what to use instead.
Here is the honest starting point. I have looked at a lot of Shopify P&Ls, and the pattern is always the same. The tool moves data into a sheet, and a human still has to decide what the data means. So I split this list by that exact line: tools that move data, and tools that help you decide. I score each on five things, weighted like this: Cross-Functional Intelligence (25%), Ecommerce Data Depth (25%), Capital and Action (20%), Setup and Usability (15%), and Pricing Transparency (15%). Scores map to stars, from 1 star (0 to 20) up to 5 stars (81 to 100). If you want the deeper method behind these weightings, our guide to ecommerce analytics platforms breaks it down.
One belief drives the whole ranking. A founder I work with put it bluntly: stop building dashboards to show off technical range. Dashboards were meant to pull the decision out of the raw data, the decision a normal person cannot see. Most tools here stop before that step. A few go past it, and that is the shift we cover in how AI can actually help you run your e-commerce business.
📋 The 10 Tools at a Glance
Luca AI: Best for cross-functional decisions and embedded capital
Pricing reflects publicly listed starting and upper plan prices and shifts with sources, destinations, and data volume; treat these as directional, not quotes.
1.1 Luca AI [toc=1.1 Luca AI]
Luca homepage promoting a single AI intelligence layer for €1M–€100M ecommerce brands, positioned as a Supermetrics alternative that unifies marketing data and surfaces insights through conversation.
Luca AI is an AI layer that sits on top of your ecommerce data warehouse. You connect Shopify, Meta, Google, Klaviyo, and your accounting tools, then ask questions in plain English. It extracts the relevant slice from a messy pool of data, predicts on your history, simulates scenarios, finds the root cause of a swing, and names the components driving it. It is not an attribution pixel, and it does not replace one. You can see the full picture on our use cases page.
🤔 Why did we choose this tool?
I am Eric, founder of Luca, so let me be straight about why it sits first. It is not first because I built it. It is first because it is the only tool here that answers what to do, not just where the data goes. Most analytics tools bolted AI onto a dashboard. Luca is AI at the core, trained on how ecommerce metrics relate. It reads across marketing, finance, and operations in one place. That cross-functional read is the thing a connector cannot do, no matter how many sources it pipes, and it is the core of our approach to ecommerce business intelligence.
⚙️ Solutions Offered
Ask questions in plain English, with no SQL, no analyst, and no dashboard-building.
Automated weekly and monthly reports pushed to Slack or email, with graphs, reasoning, and recommendations.
24/7 scanning that pings you when ROAS dips, CAC spikes, or inventory falls below a threshold.
Root-cause and scenario analysis across marketing, finance, and operations in one thread.
Data normalized and standardized on ingestion, so you skip the cleanup year.
📈 Core Metrics That Matter Here
Data sources connected: commerce, ads, accounting, and banking in one model
Setup time: minutes, no data team required
Analysis type: descriptive, predictive, root-cause, and prescriptive
Alerting: 24/7 outlier detection to Slack, email, and app
Capital: embedded, dynamically priced (a separate pillar, judged on capital terms only)
🎯 Best For
Founders and CFOs at scaling DTC brands who are tired of the Monday export ritual.
Teams under fifty people with real data but no in-house analyst.
Operators who want a recommendation, not another chart to read.
Luca is not the right fit for everyone. If you are sub-$10K MRR, pure B2B, or a marketplace-only seller with thin data, a plain connector will serve you better and cheaper. I would rather say that than pretend otherwise.
📊 Case Study
⚠️ What was the problem? A skincare brand doing mid-seven figures on Shopify believed its hero SKU ran a 72% gross margin. The founder could not make them fast enough, so she kept scaling spend behind it.
✅ How Luca helped? We pulled her Shopify orders, ad spend, and accounting data into one model. Instead of blended shipping across all products, Luca calculated contribution margin line by line for that single SKU, including the eight costs that sit between the supplier invoice and real profit. The distinction we relied on is explained in our breakdown of contribution margin vs gross margin.
💰 What was the outcome? The real contribution margin was 8%, not 72%. She reallocated spend to two mid-tier SKUs Luca flagged as genuinely profitable, and stopped bleeding cash on a "winner" that was barely breaking even.
Triple Whale is the strongest pure-play DTC attribution tool on this list. It runs a first-party pixel, a clean profit dashboard, and Moby, its AI agent. It connects Shopify and your ad platforms fast, and it shows blended ROAS in a way most founders find readable at a glance. It sits in the decision-adjacent bucket, but its lens stays on marketing. We compare it in depth in our roundup of Triple Whale alternatives.
🤔 Why did we choose this tool?
For DTC brands whose main question is "which ad actually worked," Triple Whale earns its spot. Operators consistently say attribution gets clearer once the pixel is running, and the daily profit view saves real time versus logging into each ad platform. The honest caveat: it is a marketing measurement tool, not a finance brain. It does not touch your accounting layer, and its attribution is modeled, so treat it as directional, not gospel. For the fuller measurement context, see our guide to ecommerce conversion tracking.
⚙️ Solutions Offered
First-party pixel for multi-touch attribution across ad channels.
Blended ROAS and daily profit dashboard for Shopify brands.
Moby AI agent for automated marketing analysis.
Creative and campaign performance breakdowns.
Real-time monitoring across connected marketing sources.
📈 Core Metrics That Matter Here
Data sources connected: Shopify and major ad platforms, limited Amazon
Setup time: minutes via the Shopify app
Analysis type: marketing attribution and blended ROAS
Alerting: marketing-metric anomaly detection
Capital: none
🎯 Best For
DTC Shopify brands running meaningful spend across Meta and Google.
Growth leads who need attribution clarity fast.
Teams that accept modeled, directional attribution over ground truth.
💬 Reviews
"I love how seamlessly it connects our ad platforms and CRM data, showing exactly where our conversions come from and which campaigns drive the most revenue. Its made attribution so much clearer." Verified User Triple Whale G2 Verified Review
"The concept behind the system is quite good. However, despite paying over 600 each month, we still do not receive any customer support. We have been waiting for a resolution to one issue for three months now, and all we are told is that they are working on it." Verified User Triple Whale G2 Verified Review
1.3 Funnel.io [toc=1.3 Funnel.io]
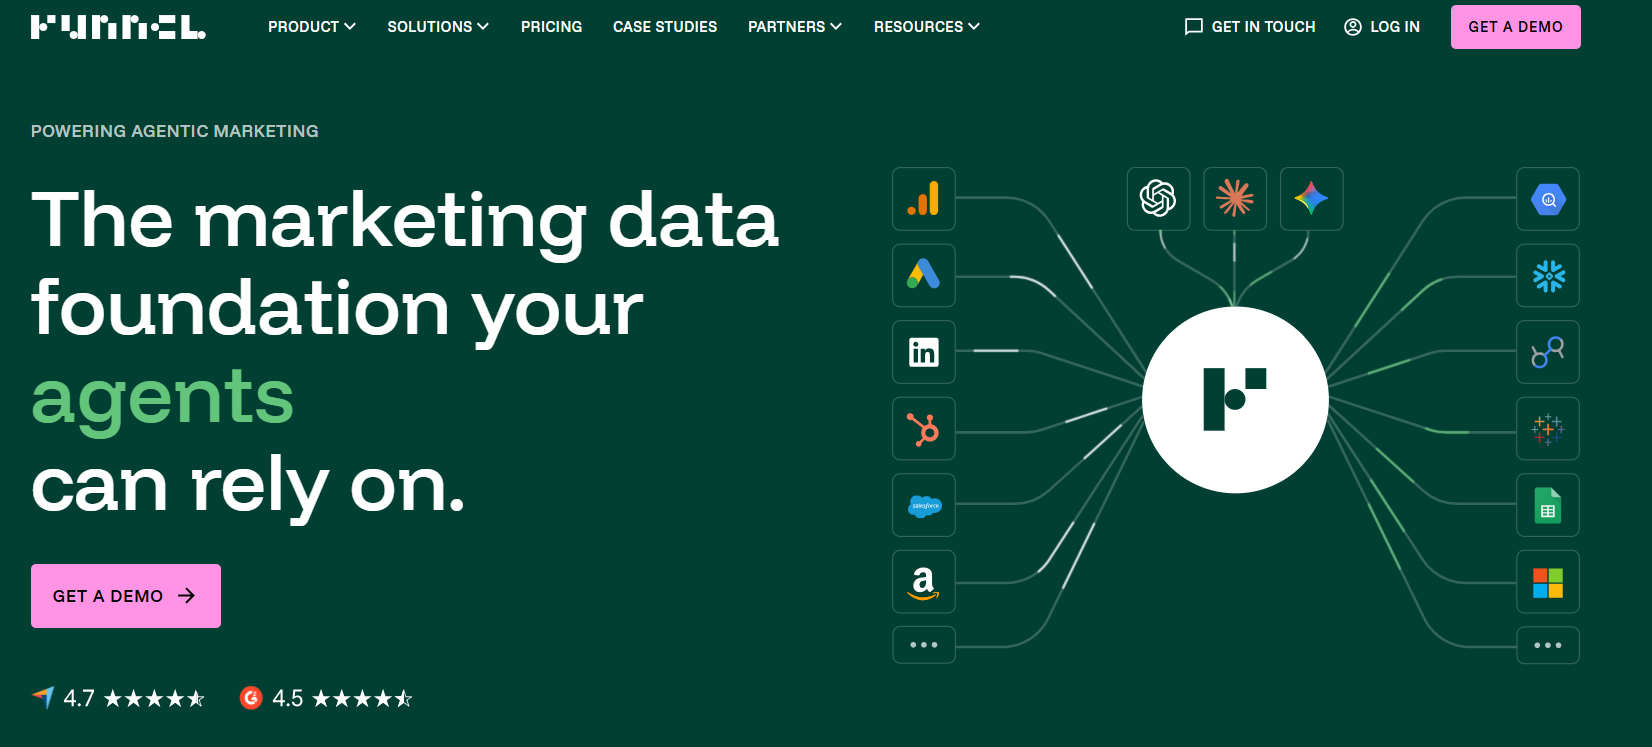
Funnel.io homepage showcasing its marketing data foundation linking Google Ads, LinkedIn, HubSpot, Salesforce and Amazon integrations, presented as a robust Supermetrics alternative for ecommerce data aggregation and reporting.
Funnel.io is a marketing data collection and governance layer built for larger teams. It pulls from 500+ sources, cleans and harmonizes the data, then exports clean tables to a warehouse or a BI tool. It does not decide anything for you. It makes sure the data feeding your decisions is trustworthy and consistent. For the wider context, see our guide to ecommerce data integration.
🤔 Why did we choose this tool?
Funnel earns its place because data hygiene is a real, boring, and expensive problem. When ad platforms rename fields or break naming conventions, Funnel standardizes it so your dashboards do not lie. The honest trade-off is cost and scope. It is priced by data sources and shares, so a brand with many small connectors pays more, and at its core, it stays an ETL tool, not an analyst.
⚙️ Solutions Offered
500+ marketing and ecommerce connectors into one structured feed.
Automated data cleaning, field mapping, and harmonization on ingestion.
Exports to BigQuery, Snowflake, Power BI, Tableau, and Looker Studio.
Custom metrics and dimensions for consistent cross-channel reporting.
Data Explorer for quick ad hoc analysis without a warehouse.
📈 Core Metrics That Matter Here
Data sources connected: 500+ across ads, ecommerce, and CRM
Setup time: moderate, with a real learning curve on complex setups
Analysis type: collection, cleaning, and export (descriptive)
Alerting: not a core strength
Capital: none
🎯 Best For
Mid-market and enterprise teams with a data warehouse and BI stack.
Agencies managing many client accounts under one roof.
Teams that value data governance over built-in recommendations.
💬 Reviews
"Funnel makes it very easy to connect all our relevant marketing and analytics data sources in one place and keep them synced automatically." Muhammad Abdullah S., CRM Campaign Manager Funnel.io G2 Verified Review
"It used to be affordable and came with support, but then they changed their model and no longer provide support." Ya Hui Debbie K., Director of Marketing Funnel.io G2 Verified Review
1.4 Improvado [toc=1.4 Improvado]
Improvado is an ETL and marketing data platform aimed at agencies and mid-market data teams. ETL means extract, transform, load: it pulls raw data, reshapes it, and pushes clean data into your warehouse or dashboards. It goes deeper on transformation than a simple connector, which is both its strength and its learning curve. If you are still mapping your stack, our overview of the e-commerce tech stack helps.
🤔 Why did we choose this tool?
Improvado handles cross-platform data manipulation that basic connectors cannot. Operators say it opens up what you can actually do with your data once it lands. The flip side shows up fast: it is powerful but steep. If nobody on your team knows databases or transformations, onboarding is real work, and one person often ends up owning the whole thing.
⚙️ Solutions Offered
Extraction from dozens of marketing and sales platforms.
Deep data transformation and blending across sources.
Push to BigQuery, Looker, and other BI destinations.
Marketing data warehouse with governance features.
An AI layer for analysis (though some users find it over-pushed).
📈 Core Metrics That Matter Here
Data sources connected: dozens across marketing and sales
Setup time: steep, best with a data-literate owner
Analysis type: ETL and transformation (descriptive)
Alerting: limited
Capital: none
🎯 Best For
Agencies aggregating many client data sources.
Mid-market teams with at least one data-fluent operator.
Companies needing heavy transformation, not just extraction.
💬 Reviews
"The easines with which we can set data extractions from different platforms. That users can be onboarded easily. Good customer suppor when tickets are created." Verified User Improvado G2 Verified Review
"There is a steep learning curve, and if you arent familiar with databases, Excel, and data transformations, this could be a really tough software to implement." Verified User Improvado G2 Verified Review
1.5 Windsor.ai [toc=1.5 Windsor.ai]
Windsor.ai is the wide, cheap connector of this group. It offers 300+ connectors and pipes data into Google Sheets, Looker Studio, BigQuery, Power BI, and more. Reviewers repeatedly call it cheaper than Supermetrics and Funnel, with strong support. It is a data-movement tool, not a decision engine. For deeper connector strategy, see our notes on ecommerce API integrations.
🤔 Why did we choose this tool?
For budget-conscious brands that just need reliable data feeds, Windsor is hard to beat on price. Users highlight fast, responsive support and easy setup with no code. The caveats are real too: some connectors occasionally need a manual data check, and at least one reviewer flagged rigid billing when trying to downgrade. Validate a new connector before trusting it blindly.
⚙️ Solutions Offered
300+ connectors into Sheets, Looker Studio, and warehouses.
No-code setup with prebuilt dashboard templates.
AI-generated data schema to reduce manual modeling.
An MCP server usable from tools like Claude.
Hourly data refresh options for near-real-time dashboards.
📈 Core Metrics That Matter Here
Data sources connected: 300+ marketing and ecommerce
Setup time: fast, slight learning curve on custom pipelines
Analysis type: extraction and export (descriptive)
Alerting: limited
Capital: none
🎯 Best For
Small businesses and agencies on a tight tooling budget.
Teams living in Google Sheets or Looker Studio.
Brands wanting broad coverage without Supermetrics pricing.
💬 Reviews
"The most helpful part of Windsor.ai is its ability to connect multiple marketing data sources quickly and reliably. It simplifies data integration and makes it easier to create unified reports without complex setup." Cristian C., Administrador Windsor.ai G2 Verified Review
"Their billing practices are unethical and rigid. I attempted to downgrade my subscription because the current plan no longer fit my needs, but support refused to void the invoice or change the plan." Diego Cadavid Windsor.ai G2 Verified Review
1.6 Porter Metrics [toc=1.6 Porter Metrics]
Porter Metrics is the cheapest way to get marketing data into Looker Studio and Google Sheets. It is built for small businesses, freelancers, and agencies that want no-code connectors without an enterprise contract. It focuses narrowly on reporting connectors, not warehousing or analysis. Compare it against other Shopify reporting apps.
🤔 Why did we choose this tool?
Price and simplicity are the whole pitch, and Porter delivers on both. Plans start low (from around $15/mo), so a solo operator can wire up Meta, Google, and Shopify into a Looker Studio dashboard in an afternoon. The trade-off is scope. Porter moves data to reports. It will not transform at scale, warehouse your data, or tell you what the numbers mean.
⚙️ Solutions Offered
No-code connectors for Looker Studio and Google Sheets.
Coverage for Meta, Google, TikTok, Shopify, and more.
Prebuilt report templates for fast setup.
Scheduled data refreshes.
Free trial and low entry pricing.
📈 Core Metrics That Matter Here
Data sources connected: major ad and ecommerce platforms
Setup time: very fast, no code
Analysis type: reporting connector (descriptive)
Alerting: not a core feature
Capital: none
🎯 Best For
Freelancers and small agencies on Looker Studio.
Early-stage brands watching every dollar of tooling spend.
Teams that need dashboards, not data engineering.
1.7 Dataslayer [toc=1.7 Dataslayer]
Dataslayer is a budget connector with one of the highest ratings in the category, roughly 4.8 on G2. It pipes ads and marketing data into Looker Studio, Google Sheets, BigQuery, and via API. Like Porter and Windsor, it moves data. It does not decide. If reporting is your real need, our guide to ecommerce reporting goes further.
🤔 Why did we choose this tool?
A high rating on a large review base is a real trust signal, and Dataslayer earns its budget-connector spot on reliability and value. It covers the ad platforms most DTC brands actually run. The honest limit is the same as its peers: it is a reporting pipe, so you still need a BI layer and a human to interpret the output.
⚙️ Solutions Offered
Connectors for major ad platforms into Looker Studio and Sheets.
BigQuery and API export options.
Prebuilt templates for common reports.
Scheduled refreshes and backfills.
Free tier for light usage.
📈 Core Metrics That Matter Here
Data sources connected: broad ads and marketing coverage
Setup time: fast, no code
Analysis type: reporting connector (descriptive)
Alerting: limited
Capital: none
🎯 Best For
PPC and performance teams reporting in Looker Studio.
Agencies wanting reliability at a low price.
Brands that value a strong review track record.
1.8 Coupler.io [toc=1.8 Coupler.io]
Coupler.io is a no-code data automation tool with a genuine free tier. It connects apps, transforms data, and syncs it to Sheets, Looker Studio, BigQuery, and Excel on a schedule. It leans more toward general data automation than ecommerce-specific analytics. For a fuller view, read our take on ecommerce data management.
🤔 Why did we choose this tool?
The free tier lowers the barrier for a brand testing whether automated reporting saves real time. Coupler handles scheduling and light transformation well, so you stop copy-pasting exports every Monday. The caveat is focus. It is a horizontal automation tool, not an ecommerce brain, so the ecommerce context and interpretation still fall on you.
⚙️ Solutions Offered
No-code connectors across marketing, sales, and finance apps.
Scheduled syncs to Sheets, Looker Studio, and BigQuery.
Built-in data transformation and blending.
Prebuilt dashboard templates.
Free tier to start.
📈 Core Metrics That Matter Here
Data sources connected: broad, multi-department
Setup time: fast, no code
Analysis type: automation and export (descriptive)
Alerting: limited
Capital: none
🎯 Best For
Small teams automating recurring reports.
Operators wanting a free entry point.
Businesses beyond pure ecommerce needing flexible connectors.
1.9 Whatagraph [toc=1.9 Whatagraph]
Whatagraph is a white-label reporting tool built for agencies that send branded reports to clients. It connects marketing sources and turns them into polished, shareable dashboards. Its ecommerce depth is thinner, and Shopify or Amazon coverage tends to sit on higher-tier plans (reportedly around $675/mo). For how presentation fits the bigger picture, see ecommerce data visualization.
🤔 Why did we choose this tool?
If your product is client reporting, presentation matters, and Whatagraph nails the branded, readable output. It saves agencies hours of manual deck-building each month. The trade-off for DTC operators is real: it is reporting-first, ecommerce-second, and the pricing to unlock the connectors a store needs climbs quickly. Read the plan tiers before committing.
⚙️ Solutions Offered
White-label, branded client reports and dashboards.
Cross-channel marketing data aggregation.
Templated reports with scheduled delivery.
Connectors across major ad and analytics platforms.
Team and client access controls.
📈 Core Metrics That Matter Here
Data sources connected: broad marketing, thinner ecommerce
Setup time: moderate, template-driven
Analysis type: reporting and presentation (descriptive)
Alerting: limited
Capital: none
🎯 Best For
Agencies delivering branded client reports.
Teams prioritizing presentation over data engineering.
Marketing-led accounts, not deep ecommerce finance.
1.10 Fivetran [toc=1.10 Fivetran]
Fivetran is the warehouse-first pipeline of the group. It automates data movement from 500+ sources into a data warehouse using managed connectors and change data capture (CDC), which syncs only what changed. It is built for data engineers, not for founders asking questions in plain English. If you would rather skip that layer, our guide to ecommerce data analytics shows the alternative.
🤔 Why did we choose this tool?
For teams that have already committed to a warehouse-centric stack, Fivetran is a reliable backbone. It handles pipeline maintenance so your engineers stop babysitting broken connectors. The honest fit check: usage-based pricing can scale unpredictably, and it stops at the warehouse door. Everything downstream, the modeling, the BI, and the actual decision, is still on your team.
⚙️ Solutions Offered
500+ managed connectors into major data warehouses.
Change data capture for efficient incremental syncs.
Automated schema handling and pipeline maintenance.
Transformations via dbt integration.
Enterprise-grade security and governance.
📈 Core Metrics That Matter Here
Data sources connected: 500+ into warehouses
Setup time: engineer-led, warehouse required
Analysis type: pipeline and ingestion (foundational)
Alerting: pipeline monitoring only
Capital: none
🎯 Best For
Data engineering teams with a warehouse strategy.
Larger brands with complex, high-volume pipelines.
Companies that treat data infrastructure as a core asset.
Where this list nets out for an operator: eight of these ten tools move or present data, and you or your analyst still owns the decision. ✅ Luca reasons across marketing, finance, and operations in one place. ✅ It scans 24/7 and pings you when ROAS dips or inventory runs thin. ❌ A connector like Windsor or Fivetran sees the pipe, never the picture. ✅ Luca can also fund a restock inside the same chat, through its Capital-Backed Insights. ❌ A standalone financing application sees your revenue but none of the operational context behind it. That gap between moving data and owning outcomes is the whole reason Luca sits at the top of this list, and it is the core of our agentic AI for ecommerce founders approach.
Q2: Why Are Ecommerce Teams Actually Leaving Supermetrics? [toc=2. Why Teams Leave]
Teams leave Supermetrics for three reasons. Pricing stacks per source and per destination until a simple setup passes $300 a month. Connectors hit query and application programming interface (API) limits on large ecommerce catalogs. And at its core, it is an EL tool, meaning it extracts and loads raw data into a sheet, but it never tells you whether the SKU is profitable. This is the exact gap our guide to ecommerce data analytics unpacks.
😩 The Monday Export Ritual
Picture the Monday morning most operators know too well. You open the same set of ecommerce reports, wait for the connectors to sync, and stitch numbers into a sheet. One founder told me the routine makes them shudder now, and I get it.
You get bombarded with dashboards, PDFs, emails, and spreadsheets. Yet you end up processing maybe 5% of the data the business actually generates. The tool moved the data. It did not lighten the load. That is why we rethought ecommerce reporting from the ground up.
💸 The Price Cliff Nobody Warns You About
Supermetrics is priced for a job that ends before the decision starts. A Starter plan can begin around $55 a month, then climb fast as you add sources and destinations.
Operators feel this on the invoice, not the pitch. Trustpilot rates Supermetrics just 1.9 out of 5 across 21 reviews, with billing and support as the loudest complaints.
Large catalogs strain the connectors. Users report query failures and API limits, and Supermetrics' own guidance often points to splitting big queries into smaller ones.
The reviews carry the same theme, even at a respectable 4.4 out of 5 on G2 across 823 reviews.
"Nothing. This tool is full of promises, but you are met with unstable connectors, unresponsive incompetent customer service, and obscene limitations for any scalable business." Verified User Supermetrics G2 Verified Review
"We are a startup company and mainly use Supermetrics for Shopify API. Data is inaccurate when it comes to Daily Total Sales and Returning Orders figures." Verified User Supermetrics G2 Verified Review
🧭 What Fixes Each Pain
The connectors on this list fix the price and reliability pain. Porter and Windsor.ai cut the bill. Dataslayer and Coupler.io steady the feeds. Many of these show up in our roundup of ecommerce analytics platforms.
Fixing the Monday-export pain is different. That needs a tool that reasons over the data, not just one that moves it. Luca AI sits in that lane, reading your sources into one model and telling you what the numbers mean, not just where they landed.
Q3: What Should You Actually Check Before Switching (Ecommerce Data Depth, Attribution Transparency, Real Cost)? [toc=3. What To Check]
Check three things before switching. Whether the tool reaches SKU-level operational data (fees, settlements, and inventory) or only ad metrics. Whether its attribution is auditable or a black box. And what it truly costs after add-ons. For Shopify and Amazon operational depth, the deepest tools go to SKU economics, while most alternatives stay marketing-reporting-first.
📉 The 72% Margin That Was Really 8%
A founder slid a supplier invoice across the table and told me her hero SKU ran a 72% gross margin. Twenty minutes later, after we mapped the real costs, she was close to tears.
We rebuilt the math line by line. Contribution margin, the profit left after all variable costs, came in at 8%, not 72%. Gross margin had been a comforting lie, and our breakdown of contribution margin vs gross margin explains why.
🧾 Real Cost After Add-Ons
The sticker price is rarely the real price. Add sources and destinations, and the bill climbs. Here is how a common stack tends to shake out. For the full picture, see our notes on ecommerce profit margins.
Real Cost After Add-Ons for a Typical Ecommerce Stack
Stack Element
Typical Cost Driver
Real-World Note
Shopify, Meta, and Google
Base connector plan
Entry price, few sources
Add Amazon
Extra source fee
Cost steps up per source
Ecommerce data on higher tier
Plan gating
Whatagraph gates Shopify and Amazon near ~$675/mo
Client or team seats
Per-seat add-ons
Scales with headcount
🕵️ Auditable vs Black-Box Attribution
Attribution decides where you send your ad dollars, so you should be able to audit it. Many tools model attribution behind a curtain, and operators notice when the numbers do not tally. Our take on ecommerce conversion tracking goes deeper here.
"The dashboard part, for some reason the data is not correct, its as if the dont take into account returns or something, on the dashboard I get overestimated sales and ROAS." Verified User Triple Whale G2 Verified Review
Treat modeled attribution as directional, not truth. A tool that shows its working earns more trust than one that just hands you a confident number.
🎭 The SKU-Masking Risk
Blended numbers hide the real story. When you spread shipping costs evenly across all products, a heavy, cheap item can quietly bleed cash behind a healthy-looking blended margin.
I have watched brands discover that major categories had swung massively year over year, and they never saw it. The blend masked the shift until it hit the bank balance. Better ecommerce inventory management starts with seeing each SKU clearly.
✅ Your Three-Question Pre-Switch Checklist
Does it read SKU-level fees, settlements, and inventory, or only ad metrics?
Can I audit the attribution, or is it a black box?
What is the all-in cost after every add-on and seat?
Luca AI reads Shopify, Amazon, Stripe, and accounting data into one model. So the 8% contribution margin and the masked category surface on their own, with the influencing components named. It finds the root cause. It does not ask you to build the cohort dashboard first.
Q4: Do You Need a Data Connector, a Reporting Tool, or a Decision Layer? [toc=4. Connector vs Decision Layer]
Match the tool to the job. Need data in Looker Studio? Buy a connector (Porter, Windsor.ai, and Coupler.io). Need client or team reports? Buy a reporting layer (Whatagraph, Funnel.io, and Improvado). Drowning in dashboards and need the next move recommended? You need a decision layer that reasons over the data, not another pipe that dumps it.
🧩 The Three Job Types, Plainly
Think of it as three different jobs, not three brands. A connector moves data from a source into a sheet or dashboard. That is extract-and-load, or EL.
A reporting layer cleans, transforms, and presents that data, often for clients or execs. A decision layer goes one step further. It reads the data and tells you what to do next, which is the heart of agentic AI for ecommerce founders.
🏪 How a $200K/Month Shopify Brand Routes Each Job
Say you run a $200K-per-month Shopify brand. You want Meta and Google data flowing into Looker Studio, so a connector like Windsor.ai handles that cheaply.
Your agency needs branded weekly reports, so a reporting layer like Whatagraph or Funnel.io covers presentation. But the real question, "what do I do about this week's CAC spike," belongs to a decision layer, which is where ecommerce business intelligence actually earns its keep.
🚀 From Monitoring to Recommending
The biggest shift I see coming is the move from monitoring to recommending. Descriptive analytics tells you what happened. Prescriptive analytics tells you what to do.
We humans are bad at digesting raw metrics, so the raw data should feed the model, not your tired eyes. The plain-English query trend is accelerating this, with category tools shipping MCP-style, ask-in-English interfaces through 2026. Our view on predictive analytics for ecommerce traces where this heads next.
🌳 The Monday Decision Tree
Run this quick check before you buy:
Just need data in a dashboard? Buy a connector.
Need polished reports for clients or leadership? Buy a reporting layer.
Already have dashboards but still stuck on the next move? Buy a decision layer.
The decision layer is where Luca AI sits. It is an AI layer over your warehouse that answers questions in plain English, simulates the scenario, and flags both the areas to improve and the areas already well optimized, rather than handing you another set of raw metrics to read.
Q5: What Can an Integrated Intelligence-Plus-Capital Model Add for Scaling DTC Brands? [toc=5. Intelligence + Capital]
When you scale a winning campaign, the bottleneck is often capital speed, not insight. On capital terms, an embedded model competes on disbursal time (instant versus 24 to 48 hours for application-based providers), pricing that flexes with real-time business health rather than an application snapshot, and no incentive to oversize the advance. That is how you fund a hot campaign while it is still hot. This is where revenue-based financing meets real-time intelligence.
⏰ Before: The Three-Week Gap That Kills Momentum
Picture a founder who finds a genuine winner. The ad is printing, the return on ad spend (ROAS) holds, and inventory is thinning fast. The obvious move is to pour fuel on it.
So she applies for working capital. Wayflyer reviews the application, typically within 24 hours, then sends funds 1 to 3 business days after she signs. By the time the money lands, the auction has shifted and the moment has cooled. Smart ecommerce inventory management depends on that timing.
💰 The Bridge: Compare Capital on Capital Terms
Set the analytics aside and judge the capital on its own metrics. That means disbursal speed, the rate, whether pricing flexes, and how much friction sits in the application.
Disbursal speed: Application-based providers like Wayflyer and Clearco quote as little as 24 to 48 hours after approval.
Pricing basis: Revenue-based financing (RBF), where you repay from a share of sales, often prices off a one-time application snapshot.
Incentive: A provider paid on advance size has a quiet reason to push a larger advance than you need.
I will hedge this honestly. RBF can be genuinely useful above roughly $5M in gross merchandise value (GMV), where the terms tighten and the fee spreads over real volume. The deeper story sits in declining platform ROAS vs true profitability.
✅ After: Funded While the Campaign Is Still Hot
An embedded model changes the timing math. Luca AI's capital is instant and dynamically priced to your real-time business health, with no application and no incentive to oversize the advance.
So on disbursal time and pricing fairness, it competes directly with Wayflyer and Clearco. The synthesis line matters here: capital without intelligence is just risk with a deadline. Where I might be wrong is on edge cases, but my read right now is that the founders who win the next 18 months fund the decision the same hour they make it, an idea we explore in agentic AI for ecommerce founders.
Q6: How Do You Migrate Off Supermetrics Without Rebuilding Everything? [toc=6. Migration Plan]
You do not rebuild everything at once. Map your current Supermetrics queries, pick the alternative that matches your job type, standardize your data on ingestion so you skip the cleanup year, and migrate one high-value report first. Most connectors mirror Supermetrics' Sheets and Looker Studio destinations, so your existing dashboards survive the move. Our guide to ecommerce data integration maps this out.
😰 The Fear: Losing a Reporting Weekend
The biggest reason people stall is a quiet dread. They picture a lost weekend rebuilding every dashboard from scratch. That fear is mostly unfounded.
Most alternatives push to the same destinations you already use. Your Looker Studio and Google Sheets reports keep working once the new feed points at them, which is why solid ecommerce platform integration matters.
🧹 The Unlock: Standardize Your Lookups First
Before you migrate a single report, standardize your lookups. That means fixing naming, currencies, and product mappings so the same thing is labeled the same way everywhere. This one step saves the most pain later.
Feeding messy data into any tool, especially an AI one, just moves the mess downstream. Clean it once at the source, and every report downstream gets more reliable. Good ecommerce data management is the foundation here.
🧭 Your Five-Step Monday Migration
Map every active Supermetrics query and note its destination.
Match your job to a tool: connector, reporting layer, or decision layer.
Standardize lookups and product mappings before you pull anything.
Migrate your single highest-value report first, ideally contribution margin by SKU.
Validate the numbers against last week, then retire the old query.
Luca AI normalizes and standardizes data on ingestion, so the migration skips the cleanup year. Plug in, ask, and act. The real win is reallocating your team's Monday from data assembly to actually reading what the numbers say, the promise behind Shopify custom reports.
Q7: Which Supermetrics Alternative Is Right for You? [toc=7. Which To Choose]
Choose by your real job. Porter Metrics or Windsor.ai if you only need cheap data in Looker Studio, Whatagraph or Funnel.io for agency client reporting, Triple Whale for DTC attribution, and Luca AI if you are done exporting spreadsheets and want a system that reasons across your business. Pick for the decision you keep avoiding. If you are still weighing options, our roundup of best AI tools for Shopify owners helps.
🧭 Match the Persona to the Pick
A big enterprise moves like a cargo ship, slow and heavy on process. A smaller ecommerce brand is a jet ski, agile and fast. So an agile brand should not buy enterprise ETL it cannot staff. Our take on the e-commerce tech stack explains why fit beats firepower.
Supermetrics Alternatives Matched to Your Situation
Your Situation
The Right Pick
Just need data in Looker Studio, cheaply
Porter Metrics or Windsor.ai
Agency sending branded client reports
Whatagraph or Funnel.io
Mid-market team needing heavy transformation
Improvado or Fivetran
DTC brand chasing ad attribution
Triple Whale
No-code automation with a free start
Coupler.io or Dataslayer
Drowning in dashboards, want the next move
Luca AI
💬 The One Question Worth Answering
Here is my position, and I will own it. For a scaling DTC brand drowning in dashboards, a bare connector is the wrong purchase. It solves a data-movement problem you may not actually have, as our overview of ecommerce business intelligence shows.
So I will leave you with a question, not a pitch. If your Monday still starts with a Shopify export, tell us the one number you can never trust. That is the conversation Luca AI was built for.
FAQ's
What are the best Supermetrics alternatives for ecommerce in 2026?
We rank ten strong options, each winning on a different job.
Luca AI: best for cross-functional decisions and embedded capital.
Triple Whale: best for DTC marketing attribution.
Funnel.io and Improvado: best for enterprise and agency data governance.
Windsor.ai, Porter Metrics, Dataslayer, and Coupler.io: best budget connectors.
Whatagraph: best for white-label client reporting.
Fivetran: best for warehouse-first pipelines.
The honest split is simple. Eight of these tools move or present data, and a human still owns the decision. We built Luca to close that gap by reasoning across marketing, finance, and operations in one place.
Porter starts near $15 a month and Windsor.ai near $19, so budget teams have real choices. If you are tired of exporting spreadsheets every Monday, explore how our ecommerce analytics platforms approach turns raw data into a recommendation, not just another dashboard to read.
Why are ecommerce teams leaving Supermetrics?
We see three consistent reasons in the field.
Price stacking: pricing climbs per source and per destination until a simple setup passes $300 a month.
Connector limits: large catalogs hit query and API caps, and users report data accuracy gaps.
The deeper gap: Supermetrics is an EL tool. It extracts and loads raw data into a sheet, but it never tells you whether a SKU is profitable.
Trustpilot rates Supermetrics around 1.9 out of 5, with billing and support as the loudest complaints, while G2 sits higher at 4.4. That trust gap tells the story.
The Monday export ritual is the real pain. You get bombarded with dashboards and spreadsheets, yet process maybe 5% of the data. Fixing that needs a tool that reasons over the data, which is why we designed Luca for ecommerce reporting that ends with a recommendation, not another export.
What should you check before switching from Supermetrics?
We recommend checking three things before you commit.
Operational depth: does the tool reach SKU-level fees, settlements, and inventory, or only ad metrics?
Attribution transparency: can you audit the attribution, or is it a black box?
True cost: what is the all-in price after every add-on and seat?
Here is why depth matters. We once watched a founder believe her hero SKU ran a 72% gross margin. After mapping real costs line by line, the contribution margin was 8%. Blended shipping had masked the truth.
Treat modeled attribution as directional, not gospel, and watch for SKU-masking, where blended numbers hide a category quietly bleeding cash. Luca reads Shopify, Amazon, Stripe, and accounting data into one model, so the masked margin surfaces on its own. See how we separate contribution margin vs gross margin to protect your real profit.
Do you need a data connector, a reporting tool, or a decision layer?
We think of it as three different jobs, not three brands.
Connector: moves data from a source into a sheet or dashboard (Porter, Windsor.ai, Coupler.io).
Reporting layer: cleans, transforms, and presents data for clients or execs (Whatagraph, Funnel.io, Improvado).
Decision layer: reads the data and tells you what to do next.
Say you run a $200K-per-month Shopify brand. A connector feeds Looker Studio cheaply, a reporting layer covers branded client decks, but the question 'what do I do about this week's CAC spike' belongs to a decision layer.
The biggest shift we see is the move from monitoring to recommending. Descriptive analytics tells you what happened; prescriptive analytics tells you what to do. That is where Luca sits, an AI layer over your warehouse. Learn how our agentic AI for ecommerce founders answers in plain English and flags the next move.
How do you migrate off Supermetrics without rebuilding everything?
We promise you do not rebuild everything at once. Most alternatives push to the same destinations you already use, so your Looker Studio and Google Sheets reports survive the move.
Run this five-step sequence:
Map every active Supermetrics query and note its destination.
Match your job to a tool: connector, reporting layer, or decision layer.
Standardize lookups, currencies, and product mappings before you pull anything.
Migrate your single highest-value report first, ideally contribution margin by SKU.
Validate the numbers against last week, then retire the old query.
The unlock is standardizing your data on ingestion. Feeding messy data into any tool just moves the mess downstream, so clean it once at the source. Luca normalizes and standardizes data on ingestion, so you skip the cleanup year. See how solid ecommerce data integration reallocates your team's Monday from data assembly to reading what the numbers say.
Enjoyed the read? Join our team for a quick 15-minute chat — no pitch, just a real conversation on how we’re rethinking Ecommerce with AI - Luca
Loading Schedule...
Your AI Co-Founder is here.
Here’s why:
Shopify, Meta, Xero - one brain.
"Should I scale?" Answered with real data.
Growth capital. No applications. One click.
Thank you! Your submission has been received! Please book a time slot for the Meeting
Oops! Something went wrong while submitting the form.